The Complexity of the Future of Work
by
Morgan Ryan Frank
Submitted to the Program in Media Arts and Sciences,
School of Architecture and Planning,
in partial fulfillment of the requirements for the degree of
Doctor of Philosophy
in Media Arts and Sciences
at the
MASSACHUSETTS INSTITUTE OF TECHNOLOGY
June 2019
@Massachusetts
Institute of Technology 2019. All rights reserved.
Signature redacted
A uthor ...
Certified by ...
Pro
ra ,
i
edia Arts and Sciences
April 20, 2019
Signature redacted
...
Iyad"Rahwan
Associate Professor of Media Arr'and Sciences
Thesis Supervisor
Signature redacted'
Accepted by . . ... ... ..
MASSACHUSETTS INSTITUTE
Tod Machover
OC Academic Hea Program in Media Arts and Sciences
0
JUL 2 6 2019
The Complexity of the Future of Work
by
Morgan Ryan Frank
Submitted to the Program in Media Arts and Sciences, School of Architecture and Planning,
on April 20, 2019, in partial fulfillment of the requirements for the degree of
Doctor of Philosophy in Media Arts and Sciences
Abstract
Rapidly advancing cognitive technologies, such as artificial intelligence (AI), have the potential to drastically impact modern society and to shape the future of work. Accordingly, policy mak-ers and researchmak-ers seek forecasts into technological change and labor trends, including growing
job polarization and income inequality as well as decreasing career mobility and spatial mobility
for workers. Although a given technology impacts demand for only a narrow set of workplace skills, modern empirical work relies on coarse labor distinctions between cognitive and physical or routine and non-routine work to explain employment trends. In this dissertation, I explore the complex ways that skills and employment undergird aggregate labor dynamics in the US. As a mo-tivating example, I demonstrate how simple measures for skills within a labor market contribute to the differential impact of automation across US cities of different sizes. I build on this motivation to address methodological barriers through a refined model of workplace skills and their inter-dependencies, thus connecting microscopic workplace connections to macroscopic labor trends. I perform an unsupervised analysis of specific workplace skills as a skills network whose aggregate
and refined topology grant new insights into job polarization and workers' career mobility. Since these inter-skill connections predict career mobility, I construct a map of US occupations that cap-tures worker transition rates between employment opportunities and, in combination with urban employment data, predicts workers' spatial mobility. These refined models that connect workplace skills to both inter-city and intra-city dynamics enable new insights and new input data sources for real-time labor trends at the level of specific technologies and specific workplace skills. I con-clude by exploring one novel and potentially useful source of input information: the evolution of scientific Al research. The analyses in this dissertation provide new tools to policy makers design-ing viable worker retraindesign-ing programs, offer new insights to individual workers navigatdesign-ing their careers, and present new measures for economic resilience in the face of changing technology. Thesis Supervisor: Iyad Rahwan
This doctoral thesis has been examined by the following committee members:
Signature redacted
Professor Iyad Rahwan ...
Thesis Supervisor
Associate Professor of Media Arts and Sciences
AT&T Career Development Professor of Media Arts and Sciences
Signature redacted
Professor Alex 'Sandy' Pentland ...
V
66
siCommittee
Professor of Media Arts and Sciences
Toshiba Professor
Media Lab Entrepreneurship Program Director
Signature redacted
Professor Erik Brynjolfsson .(
F
Thesis Committee
Schussel Family Professor of Management Science Professor of Information Technology
Acknowledgments
I have many people to thank for enabling my academic journey thus far. This is only the surface. First, thank you to my loving parents, Stephen and Ellen Frank. You first taught me to balance pushing myself with having fun. Through literal and metaphorical peaks and valleys, your love and support for me have been rock solid and provided the foundation I rely on. Thank you for being the first to see my intellectual curiosity even from a very young age; even though my role in
science involves fewer test tubes and bubbling liquids than I expected back then.
I am lucky to have many friends who have advised me and guided me through the opening
stages of my academic journey. Thank you Professor Doug Dickey (UVM) and Professor Jeff Dinitz (UVM) for first pointing me towards academia during an extremely uncertain time in my life when I was unsure that I would even complete a bachelor degree. I am forever grateful that you started me on this path and for your continued support of my adventures since then. You saw in me the potential to love science.
I am immensely grateful to my masters advisers, Professor Chris Danforth (UVM) and
Profes-sor Peter Dodds (UVM). Thank you for allowing my forced entry into the Computational Story Lab. My time with you showed me what academia is all about, and your guidance led me to share your love for science. Further, and more importantly, you both taught me to pursue a full and complete life in addition to scientific pursuits; these lessons have proven to be an essential asset and advantage over my peers in my adventures since leaving home. Because of you, I know how to do science and have fun.
Thank you to Professor Iyad Rahwan (MIT, Max Planck Institute) for your invaluable guidance through my PhD. You taught me to dream bigger and to ask bigger questions; these lessons have forever altered how I see science and my role in contributing to it. Especially, thank you for teach-ing me to engage with new academic communities and to constantly consider the larger picture as
I pursue bodies of work over one-off projects. Finally, thank you for your unwavering support of
all things not academic during my time as your student; my family is extremely grateful for your flexibility, support, and trust in me.
you across the country and back to "try-out" an industry job. You give me the daily support I rely on to pursue my goals. You make me feel like anything is possible and that I can dream as big, or as small, as I want. You make me laugh when I am too serious, and you make me focus when I am too distracted. You do all of these things even while you pursue your own daring ambitions. I am constantly in awe of you and your goals, and I am lucky that you are on my side while I pursue my career.
Contents
1 Introduction
1. 1 M otivation . . . . 1.2 Statement of Problem . . . .
1.3 Conceptual Framework for Study . . . .
1.4 Research Questions . . . .
1.5 Significance of the Study . . . .
1.6 Lim itations . . . .
1.6.1 Causally relating skills to career success . . . .
1.6.2 Which skills will be automated by technology? . . . 1.6.3 How is technology changing over time? . . . . 2 A Framework for Studying the Future of Work
2.1 A history of automation and the rise of Artificial Intelligence
2.2 Contrasting Perspectives on the Future of Work . . . .
2.2.1 Doomsayer's Perspective . . . .
2.2.2 Optimist's Perspective . . . .
2.2.3 Unifying Competing Viewpoints . . . .
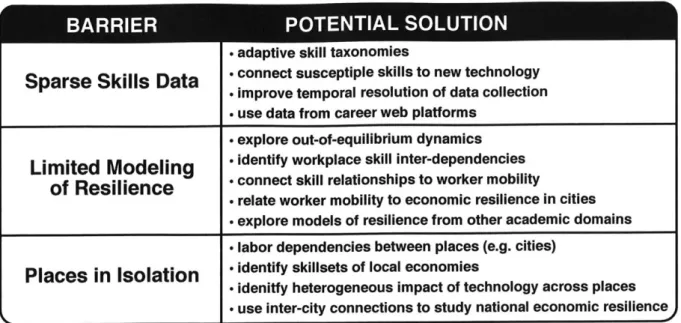
2.3 Barriers to Forecasting the Future of Work . . . .
2.3.1 Barrier: Sparse Skills Data . . . .
2.3.2 Solutions to Improve Skills Data . . . .
2.3.3 Barrier: Limited Modeling of Resilience . . . .
43 43 44 45 47 48 49 49 49 50 51 . . . . . 51 . . . . . 54 . . . . . 54 . . . 54 . . . 56 . . . 56 . . . 56 . . . 58 . . . 60
2.3.4 Solutions for Fostering Resilient Labor . . . 61
2.3.5 Barrier: Places in Isolation . . . 63
2.3.6 Solutions for Studying Technology's Impact on Spatial Dependencies . . . 64
2.4 Technological change and an improved data-pipeline . . . . 64
3 Small cities face greater automation 67 3.1 Motivation . . . 67
3.2 Background: Automation & Urbanization . . . 68
3.3 Materials and Methods . . . 69
3.3.1 Data Sets . . . 69
3.3.2 Measures for Specialization and Diversity . . . 70
3.4 Results: Exploring the Differential Impact of Automation in Cities of Different Sizes 72 3.4.1 The Expected Job Impact of Automation in Cities . . . 72
3.4.2 Labor Specialization in Large Cities . . . 74
3.4.3 How Occupations and Workplace Skills Change with City Size . . . 78
3.4.4 Limitations . . . 84
3.5 Discussion . . . 84
4 Unpacking the polarization of workplace skills 87 4.1 Motivation . . . 87
4.2 Background: Workplace Skills and Job Polarization in the US . . . . 88
4.3 Materials and Methods . . . 90
4.4 Results: Exploring Skill Polarization . . . 91
4.4.1 Constructing the Skill Network . . . . 91
4.4.2 Identifying Skill Polarization from the Bottom-Up . . . . 94
4.4.3 Comparison with Top-Down Categorization . . . . 95
4.4.4 The Skills of Urban Workforces . . . . 97
4.4.5 Skillscape Proximity & Skill Acquisition . . . . 97
4.5 Discussion . . . . . .... . .. . . . .......105
5 The hidden constraints on worker mobility: how workplace skills determine a worker's next move 107 5.1 M otivation . . . 107
5.2 Background: Skills and the Rungs of the Career Ladder . . . 108
5.3 Results: How Skills Underpin Aggregate Labor Trends . . . 109
5.3.1 Skill Similarity Determines Job Polarization . . . 109
5.3.2 The Job Network Predicts Career Mobility . . . 111
5.3.3 Tightly Connected Urban Economies Support Greater Spatial Mobility . . 114
5.4 D iscussion . . . 119
6 The evolution of citation graphs in artificial intelligence research 121 6.1 M otivation . . . 121
6.2 Background: Artificial Intelligence and Society . . . 122
6.3 Modem Artificial Intelligence Research . . . 123
6.4 Shaping the Study of Intelligent Machines . . . 125
6.5 The Consolidation of Artificial Intelligence Research . . . 128
6.6 D iscussion . . . 133
A Towards Understanding the Impact of AI on Labor 135 A.I Identifying Characteristic Skills . . . 135
A.2 Tracking Programming Language Popularity . . . 136
B Small cities face greater impact from automation 137 B.I Firm Size Increases with City Size . . . 137
B.2 Measuring Labor Specialization . . . 138
B.2.1 Normalized Shannon Entropy . . . 138
B.2.2 The Labor Specialization of Individual Jobs . . . 139
B.3 Estimating the Affects of Automation . . . .
B.3.1 Estimating Automation Impact using Frey/Osborne Data . . . .
B.3.2 Estimating Automation Impact using OECD Data . . . . B.3.3 Expected Job Impact & Labor Specialization in Cities . . . . . B.3.4 Explaining Differences in Expected Job Impact . . . .
B.3.5 Labor Specialization as a Mediator for City Size and Automation B.4 Robustness Check of the Linear Regression Model for Em . . . . B.5 Simplifying Jobs & Skills . . . .
B.5.1 O*NET Task Groups . . . .
B.5.2 The Routineness of Tasks . . . . B .6 D ata Tables . . . .
B.6.1 Cities Ordered by Expected Job Impact from Automation . . . .
B.6.2 Relating City Trends to BLS Jobs . . . .
B .6.3 Job G roups . . . . B.6.4 Relating City Trends to O*NET Skill . . . .
B .6.5 Skill Types . . . . . . . 14 1 . . . 142 . . . 144 . . . 145 . . . 148 Impact . 152 . . . 154 . . . 155 . . . 157 . . . 158 . . . 162 . . . 162 . . . 17 1 . . . 183 . . . 195 . . . 201 C Unpacking the polarization of workplace skills
C.I Exploring Occupations and their Constituent Skills . . . .
C.2 Skill Complementarity propensities and clusters . . . . C.3 How Educational Requirements Relate to Skill Requirements for Occupations . . .
C.4 Validating Skill Polarization . . . .
C.5 Projecting Urban Workforces onto the Skillscape . . . .
C.6 Predicting Economic Well-Being with Socio-Cognitive Skills . . . . C.6.1 Predicting Annual Wages of Occupations . . . .
C.6.2 Predicting Median Household Income of Cities . . . .
C.7 Using Skillscape Proximity to Predict Labor Dynamics . . . . C.7.1 Occupation Transitions of Urban Workforces . . . .
C.7.2 Worker Occupation Mobility is Constrained by Skill Polarization . . . . . 205 205 209 212 213 214 216 216 220 224 230 231
C.7.3 The Trimodal Employment Distribution over cognitivej is Robust . . . 233
C.7.4 Bar plots for main paper figure 3 including 95% confidence intervals. . . . 236
D Hidden constraints on career mobility: How workplace skills determine a worker's next move 237 D.I Constructing the Job Network . . . . D.2 Testing Job Network Modularity . . . . D.3 Tracking Career Mobility through the Community Population Survey D.4 Aggregations of Workplace Skills . . . . D.4.1 O*NET Task Groups . . . . D.4.2 Cognitive/Physical & Routine/Nonroutine Tasks . . . . D.5 Exploring Inter-city Mobility Patterns With Labor Data . . . . D.5.1 Introduction to Mobility Data . . . . D.5.2 Introduction to the Gravity Model for Mobility . . . . D.6 Explaining Differences in City's Job Tightness . . . . . . . 237 . . . 238 . . . 239 . . . 239 . . . 240 . . . 242 . . . 243 . . . 243 . . . 244 . . . 245
E The evolution of citation graphs in artificial intelligence research 251 E.I Microsoft Academic Graph Fields of Study . . . 251
E.1.1 Computer Science Subfields . . . 252
E.2 Computer Science Subfield Citation Networks by Decade . . . 252
E.3 Distribution of Artificial Intelligence Productivity by Research Institution . . . 258
E.4 The Preference of Academic Fields for Industry Artificial Intelligence Publications 258 E.5 Bibliometric Diversity by Academic Field . . . 261
E.6 Authorship by Field of Study Over Time . . . 266
E.7 Authorship by Al Research Institution . . . 267
List of Figures
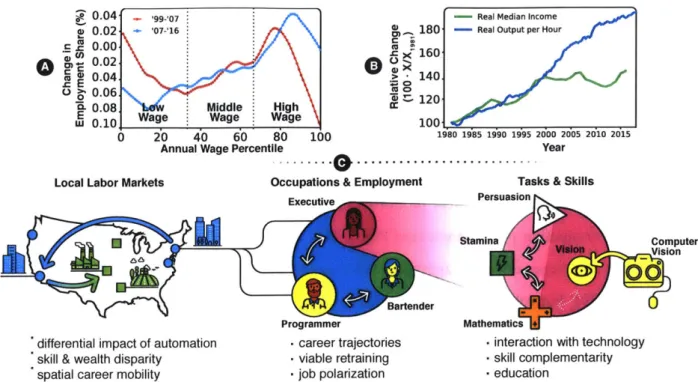
2-1 Motivating and describing a framework to study the technologies impact on workplace skills.
(A) Following [7], we use ACS national employment statistics to compare the change in
employment share (y-axis) of occupations according to their average annual wage (x-axis) during two time periods. Employment share is increasing for low- and high-wage occupa-tions at the expense of middle-wage occupaoccupa-tions. (B) Following [57], we use data from the Federal Reserve Bank of St. Louis to compare U.S. productivity (real output per hour) and workers' income (real median personal income), which have traditionally grown in tan-dem. The efficiency gains of automating technologies are thought to contribute to this so called "Great Decoupling" starting around the year 2000. (C) A framework for studying technological change, workplace skills, and the future of work as multi-layered network. (Left) Cities and rural areas represent separate labor markets, but workers and goods can flow between them. (Middle) Each location can be represented as an employment distri-bution across occupations. Connections between occupations in a labor market represent viable job transitions. Job transitions are viable if workers of one job can meet the skill re-quirements of another job (i.e. "skill matching" [156]). (Right) Workers' varying skill sets represent bundles of workplace skills that tend to be valuable together. Skill pairs that tend to co-occur may identify paths to career mobility. Technology alters demand for specific workplace skills, thus altering the connections between skill pairs. As an example, machine vision software may impact the demand for human labor for some visual task. These al-terations can accumulate and diffuse throughout the entire system as aggregate labor trends described in (A ) & (B). . . . . 55
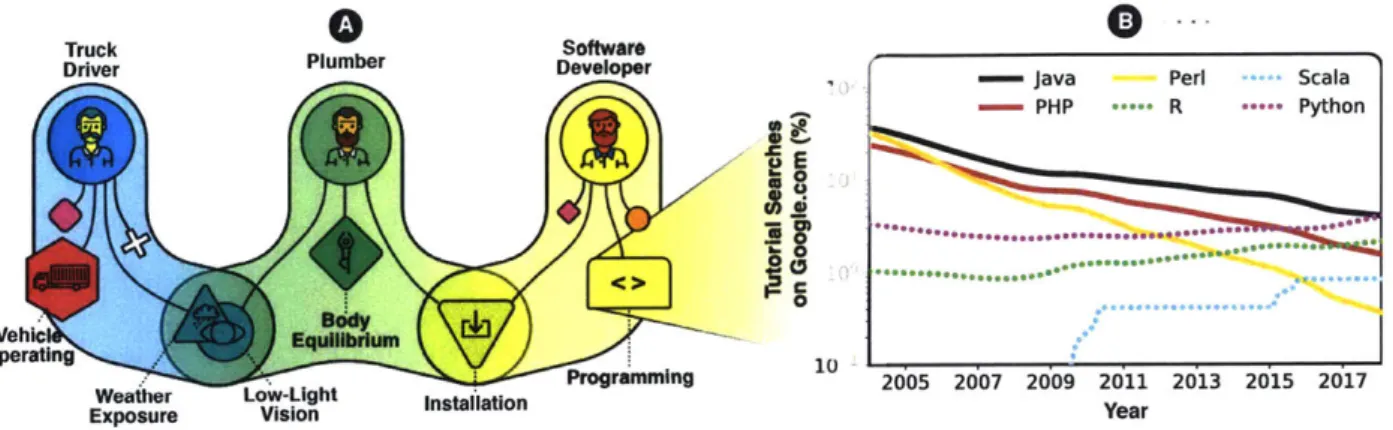
2-2 Since the skill requirements of occupations may inform opportunities for career mobility, ab-stract skill data may obfuscate important labor trends. (A) We use O*NET data to identify the characteristic skill requirements for Truck Drivers, Plumbers, and Software Developers (see section A.1 for calculation). Individual skills may be unique to an occupation (e.g. Op-erating Vehicles) or shared between occupations (e.g. Low-Light Vision). The skill Installa-tion is required by both Plumbers and Software Developers, but this skill may not mean the same thing to workers in these two occupations. Programming is a skill required by Soft-ware Developers, but the coarseness of this skill definition may hide important dynamics brought on by new technology, including A. (B) For example, we provide the percentage of Google searches for coding tutorials by programming language. Trends are smoothed using locally weighted scatter plot smoothing (see section A.2 for calculation). The Python pro-gramming language is widespread in the field of machine learning. Therefore, the increased ubiquity of Al and, in particular, machine learning may contribute to Python's steady growth in popularity. . . . 59
2-3 Skill complementarity may define the structural resilience of a workforce and inform worker retraining programs. (A) As in climatology and ecology, the structural pathways constrain-ing labor dynamics could determine the resilience of a labor market to changconstrain-ing labor skill demands. In this example, we connect occupation pairs with high skill similarity because skill similarity might indicate easier worker transitions between job titles. Borrowing from research on ecological systems [100], the density of connections between occupations could determine "tipping points" for aggregate employment in cities. (B) With recent concerns of automation [76, 199], which jobs might be suitable for Paralegals and Legal Assistants if employment for these jobs diminishes? Better resolution into skill requirements could help identify occupations that rely on similar skills, but also rely on skills that are removed from competition with technology. In this example, we identify characteristic skills using the
O*NET database to find that Paralegals rely on many shared workplace skills with Human
Resource Specialists. Human Resource Specialists rely on social skills, which are not easily automated [78]. See section A.1 for skill calculations. . . . . 62
2-4 A data pipeline that overcomes barriers to studying the future of work. (A) Inputs into the
data pipeline include structured and unstructured data that details regional variations in la-bor and granular skills data in relation to technological change. (B) Data from a variety of sources will need to be centralized and processed into a form that economists and data scientists can easily use (e.g. natural language processing to identify skill from resume and
job postings). (C) Cleaned data feeds a model for both the inter-city (e.g. worker migration)
and intra-city (e.g. changes to local career mobility) labor trends brought on by technolog-ical change. (D) Outputs from this model will forecast the labor impact of technologtechnolog-ical change. These forecasts will inform policy makers seeking to implement prudent policy and individual workers attempting to navigate their careers. . . . . 65
3-1 The impact of automation in U.S. cities. (A) The distribution of expected job impact (E,,) from automation across U.S. cities using estimates from [98]. (Inset) The distribution using alternative estimates [16]. (B) Expected job impact decreases logarithmically with city size using estimates from [98]. We provide the line of best fit (Slope = -3.215) with Pearson correlation to demonstrate significance (title). We also provide a Gaussian kernel regression model with its associated 95% confidence interval. (Inset) Decreased expected job impact with increased city size is again observed using alternative estimates [16] (best fit line has slope -1.24, Pearson p = -0.26, pa, < 10--7). (C) A map of U.S. metropolitan statistical
areas colored according to expected job impact from automation. . . . . 73
3-2 Large cities reveal increased occupational specialization through both job and skill distri-butions. (A) Shannon entropy of job distributions, HJob(m), decreases with city size. (B) Shannon entropy of the O*NET skill distributions, Hskill(m), decreases with city size. (C) Theil entropy, Tm, reveals the proportion of specialized jobs increases with city size. For plots (A), (B), & (C), we provide the line of best fit for reference, and we provide a Gaus-sian kernel regression model with its associated 95% confidence interval. . . . . 75
3-3 Labor specialization can model expected job impact (E,) in cities. (A) A multiple linear regression analysis for predicting E, that considers generic urban indicators including log1 0 city total employment (size,,), median annual household income (incomem), percentage of population with a bachelor's degree (bachelorm), logio GDP per capita (GDPm), and the number of unique occupations (jobsm). All variables have been standardized. (B) The actual Em values for each city plotted against the predicted values using Model 8 from (A), which captures 66% of the variance in expected job impact from automation across U.S. cities (see section B.4 for additional analysis). (C) The distribution of residuals between the actual and predicted values from Model 8, and the rank of some example cities. . . . . 77
3-4 An occupation shift explaining the difference in expected job impact for the 50 largest cities (impact: 0.60) compared to the 50 smallest cities (impact: 0.65) using equation (3.8). Each horizontal bar represents (Small CitiesLarge Cities)(j). The occupation title is provided next to the corresponding bar and colored according to its job cluster. Red bars repre-sent occupations with higher risk of computerization compared to the expected job impact in large cities. Blue bars represent occupations with lower risk of computerization com-pared to the expected job impact in large cities. Dark colors represent occupations that increase the difference, while pale colors represent occupations that decrease the difference in expect job impact. Bars in each of the quadrants are vertically ordered according to
|S(Small CitiesLarge Cities)(j)|. The inset in the bottom left of the plot summarizes the overall in-fluence of resilient occupations compared to occupations that are at risk of computerization.
3-5 Technical occupations grow superlinearly with city size. (A) We project jobs onto a 2-D plane using principal component analysis. A few representative jobs from each cluster are highlighted (color). (B) We plot the employment (y-axis) in a given job cluster (color) versus the total employment in a city (x-axis), and vertically shift points according to the linear fit in log scale. The black dashed line has a slope of I for reference. (C) The influence of each job cluster on the difference in expected job impact of the 50 largest cities (ELarge cities = 0.60) compared to the 50 smallest cities (Esmna1cities = 0.65) according to equation (3.10). (D)
After summing the importance of each skill type to each job cluster, we calculate z scores for a skill type according to the distribution of importance across job clusters. . . . . 81
3-6 Workplace skills explain occupational specialization and job impact in cities. (A) & (B)
Skill types in (A) indicate specialized cities, while skill types in (B) indicate occupational diversity. (C) & (D) Skill types in (C) indicate resilient cities, while skill types in (D) indicate increased job impact from automation. (E) The Pearson correlation of skill type abundance to the expected job impact and to logo city size with p-values in parentheses. See subsection B.6.4 for a similar table for raw O*NET skills. . . . . 83
4-1 Constructing the Skillscape. (A) An occupation is identified through the skills of workers of that occupation. The bipartite network connecting occupations to required skills is a result of an underlying tripartite network containing workers as a conduit between occupations and skills. Relationships between skills are determined from their co-occuring importance across occupations. (B) Unlike previous applications of RCA (insets), the Skillscape contains a bimodal distribution of pairwise skill complementarity. (C) The Skillscape thresholded ac-cording to a minimum skill similarity (i.e. 0 > 0.6) visibly reveals two communities of complementary skills and respects expertly-derived O*NET categories (colors). Node sizes reflect the total skill similarity shared between that skill and all other skills. . . . . 93
4-2 The polarized Skillscape explains occupational wage polarization and economic well-being of urban workforces. (A) Community detection on the complete Skillscape network (i.e. no minimum 0) reveals two communities of complementary skills: socio-cognitive skills (blue) and sensory-physical skills (red). The displayed network is filtered (0 > 0.6) for visualiza-tion purposes. (B) Occupavisualiza-tions relying on socio-cognitive skills tend to make higher annual salaries. (C) Larger cities rely more strongly on socio-cognitive skills (inset) yielding higher median household income by comparison to smaller cities. In (B) & (C), example occupa-tions (cities), along with their annual wages (median household income), are projected onto the Skillscape using black nodes for effectively used skills. (D) The skill network colored
by correlation between onet(j,s) and the average educational degree requirement across
4-3 Reliance on cognitive skills predicts increased annual wages according to OLS regression. As a baseline, we consider the relative importance of routine labor using routine O*NET variables from [24]. In addition to cognitive skill fraction (cognitive), we calculate the total skill content (Esonet(j,s)) of each occupation. Each educational variable represents the total employment in that occupation whose highest educational degree is a high school diploma, bachelor's degree, etc. All variables were standardized before regression. Standard errors are reported in parentheses and asterisks indicate the statstical significance of coeffi-cient approximations. We perform out-of-sample testing for each model through 1,000 trails of randomly selecting 75% of the occupations as training data and measuring the root-mean squared error of the resulting model applied to the remaining 25% of occupations. We rep-resent the resulting model performance as box plots. Median error reprep-resented by a red line, while the mean error is represented by the triangles. . . . . 98
4-4 Skill proximity predicts worker transitions between occupations, skill redefinition of occu-pations, and skill acquisition in cities. (A) An example demonstrating Skillscape proximity
(i.e. proximity(j, s)) as a proxy for the connections between effectively used skills and other
skills. (B) Skills with high proximity to the effectively used skills of an urban labor market in 2010 are more likely to be effectively used by that work force in 2015. (C) Skills with high proximity to the effectively used skills of an occupation in 2010 are more likely to be effectively used by that occupation in 2015. (D) The effectively used skills of a workers occupation in 2015 are more likely to be effectively used by the workers next occupation in 2016. We provide bar plots including 95% confidence intervals for these probability in subsection C.7.4, and we consider an alternative Receiver Operator Curve analysis in sec-tion C .7 . . . . 10 3
4-5 The polarized skill network constrains worker mobility. Binning by the cognitivej of the
worker's occupation in 2014 reveals the (A) expected cognitive change and (B) the expected magnitude of cognitive change when workers change occupations. Random occupation se-lection is considered as a null model (grey). Standard error bars are provided, but are small. Actual occupation transitions are provided as examples in (A). (C) The national distribution of employment by cognitivej with the distribution of individual occupations as an inset. (D) The average complementarity strength that skills possess in each skill category; this measure corresponds to worker mobility because skill proximity is indicative of skill acquisition. . . 104
5-1 The polarized U.S. job network distinguishes cognitive and physical labor. (A) Nodes rep-resent U.S. occupations which are connected by weighted edges determined by their skill similarity (i.e. skillsim(jj')). Colors indicate node communities, or occupation types, as determined by Louvain community detection [50]. Example job titles from each occupa-tion type are provided in tables. This visualizaoccupa-tion has filtered edges to include the occu-pation pairs with the strongest skill similarity scores (skillsim(jj') > 0.5). All analysis, including community detection, was performed using the unfiltered network. (B) A map of U.S. cities colored by their cognitive employment share. (C) Using socio-cognitive and sensory-physical skill categories from [10], we find that one occupation type (identified by yellow in (A)) relies more strongly on social and cognitive skills. Hence, we refer to these occupations as cognitive occupations and refer to the other occupation type (identified by purple in (A)) as physical occupations. (D) Cognitive occupations tend to earn higher av-erage annual wages. Using occupational computerization estimates from (E) [98] and from (F) [16], cognitive occupations are less susceptible to automation in the foreseeable future. Each comparison in (C)-(F) is significantly different according to a two-tailed t-test and the K S-statistic (Palue K < 10--). ...112
5-2 Skill similarity predicts worker flows between occupation pairs. (A) Incrementally including
O*NET skills in the skill similarity model (x-axis) yields diminishing improvements in the
model's ability to capture variance in worker flows between job titles according the average
R2 values after 100 trials of 10-fold cross-validation. (B) For each model (color), we provide the distribution of R2 values after 100 trials of 10-fold cross-validation. Solid lines indicate average model performance. Probability density functions are estimated using a Gaussian kernel density estimator (bandwidth of 0.25%). The model combining national employment and weighted skill similarity scores significantly outperforms baseline models. . . . 114
5-3 The density of connections between urban workforces predicts spatial mobility between cities. (A) Example U.S. cities projected on the job network according to their characteristic occupations. The complete job network is provided in grey. The characteristic occupations of each city are colored along with the edges connecting those occupations. In the title of each network, N represents the number of highlighted nodes. (B) Similar to (A), overlap networks are created from the occupations that are characteristic in both cities. (C) Similar to Fig. 5-2(A), job tightness models yield diminishing improvements with the incremen-tal inclusion of additional O*NET skills. The 99% confidence intervals are provided, but are small. (D) Similar to Fig. 5-2(B), we compare each model's ability to predict migration flows between city pairs. Distributions represent R2 values across 100 trials of 10-fold cross-validation (i.e. each distribution represents 1000 R2 values). The size of the overlap (i.e. the
number of shared characteristic occupations) between city pairs yields a significant improve-ment in performance over the baseline gravity model alone, but job tightness model, which incorporates the density of connections between shared characteristic occupations, yields the best performance. Probability density functions are estimated using a Gaussian kernel density estimator (bandwidth of 0.25%). (E) Similar to (D), the gravity model plus the job tightness model yields the best predictor of the number of enplaned passengers between city p airs. . . . 1 16
5-4 The job tightness calculation exposes the occupations and skills that connect cities to the
larger economy. (A) Larger cities tend to have greater average job tightness with other U.S. cities. (B) How differences in employment for specific occupations contribute to the overall difference in average job tightness for Los Angeles, CA and Clarksville, TN. An occupation may be characteristic of Los Angeles and not characteristic of Clarksville (t AEmp.), or vice versa (4 AEmp.), and contribute positively (t ATightness) or negatively (4 ATightness)
to the difference in average job tightness. Employment differences for occupations listed on the left increase ATightness, while occupations on the right decrease the difference. (C) How differences in employment for workers with specific O*NET skills impact ATightness for Los Angeles, CA and Clarksville, TN. . . . 118
6-1 Citation patterns among Computer Science subfields identify areas of artificial intelligence-related research. We examine the rate of citations between Computer Science (CS) subfields based on journal and conference publications from three different decades: (a) the 1960's,
(b) the 1980's, and (c) 2010's through 2017. For each network, nodes (circles) correspond to CS subfields according to the Microsoft Academic Graph data, and node size corresponds to
the number of papers published in each subfield (note: the same paper may belong to multi-ple subfields). The width of links connecting nodes corresponds to the number of references made between papers published in those subfields. After constructing the complete network, we apply topological clustering [164] and report the number of citations made between these clusters using weighted arrows. Networks with labels for each subfield are provided in sec-tion E.2. (d) Annual paper producsec-tion by CS subfield. Subfields related to artificial intelli-gence are colored, as well as data science (black) because of its notable decline in relative paper production. (e) The annual number of references from papers in each CS subfield to papers in the AI subfield, and vice versa (i.e. (subfield - AI)+ (subfield <- AI)). . . . 124
6-2 The referencing strength between artificial intelligence and other sciences is declining. (a) The share of references made by artificial intelligence (AI) papers in each year to papers published in other academic fields. (b) The reference strength (see eq. (6.2)) from Al papers to papers published in other academic fields. (c) The share of references made by each academic field to Al papers in each year. (d) The reference strength from each other academic field to Al papers in each year. All lines are smoothed using a 5-year moving average. In (b) and (d), dashed lines indicate academic fields exhibiting lower reference strength than would be expected under random referencing behavior in 2017. . . . 126
6-3 Artificial intelligence research is increasingly dominated by only a few research institutions and Al-specific conferences. (a) The diversity of the annual distribution of all Al papers (black), Al authors (red), and all citations to Al papers (green) across research institutions according to the Gini coefficient. Example distributions of Al paper production and Al citation share are provided in section E.3. (b) To see if preferential attachment explains citation dynamics, we restrict to Al papers with at least one citation and estimate the linear relationship between each research institution's cumulative citation count from 1950 to the institutions citation count in each year (see eq. (6.3)). The model's slope estimation steadily rises throughout the period of analysis to around 0.70 as the model increasingly captures variance in the citation accumulation of institutions according to Pearson correlation (inset). (c) The PageRank of each publication venue for Al papers using the number of references from Al papers published in each venue to papers published in each other venue. The lines of notable publication venues are highlighted with color. Dashed lines indicate venues whose PageRank has declined during the period of analysis. In all plots, lines are smoothed using a 5-year moving average. More recent citation results may change as recent publications continue to accumulate citations. . . . 129
6-4 Industry is increasingly central to artificial intelligence research, but industry-authored Al papers are referenced less often by other academic fields. (a) The PageRank of each research institution using the number of references from Al papers published by each institution to papers published by each other research institution. The lines of notable research institutions are colored for visualization. Dashed lines indicate academic institutions while solid lines indicate industry. (b) The share of the top 10% most cited AI papers published in each year with academic-only, industry-only, and mixed authorship. (c) Similar to (b), we examine the referencing behavior of Engineering towards Al papers according to the authorship of the Al papers. Analogous plots for each other academic field are provided in section E.4.
(d) Generalizing on (C), the Industry Preference Score (IPS) calculated from each academic
field's referencing behavior towards Al papers (see eq. (6.4)). Solid (dashed) lines indicate fields that reference Al papers with industry-only authorship more (less) than would be expected according to random referencing behavior. In all plots, lines are smoothed using a 5-year m oving average. . . . 132
B-1 (A) The average number of workers per firm grows logarithmically with city size. (B)
Consistent with 1218], we find the number of unique jobs grows logarithmically with city size . . . 13 8
B-2 Characterizing the skill specialization of individual jobs. (A) Skill specialization indicates larger scaling exponents with city size for individual jobs. (B) The distribution of skill specialization across BLS jobs. . . . 140
B-3 Comparing the relationships of O*NET skills to city size, expected job impact, and labor specialization. (A) We plot Pearson correlation of raw skill importance to expected job impact (PE) on the x-axis versus the Pearson correlation of raw skill importance to city skill entropy (PH) on the y-axis. We see that which indicate job impact from automation also indicate decreased specialization in cities. (B) We plot Pearson correlation of raw skill importance to expected job impact (PE) on the x-axis versus the Pearson correlation of raw skill importance to city size (Plog(N)) on the y-axis. We see that which indicate job impact from automation also indicate smaller city sizes. (C) We plot Pearson correlation of raw skill importance to city skill entropy (PH) on the x-axis versus the Pearson correlation of raw skill importance to city size (log(N)) on the y-axis. The correlation between these two variables is not significant . . . 140
B-4 (A) The expected number of displaced workers grows slightly sublinearly ( = 0.978) with city size. (B) Expected job impact is anti-correlated with median income of cities according to U .S. C ensus. . . . 142
B-5 The relationship between city size and expected job impact from automation is robust. (A) For choice of assumed error in the predictions from [98], we perform 500 trials measuring the resulting Pearson correlation between log1o city size and expected job impact from au-tomation after the error has been added to each occupation's probability of computerization (y-axis). (B) After selecting a proportion of occupations (x-axis), we perform 500 trials of
randomly selecting that many occupations to remove while measuring the resulting Pearson
correlation between logo city size and the expected job impact from automation in cities (y-axis). . . . 14 5
B-6 Expected job impact from automation decreases with city size using conservative estimates of job loss. (A) The expected job impact of cities decreases with city size. (B) The number of displaced workers per city grows slightly sublinearly with city size ( = 0.988). . . . 146
B-7 Characterizing the relationship between labor specialization andjob impact from automation
in cities. (A) Resilience to job impact is correlated with the number of unique jobs in cities. (B) Increased labor specialization according to job distributions in cities indicates increased resilience to job impact from automation. . . . 147
B-8 An occupation shift explaining the difference in expected job impact for Boston, MA (E, =
0.54) compared to Las Vegas, NV (Em = 0.68) using equation B.5. Each horizontal bar rep-resents S(Las VegasBoston)() of occupation j. The occupation title is provided next to the cor-responding bar and colored according to its job cluster as identified in Figure 3-4. Red bars represent occupations with higher risk of computerization compared to Boston's expected
job impact. Blue bars represent occupations with lower risk of computerization compared
to Boston's expected job impact. Dark colors represent occupations that effectively increase the difference, while pale colors represent occupations that effectively decrease the differ-ence in expect job impact. Bars in each of the quadrants are vertically ordered according to
I6
(Las Vegas,Boston)(j)|. The inset in the bottom left of the plot summarizes the overall influ-ence of resilient occupations compared to occupations that are at risk of computerization.
. . . .. . . 15 0
B-9 An occupation shift explaining the difference in expected job impact for the 50 largest cities
(E, = 0.60) compared to the 50 smallest cities (Em = 0.65) using equation B.5. Each
hor-izontal bar represents (small CiiesLarge Cities)(j) of occupation j. The occupation title is pro-vided next to the corresponding bar and colored according to its job cluster as identified in Figure 3-5. Red bars represent occupations with higher risk of computerization compared to the expected job impact in large cities. Blue bars represent occupations with lower risk of computerization compared to the expected job impact in large cities. Dark colors represent occupations that effectively increase the difference, while pale colors represent occupations that effectively decrease the difference in expect job impact. Bars in each of the quadrants are vertically ordered according to |S(small CitiesLarge Cities)(j)1. The inset in the bottom left of the plot summarizes the overall influence of resilient occupations compared to occupations that are at risk of computerization. . . . 151
B-10 Schematic for mediation analysis. We consider the city size (i.e. sizem) as the treatment variables, as measure for labor specialization (i.e. Hjob(m), Hskiir(m), or I - Tm) as the
mediator variable, and the expected impact of automation on cities (E.) as the outcome variable. el represents the unobserved causes of labor specialization, while e2 represents the unobserved causes of the impact of automation in cities. . . . 153
B-i1 To confirm the validity of the regression models, we perform 1,000 trials where half of the cities are randomly selected without replacement as training data and the remaining cites are used for validation. We under go this process for the regression model using only generic urban indicators (A) and the regression model using all variables (B). The resulting distributions of variance explained (R2) when the trained models are applied to separate
validation data confirms that the full regression model accounts for an additional 10% of variance on average. . . . 154
B-12 The shape of skills indicating specialization (left) and resilience to expected job displace-ment (right) in cities is maintained when observing raw O*NET skills in place of the aggre-gate skills. The colors in each column indicate the probability of a city having the quality on the y-axis given an observation of a labor skill on the x-axis. We have labelled a few of the raw O*NET skills on the x-axis for reference. . . . 155
B-13 The relationships between O*NET tasks expected job impact from automation, labor
spe-cialization, and the scaling of job types. (A) We bin cities according to their expected job impact from automation (x-axis). For each task (legend), we normalize the importance of that task across bins to a probability P(Em I task) representing how strongly that task
in-dicates each level of job displacement (y-axis). (B) We bin cities according to their skill specialization (x- axis) and sum the importance of each task for each bin. For each task (leg-end), we normalize the importance of that task across bins to a probability P(Hskil(mn) 1 task)
representing how strongly that task indicates each level of specialization (y-axis). (C) By summing the importance of each task to each job type, we assess how strongly a task indi-cates a scaling relationship according to its z score. For a given task, z scores are calculated according to the distribution of importance across job clusters. . . . 157
B-14 The relationships between O*NET tasks expected job impact from automation, labor spe-cialization, and the scaling of job types. (A) We bin cities according to their expected job impact from automation (x-axis). For each task (legend), we normalize the importance of that task across bins to a probability P(E I task) representing how strongly that task in-dicates each level of job displacement (y-axis). (B) We bin cities according to their skill specialization (x- axis) and sum the importance of each task for each bin. For each task (leg-end), we normalize the importance of that task across bins to a probability P(Hskil(n) | task) representing how strongly that task indicates each level of specialization (y-axis). (C) By summing the importance of each task to each job type, we assess how strongly a task indi-cates a scaling relationship according to its z score. For a given task, z scores are calculated according to the distribution of importance across job clusters. . . . 159
B-15 Boot-strapping at various rates of sub-sampling demonstrates the stability of our result that
one job cluster scales at a greater rate than the rest when using five clusters obtained from k-m eans clustering. . . . 192
B-16 Following the work of Leitao et al., we provide slope estimates along with standard errors
for the scaling of each occupation cluster according to unconstrained logarithm model. . . . 194
C-1 Transforming raw O*NET data with RCA. (A) The raw occupation-skill matrix, onet(j, s), (B) the RCA occupation-skill matrix, rca(j,s), and (C) the thresholded RCA job-skill ma-trix, I(j,s), for 2014. Here, I(j,s) = I if and only if rca(j,s) > 1. Occupations (y-axis) are ordered by the sum of threshold RCA skill values, and skills (x-axis) are ordered by the correlation of their thresholded RCA values across occupations to the occupational sums. . 205 C-2 The distribution of aggregate skill importance by summing raw O*NET values of each
oc-cupation. . . . 206 C-3 Projecting occupational skill requirements onto the polarized skill network.labelsep The
skill-skill matrix (A) defining the Skillscape from 2014 data. The projections of the oc-cupations of Chief Executive (C) and Taxi Driver (D) onto the Skillscape based on their effectively used skills (black). . . . 206
C-4 A comparison of raw O*NET data (left column) and the resulting Skilscape matrix (right column) for 2010, 2013, and 2015. The order of occupations and skills is preserved across plots for easy comparison. The polarized skill structure is stable across years. . . . 207
C-5 The Skiliscape network respects skill categorization from experts. For each O*NET skill
category, we measure the distribution of O's for pairs of skills within a category (blue) and compare to the distribution of O's for each edge connecting a skill within the category to a skill outside of the category (red). The complementarity for skills within a category is significantly stronger according the the KS statistic (title) then the complementarity for inter-category pairs of skills. . . . 210
C-6 Complementarity scores for every individual Skill (node in the network). That is, the
Z-score of each node's strength (sum of it's edges, or "complementarity weights" 0). Color represents skill category. . . . 211
C-7 The skill requirements of an occupation indicate the education required. In each panel, we
plot the Skillscape network thresholding edges with 0 > 0.6. Nodes (or skills) are colored according to the Pearson correlation between onet(j,s) and the proportion of workers of each occupation with a given degree (title). . . . 212
C-8 Testing the significance of Skillscape polarization. We perform 100 trials of randomly
shuf-fling Skillscape edge weights (i.e. 0 for modularity, and 1 - 0 for shortest path) and measur-ing the resultmeasur-ing (A) average shortest path length and (B) network modularity. Empirically, the average shortest path is 0.567 and the network modularity is 0.159; both clear outliers given the values resulting from randomization. . . . 213
C-9 Identifying the skill sets of urban workforces. Using 2014 data to construct a matrix relating
skills to cities from the dot product of the (A) city-job matrix with the (B) job-skill matrix to produce a (C) city-skill matrix. Note that (B) is the same matrix as Fig. C-1A only reordered. Logarithmic values are presented in (A) and (C) only for visual appeal. Finally, we project Napa, Detroit, and Boston onto the Skillscape based on their effectively used skills. . . . 214
C-10 Example cities projected onto the Skillscape according to effective use of skills. Blue cities
rely on socio-cognitive skills, while red cities rely on sensory-physical skills. . . . 215
C-12 Out of sample testing of model performance from Table C.3. For each model, 1,000 trials
are run where 75% of the data is randomly selected as training data and the remaining 25% of data is used as validation. The distribution root-mean-square errors for each model is reported. Medians are represented by a red line, while the mean error is represented by the green square. . . . 218
C-13 Out of sample testing of model performance from Table C.4. For each model, 1,000 trials
are run where 75% of the data is randomly selected as training data and the remaining 25% of data is used as validation. The distribution root-mean-square errors for each model is reported. Medians are represented by a red line, while the mean error is represented by the green square. . . . 219
C-14 Out of sample testing of model performance from Table C.5. For each model, 1,000 trials are run where 75% of the data is randomly selected as training data and the remaining 25% of data is used as validation. The distribution root-mean-square errors for each model is reported. Medians are represented by a red line, while the mean error is represented by the green square. . . . 221
C-15 Out of sample testing of model performance from Table C.6. For each model, 1,000 trials
are run where 75% of the data is randomly selected as training data and the remaining 25% of data is used as validation. The distribution root-mean-square errors for each model is reported. Medians are represented by a red line, while the mean error is represented by the green square. . . . 223
C-16 A cartoon example of AUROC calculation. . . . 224 C-17 Worker mobility and occupation redefinition are constrained by skill complementarity and
polarization. Each point is the average AUROC for each predictor, using a wide variety of starting RCA threshold values shown on the x-Axis, and standard error bars are provided.
(A) Skillscape complementarity proximity (blue) better predicts the future (2015) skill
re-quirements of an worker's occupation from their old (2014) occupation rere-quirements, com-pared to O*NET data (green), and RCA (red). (B) Similar to (A), the effectively used skills comprising each occupation in 2015 compared to 2010 are best predicted by Skillscape proxim ity. . . . 225
C-18 Predicting changes in cognitive skill fraction of individual workers binning transitions by the
magnitude of change. (A) The distribution of changes in cognitive skill fraction (denoted
Acognitivej) associated with occupation transitions of individual workers from the CPS data.
(B)-(G) The performance of onet, rca, and Skillscape proximity for predicting changes in
effectively used skills after binning CPS occupation transitions into six quantiles (N = 900 transitions per bin) according to the change in cognitive skill fraction. . . . . 227
C-19 Predicting changes in cognitive skill fraction of individual workers binning transitions by
their starting cognitive skill fraction. (A) The distribution of starting cognitive skill fraction associated with occupation transitions of individual workers from the CPS data. (B)-(G) The performance of onet, rca, and Skillscape proximity for predicting changes in effectively used skills after binning CPS occupation transitions into six quantiles (N = 900 transitions per bin) according to the cognitive skill fraction for the worker's original occupation. . . . . 228
C-20 Predicting changes to the cognitive skill fraction of occupations. (A) The distribution of
starting cognitive skill fraction associated with each occupation in 2014. (B) The average change (red) and average magnitude of change (black) in cognitive skill fraction for oc-cupations from 2014 to 2015 for each quantile of ococ-cupations according to cognitive; in 2014 (N = 100 occupations per bin). (C)-(H) The performance of onet, rca, and Skillscape proximity for predicting changes in effectively used skills after binning occupations into six quantiles according to the cognitive skill fraction of the occupation in 2014. . . . 229
C-21 Predicting the effectively used skills of cities over time. (A) Predicting the effectively used
skills of urban workforces in 2015 from the effectively used skills of urban workforces in
2010. (B) The distribution of changes in rca(c, s) comparing 2010 to 2015. . . . 230
C-22 Workers exhibit greater career mobility when leveraging exclusively socio-cognitive or
sensory-physical skills. Binning individual worker occupation transitions into evenly spaced bins according to starting cognitive, we provide the (A) expected change in cognitive skill frac-tion and (B) the expected magnitude of change in cognitive skill fracfrac-tion resulting from the occupation change. For both (A) & (B), standard error bars are plotted, but are negligible.
C-23 The effects of randomly selecting "cognitive skills" as a null model alternative to Louvain
community detection. For 1,000 trials, we randomly select skills to be considered as cog-nitive skills (denoted C*) and calculate the updated cogntive skill fraction, cognitive), for each occupation. (A) The cognitive* of one randomization (red) is provided for comparison to the empirical distribution of cognitive1 (blue). For each cognitive skill randomization, we
calculate the (B) expected change in cognitivej and (C) the expected change in |cognitive| using C* for the cognitive skill fraction of just new occupations (green) and for both new and old occupations (grey) from CPS data, and compare to the empirical results (purple). . . 232
C-24 The distribution of national employment, and of individual occupations as an inset, after binning by cognitivej in (A) 2010, (B) 2011, (C) 2012, (D) 2013, (E) 2014, and (F) 2015. . 233
C-25 The distribution of national employment in 2015, and of individual occupations as an inset,
after binning by cognitivcej while varying the number of bins between (A) 10, (B) 15, (C) 20, (D) 25, (E) 30, and (F) 35 bins. . . . 234
C-26 Binning employment according to cognitive skill fraction reveals a trimodal distribution
across cities of all sizes. (A) The distribution of total employment in cites (i.e. metropolitan statistical areas). The distribution of city-level employment binned by cognitivej after di-viding cities into quartiles according to total employment in the city: (B) total employment between 7,000 and 45,000, (C) total employment between 45,000 and 84,000, (D) total em-ployment between 84,000 and 2,000,000, and (E) total emem-ployment between 2,000,000 and
C-27 Skill proximity predicts skill acquisition for individual workers transitioning between
occu-pations, for the skill requirements of occuoccu-pations, and for labor markets of cities. Bar plot figure including 95% confidence intervals. (A) Example demonstrating Skillscape
proxim-ity (proximproxim-ity(j, s)) as a means to asses the strength of connection between effectively used
skills and other skills. Our model suggests that skill s will be an occupation j if has high proximity to the occupation's effectively used skills. (B) Skills with high proximity to the effectively used skills of an occupation in 2010 are more likely to be effectively used by that occupation in 2015. (C) Skills with high proximity to the effectively used skill of an urban labor market in 2010 are more likely to be effectively used by that work force in 2015. (D) The effectively used skills of a workers occupation in 2014 are more likely to be effectively
used by the workers next occupation in 2015. . . . 236
D-l (A) The matrix of O*NET skill values. (B) The matrix of characteristic skills of each
occupation after normalizing according to revealed comparative advantage. Here, we use
I(j,s) = 1 if rcajs > I and I(j,s) = 0 otherwise as an indicator function for characteristic
sk ills. . . . 2 37
D-2 (A) The skill similarity similarity matrix calculated from Jaccard similarity scores. This
matrix is equivalent to the job network discussed in the main text. (B) The distribution of skill sim ilarity scores. . . . 238
D-3 The distribution of network modularity scores resulting from 100 test netwdrks each
con-structed by randomly permuting skill similarity scores. The empirically observed job net-work modularity score of 0.19 is significantly greater than the randomized netnet-work scores.
. . . .. . . 2 3 8 D-4 The probability distributions of the number of enplaned passengers and the number of
mi-grants flowing between city pairs. . . . 243
D-5 Explaining the difference in the average job tightness of Denver, CO and Napa, CA. (A)
Oc-cupation's contribution to ATightness is quantified by the bar size. Colors specify how the difference in employment contributes to the difference in average job tightness. (B) Quanti-fying how differences in employment for different O*NET skills contribute to ATightness.
D-6 Explaining the difference in the average job tightness of New York, NY and Hinesville, GA. (A) Occupation's contribution to ATightness is quantified by the bar size. Colors specify
how the difference in employment contributes to the difference in average job tightness. (B) Quantifying how differences in employment for different O*NET skills contribute to
A Tightness. . . . 249
D-7 Explaining the difference in the average job tightness of Boston, MA and Detroit, MI. (A)
Occupation's contribution to ATightness is quantified by the bar size. Colors specify how the difference in employment contributes to the difference in average job tightness. (B) Quanti-fying how differences in employment for different O*NET skills contribute to ATightness.
... 249
E-1 Annual paper produce by top-level field of study. In the legend, fields of study are ordered according to their share of overall paper production in the final year of analysis. . . . 251
E-2 Annual paper production by subfield of Computer Science. . . . 252 E-3 Annual artificial intelligence paper production. . . . 252
E-4 Citation network for Computer Science (CS) subfields constructed from papers published in the 1950 's. . . . 254 E-5 Citation network for Computer Science (CS) subfields constructed from papers published in
the 1960's. . . . 254
E-6 Citation network for Computer Science (CS) subfields constructed from papers published in
the 1970 's. . . . 255 E-7 Citation network for Computer Science (CS) subfields constructed from papers published in
the 1980 's. . . . 255 E-8 Citation network for Computer Science (CS) subfields constructed from papers published in
the 1990's. ... 256
E-9 Citation network for Computer Science (CS) subfields constructed from papers published in
the 2000's. . . . 256 E-10 Citation network for Computer Science (CS) subfields constructed from papers published in