ComBo: A Visualization Tool for Comparative Genomic Data by
Tamara H. Yu
Submitted to the Department of Electrical Engineering and Computer Science in Partial Fulfillment of the Requirements for the Degrees of
Bachelor of Science in Computer Science and Engineering
and Master of Engineering in Electrical Engineering and Computer Science at the Massachusetts Institute of Technology
August 27, 2004
Copyright 2004 M.I.T.
s9Iz id
n r
AOO1ONHO3. 0O .U.LLSNI S.LLASHOVSSVN The author hereby grants to M.I.T. permission to reproduce and
distribute publicly paper and electronic copies of this thesis and to grant others the right to do so.
A uthor...
Department of Electrical Engineering and Computer Science August 27, 2004 Certified by. /, Certified by... 7 - , Certified by... ... Accepted by... ... /.. . . . . James Galagan
Broad Institute Thesis Supervisor
Jill P. Mesirov -- ,Broad Institute Thesis Supervisor
Christopher Burge 1 ip-sis Supefvisor
Arthur C. Smith Chairman, Department Committee on Graduate Theses
ComBo: A Visualization Tool for Comparative Genomic Data by
Tamara H. Yu
Submitted to the
Department of Electrical Engineering and Computer Science
August 27, 2004
In Partial Fulfillment of the Requirements for the Degree of Bachelor of Science in Computer Science and Engineering
and Master of Engineering in Electrical Engineering and Computer Science
Abstract
Propelled by advances in sequencing technology, the advent of the genomic era brings the challenge of managing and interpreting massive amount of genomic data. A number of single-genome browsers have been developed for data display. However, they are unsuitable for comparative analysis. We present a dynamic and interactive visualization tool called ComBo that allows users to quickly navigate sequences, browse their
similarities in a dot plot format, display sequence annotations in feature maps, and compare annotations in corresponding regions. ComBo allows users to directly control the display. They can compare any two regions in the sequences at any resolution, from an entire chromosome down to the residue level. Users can also retrieve detailed
information on any displayed sequence feature or alignment. ComBo can import data from the Calhoun annotation database or flat files. Developed in Java, ComBo has a flexible infrastructure allowing the easy addition of functionality in the future.
Thesis Supervisor: Christopher Burge
Title: Associate Professor, MIT Department of Biology
Co- ervisor: James Galagan
Title: Compuitional Biologist, Broad
Institute
CO-Supeisor: I nfmeosirov
Contents
Chapter I Introduction ... 6 1.1 Background ... 6 1.2 Existing Browsers ... 7 1 .3 C o m B o ... 1 2 1.4 Thesis Outline ... 13Chapter 2 Argo Browser and Prototype Viewer ... 14
2.1 Argo Genome Browser ... 14
2.2 Prototype Comparative Viewer ... 16
Chapter 3 Design ... 20 3 .1 G o a ls ... 2 0 3.2 Overview ... 21 3.3 Components ... 22 3.4 Interactions ... 23 Chapter 4 Data ... 27 4.1 D ata Objects ... 27 4.2 D ata Sources ... 27
Chapter 5 Im plem entation ... 29
5.1 M odel- View- Controller Paradigm ... 29
5.2 Application ofW C in ComBo ... 30
5.3 The M odel ... 31
5.4 The View ... 34
5.5 The Controller ... 40
5.6 M odel Updates ... 46
Chapter 6 Use Case ... 49
6.1 Load D ata ... 49
62 Comparative Perspective ... 50
6 3 Z o o m ... 5 1
6.5 M ultiple Select... 55
6.6 Interpolation ... 56
6.7 Residue Level... 57
68 Summary and Availability... 58
Chapter 7 Conclusion... 59
Chapter 8 Future Considerations... 61
Acknowledgements ... 62
List of Abbreviations
API - Application Programming Interface BLAST - Basic Local Alignment Search Tool EST - Expressed Sequence Tag
FASTA - FAST-All (a suite of programs for protein and nucleotide comparisons)
FGI - Fungal Genome Initiative
GFF - General Feature Format
GUI - Graphical User Interface
Chapter 1
Introduction
1.1 Background
At the dawn of the 21 st century, a team of international researchers announced the completion of the first draft of the human genome. It was a major leap toward unveiling the secret of life. Indeed, the field of genomics has advanced so rapidly that it is hard to imagine that merely two decades ago researchers were still painstakingly sequencing the genomes of bacteriophages through direct determination. Much effort has gone into perfecting sequencing techniques and automating the process. As a result, researchers were able to catalog the genetic composition of a wide range of bacterial, archaeal, and eukaryotic organisms during a short time period.
Meanwhile, the development of software tools and database infrastructures for storing, managing, visualizing, and analyzing genomic data has strained to keep up. Research centers around the world have raced to set up public databases for genome sequences, proteins, and gene expression experiments. While managing such a large quantity of information is not easy, the real challenge lies in the quest for ways to rapidly analyze this information and make accurate inferences from it.
Researchers have developed a number of algorithms for interpreting genomic data, and have successfully applied them to automate the annotation and analysis of small
genomes. However, these algorithms fall short in delivering high-quality results for more complex genomes. Therefore, we seek novel approaches to leverage human expertise. In particular, we focus on tools that enable researchers to visually interpret data.
Visualization is critical in understanding genomic data: without it, genomes are simply strings of As, Gs, Cs, and Ts. Genome browsers provide an annotated and information-rich view of genomic sequences. Anyone who has seen a FASTA or GFF file can
certainly appreciate the accessibility of the graphic display of sequences and features in popular genome browsers. Some browsers, such as Ensembl [1] and the UCSC Genome
Browser [2], are set up as web servers, allowing users to view the genomes stored in public databases. Users have a great deal of control over the size of the region being displayed (by specifying the zoom level or the coordinates), what features are displayed, and how they are displayed. Clicking on a feature will take the user to a page of available details about that feature. Nevertheless, these web-based browsers share a common weakness: they are static. This severely limits the flexibility and adaptability of the systems. In contrast, browsers such as Apollo [3] and Artemis [4] are desktop applications that serve as both dynamic genome viewers and annotation editors.
Research in recent years has illustrated the power of comparative genomics. Recognizing the potential of this approach, the Broad Institute (Broad), one of the leading contributors to the Human Genome Project, has sequenced the genomes of Mus musculus (mouse),
Pan troglogytes (chimpanzee), and Canisfamiliaris (dog). In addition, it is devoting
resources to a Fungal Genome Initiative [5], a collaboration of the fungal and genomics communities to identify and sequence a high-priority set of fungi. One of the central motivations of the FGI is to provide a wide range of insightful evolutionary comparisons. Currently, the genomes of eight fungi have been sequenced, five have been annotated, and several more are well underway [6]. We can expect that within a year or two, at least two dozens fungal genomes will be available. All these projects will greatly expand the repository of genomic data, providing an unprecedented opportunity to utilize
comparative analysis to further our understanding in genome structures, biological processes, molecular evolution, and many other research areas. Yet, we cannot take advantage of this opportunity without the right tools.
1.2 Existing Browsers
Existing genome browsers are not well suited for comparative studies. None of them is capable of displaying multiple genomes simultaneously. Some explore alternative
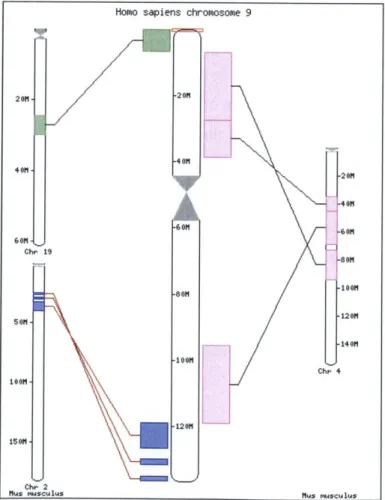
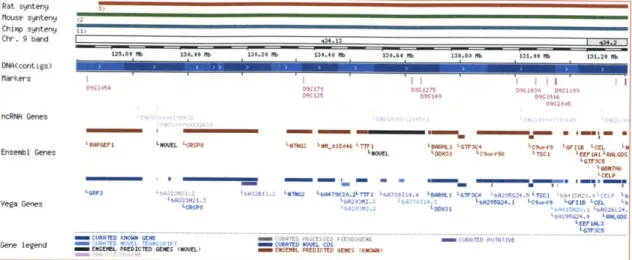
displays for comparative data. Ensembl introduced Syntenyview [7] for displaying synteny maps. A synteny map shows regions in two genomes where related genes are conserved in approximately the same order. Synteny maps are useful in characterizing genome structures, identifying genes in key biological pathways, and studying the process of evolution. Syntenyview displays synteny maps with hyperlinked views. Each view displays one chromosome of a "target" species against all syntenic chromosomes of a "reference" species (Figure 1). Syntenic regions on the chromosomes are color-coded and linked to another view in the Ensembl browser, where they are displayed as features on one of the genomes (Figure 2). Because it is not possible to compare multiple target chromosomes with multiple reference chromosomes in the same view, this approach falls short in delivering a global representation of the synteny.
Homo sapiens ch 201 01 -80M -1001m -120M romosome 9 C Mus m
Figure 1: An EnsembI synteny map for Homo sapiens chromosome 9 versus Mus musculus genome.'
' Courtesy of Ensembl. http://www.ensembl.org/Homo sapiens/syntenyview?chr-9.
20M 40M Chi. I 5011-90 100m- 1501m--20M 401 01 801 1001 1201 14 om h. 4 u.sculus Chr 2 fls wilus
'RAPGEF1 1WJEL '-CRSpe LNThOS 0 NNNGSD4U L T TIl 0
ORHLI LGTW3C4 LC._f LGFIDR LCEL LN
Ensembl Genes LNOVEL 'DE G L Cor498 L TSCr L LEEFIA IRALGDS
L 8N7A6
_________________ CELP
-GF LORM I -GFC S I~
s
GRF2 L tA323421. .2l LNTNG2 'bA479K20.2'rj -5'0735114.4 Lbp20302_ 3 0., 714.3 'RLS GTC LbA29SG24.1 bQ25G24. 'C9_p.o LJ555 LGESIj 433 LCEL Ej3 LL0
Vega Genes ~
555L 0 bU2IL
LCRSpa binM LDD3 .L0326L24.
LbA295G2L4 IRLGDS
LEEFIAL3 - CURRIED KNOWN GENE OR A503 3345( GURRT EC P,250110
Gene legend r 40s T T CURRIED NOVEL l COS
ENSEML PREDICTED GENES (NOVEL) ENSEMBL PREDICTED GENES (KNOWDN)
Figure 2: A syntenic region on Homo sapiens chromosome 9 displayed in the Ensembl browser.2
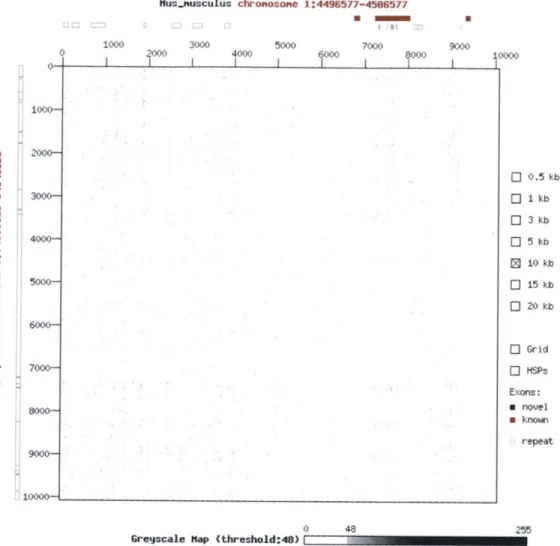
Ensembl is also experimenting with Dotterview, which is "a web interface to the program Dotter" [8] that compares two DNA sequences using a dot matrix (Figure 3). In a dot matrix, the rows and columns represent positions on two sequences. If the residue at position i of the "rows" sequence matches the residue at positionj of the "columns" sequence, the cell at (i ,j) is dotted. Unlike most pages on the Ensembl website, Dotterview's content is generated in real time. However, the view takes a long time to refresh after every command, making it difficult to navigate. Moreover, it offers users little control over the display. Another tool called gff2aplot [9] reads in an alignment file in GFF format and produces a postscript file of a dot plot. A dot plot is similar to a dot matrix, but instead of comparing individual residues, it compares residues within two windows of sequences. If two sequence windows, il -i2 andji -j2, align by certain
criteria (not necessarily base-by-base identity), a line is drawn between (il,ji) and (i2,j2)
to denote the alignment, or similarity. Like gff2aplot, PipMaker [10] computes alignments between two sequences and produces a percent identity plot as a PDF or postscript document.
2 Courtesy of Ensembl.
http://www.ensembl.org/Homo sapiens/contigview?chr-9&vc start= 129695890&vc end=131315687.
Rat synteny Mouse synteny Chimp syntengy Chr. 9 band DNA(contigs) Markers ncRNA Genes .34.13 129.80 Mb 130.40 Rb '130.20 Nb 130.40 lb 130.60 Nb 130.80 Mb 131.oo Nb 131.20 Nb II II III I I II I I D9517- D9S1275 0951230 05119 S125 OHM13 50951910 I9204
Wusjnusculus 1000-20wo 3000 0 20 chronosone 1:4496577-4596577 N 5000 7000 40W0 600 1- I 0 48
Grescale Hap (threshold:48)
Figure 3: Ensembl's Dotterview shows a dot matrix between a Mus musculus sequence region and a Homo
sapiens sequence region.
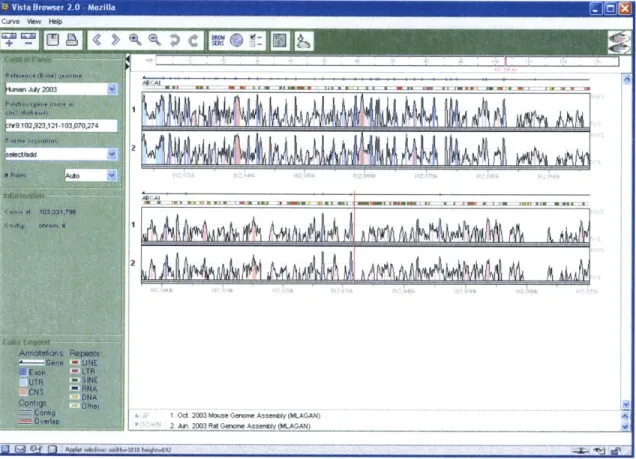
One of the best programs to-date for pair-wise genome comparison is UC Berkeley's VISTA browser [11] (Figure 4). VISTA displays the pre-computed best global alignment between two sequences as a peaks-and-valleys graph, which shows the percent of
conservation between the sequences at any given point of the alignment. Users can browse the entire alignment or specify a section of it for display. Moreover, they can click anywhere in the graph to zoom in on a region. Genes and repeats in the base sequence are also shown above the graph. Conserved non-coding regions, exons, and UTRs are colored in the graph. The same sequence region displayed in the graph can also 3 Courtesy of Ensembl.
http://www.ensembl.org/Mus musculus/dotterview?ref=Mus musculus:1:4501577&hom=Homo sapiens:8
:54643825. 9 10000 cmJ 0 10 0 a W X 3000- 4000-- 7000-0l 0 Ci 0 0 0 0 0.5 kb I kb 3 kb 5 kb 10 kb 15 kb 20 kb 9000-
10000-o
Grid Exons: " novel " known repeat 255be displayed in the UCSC Genome Browser in a separate window. However, since the UCSC browser is a single-genome browser, only the base sequence can be displayed. The main drawback of VISTA is that it cannot display all local alignments when a region in one sequence aligns with multiple regions in another sequence.
C 2ar ow23 2 0 0702p
I ': ( 111-2
.~we ew Hel
Figure 4: Vista Genome Browser.4
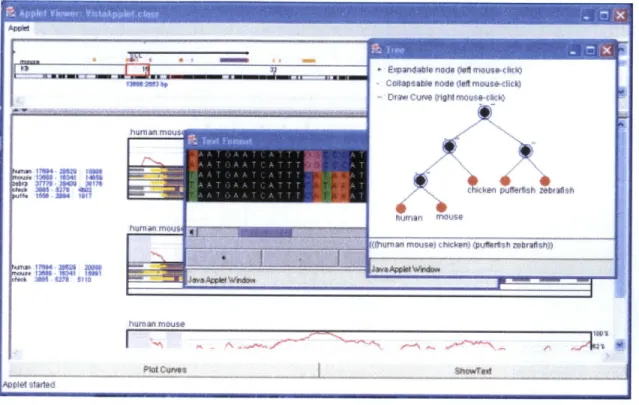
Building upon VISTA's concepts, Phylo-VISTA [12] is a visualization tool developed recently for multiple DNA sequence alignments (Figure 5). Phylo-VISTA takes in a multiple alignment file and a phylogenetic tree. This tree is shown in the top window in Figure 5. Each leaf node in the tree corresponds to a sequence. Each internal node corresponds to a similarity plot of the sub-tree. Similarity plots for selected nodes are visible in the deepest window. Phylo-VISTA also displays the sequences against the multiple alignment so that users can view the gaps and annotations on each sequence. It has many of the same zooming capabilities as VISTA. While Phylo-VISTA lacks many
4 Courtesy of VISTA. http://pipeline.lbl.gov/images/help/vvb2applet.gif.
At
functions that traditional genome browsers have (e.g., rich feature display and annotation editing for individual genomes), the idea of a phylogeny-based multiple alignment view
is novel and its implementation noteworthy.
&sadalenors af jffera i b)
ness eCoflasabie node 4deft mouae-chiek)
hufrhum rnou
hufrian rnmus
Murnvi mrtuse) lrtwkml puttsh mbrat)
Aplel starled
Figure 5: Phylo-VISTA.5
1.3 ComBo
After a survey of many popular open-source applications, it is clear that there is a pressing need for genome browsers with sophisticated functionality that can handle the task of genome comparison in addition to single-genome display and annotation. A comparative genome browser should be able to display multiple genomes and their alignments side by side. It should display the data dynamically, allowing the user to compare arbitrary regions of the genomes in the same view. It should let the user quickly move between levels of detail, from genome-wide panorama down to individual residues.
In addition to showing the alignments, it should also include genome annotations, so that the user can compare residue sequences as well as their features.
To address these requirements, we designed and implemented a comparative browser called ComBo. The conception of ComBo took root in two applications developed at the Broad Institute, the Argo Genome Browser and the Prototype Comparative Viewer, both of which enjoyed a great deal of success in their respective application domains. Built on top of Argo [13], a freely available single-genome browser, ComBo includes all of
Argo's display and editing capabilities for a single sequence. In addition, ComBo adapted the concept of a comparative perspective introduced by the Prototype Comparative
Viewer. The comparative perspective enables the user to dynamically browse alignments between two sequences and compare the sequences' annotation. It uses a dot plot [14] to display alignments to represent the similarities between two sequences. It also contains two features maps; each displays one of two sequences along with its annotated features. The perspective initially gives a high-level view of the entire data space, allowing the user to easily identify data patterns and regions of interest. The user can also zoom in to further inspect any part of the view. The feature maps are synchronized with the dot plot to display the same sequence regions. Finally, an inspector component in the perspective provides additional information about any data selected by the user.
1.4 Thesis Outline
In this thesis, we describe the design and implementation of ComBo. We begin with an overview of ComBo's predecessors, the Argo Browser and the Prototype Comparative Viewer, in Chapter 2. Next, we give a detailed description of ComBo's design in Chapter 3. After a brief discussion on data sources and formats in Chapter 4, we turn our attention to the browser's implementation in Chapter 5. To demonstrate ComBo's features, we go through a use case in Chapter 6. Finally, we summarize the work in Chapter 7 and discuss future directions in Chapter 8.
Chapter 2
Argo Browser and Prototype Viewer
The design of ComBo is influenced by the Argo Genome Browser and the Prototype Comparative Viewer developed at the Broad Institute. Argo provides the foundation of a genome browser with comprehensive single-genome viewing and editing functionality, while the prototype viewer demonstrates the potential of a comparative perspective that includes sequences' annotations and alignments.
2.1 Argo Genome Browser
The Argo Genome Browser (Argo) is a graphical user interface (GUI) program for
viewing and editing sequences and their annotated features. Argo's broad functionality as well as its elegant and extensible implementation makes it an ideal foundation for
ComBo.
FUNCTIONALITY
Argo is the main visualization tool in the Calhoun annotation pipeline system [13]. It displays any sequence region and all features annotated on that region. It provides users the means to dynamically navigate within a sequence region. Whether the user wants to browse the entire sequence, inspect a few residues up close, or look at anything in between, she can. She may also select features, retrieve details about them, and define arbitrary regions of interest. The browser offers many options for customization. It accepts data inputs from Broad's Calhoun database and flat files of various formats.
Argo is also the primary annotation editor used by manual annotators at Broad. It has many sequence editing capabilities and a well-designed interface, allowing annotators to easily insert and update evidence features, revise gene models, and use the browser's feature reports to quickly and accurately interpret data.
ARCHITECTURE
The Argo browser is implemented in Java and has a flexible, modular architecture making it an ideal software environment for the comparative extension. There are three main components in the design: the data model, the data managers, and the user interface. These correspond to three Java packages: calhoun.model, calhoun.db, and calhoun.ui.
The data model is the component in the Argo software bearing the most resemblance to the problem space. It contains abstractions of biologically meaningful objects, such as
Sequence, Feature, etc.
The data managers retrieve data from various sources. In the case where annotations are modified, the data managers are also responsible for proper executions of commit and/or
rollback to ensure data integrity in the database.
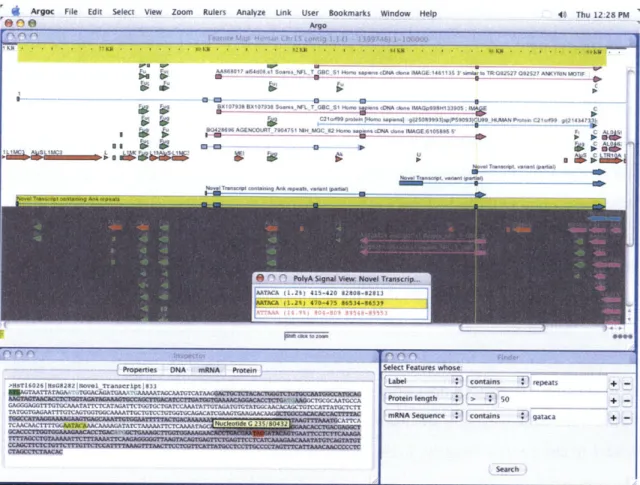
Finally, the user interface is responsible for the visualization and interaction of data objects. The core component of Argo's user interface is the FeatureMap (Figure 6) which is a zoomable, scrollable window that arranges the arrow-shaped Features among other data objects according to their locations on the sequence as marked by a ruler at the top.
Agoc File Edit Select View Zoom Rulers Analyze Link User Bookmarks Window Help
Fl@) --- Ar o 40 Thu 12:28 PM
AA868017 e15408..1 S-4r NFL T GBC SI #A4 sap-eIlcDNA dine IMAGE 1461135 3 -sw.II nI TRG92527 092527 ANKYM N
BX107938 BX107938 Soars NFL T GBC S1 V- Wvns cDNA done IMAGpS9H133905 IC
~ C2Id9S IAI,. 9 12So89993iepS90!93Ct~o89 I ANPIt.. 21.119q g21434?3 80428696 AGENCOT 7904751 NIH MGC32 Hmo . p d)NA.dn MAGE 6105895'
Nov ~ ~ vran ~ pam ~ Tra-sArip ~ ~ ~ - -nnt ipg .4.p1) All,
- -_K L l T ontansinreeat
0 oPalyA Signal View: Novel Transcrp
ATAA( 4 7 0-4-75 86534-8'39
- Properties DNA m ProteiroSelect Features whose:
>HT62bH -28Joe ~ ancnt n83 repeats+
NTAATTATAGAk TVGACAGATGAAw
ATAcmcT-GAGGGAG.GTI-rGT GCAAATATTCTCATAG.ATKGGT CTGAI'CAAATAT TATGTA01A'lT031AGGTGGCAMPA7G UTAGA=TTANGCAACACAGCTGT'CCATTATGCTCTr
C-GIGA,
~ TICAATGAAGAA AMWARNA Seuece T_F 1 5 j
gataca+-Search
Figure 6: Argo Genome Browser displays a feature map.6
ROLE IN COMBO
ComBo reuses Argo's framework and object classes, while adding comparative browsing capabilities. Argo's main component, the feature map, and its subcomponents, are
adapted as building blocks in ComBo. Consequently, more time could be devoted to adding new features. Argo users also get the benefit of a familiar interface.
2.2 Prototype Comparative Viewer
The modification of the Argo browser to handle comparative data is based on a prototype viewer developed in Matlab by computational biologist James Galagan at Broad. The
prototype provides a dot plot view and an alignment view of the two genomes being compared.
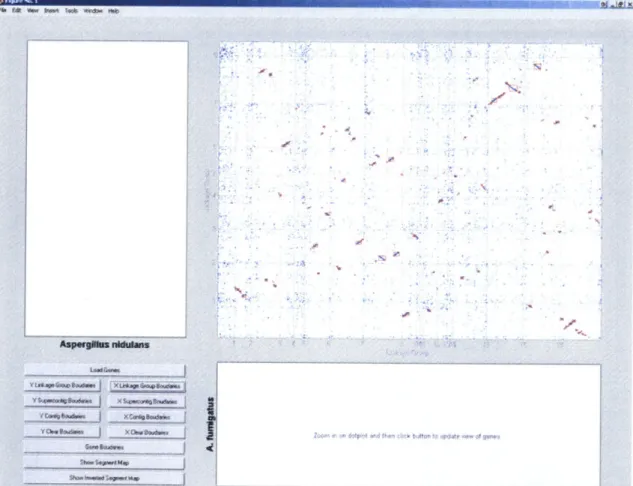
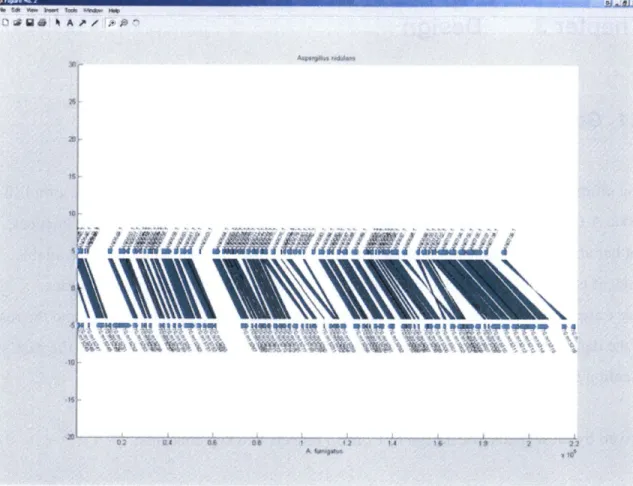
The dot plot view presents the result of the comparison from a global perspective. In Figure 7, the x-coordinate represents the concatenated complete genome of the fungus
Aspergillusfumigatus. The y-coordinate represents the complete genome of the fungus Aspergillus nidulans. The axis lines indicate the chromosome boundaries. The red boxes
in the plot represent regions of conserved synteny, where related genes are conserved in roughly the same order.
Figure 7: Prototype Comparative Viewer's dot plot view of the alignments between Aspergillus nidulans
77
and Aspergillusfumigatus.
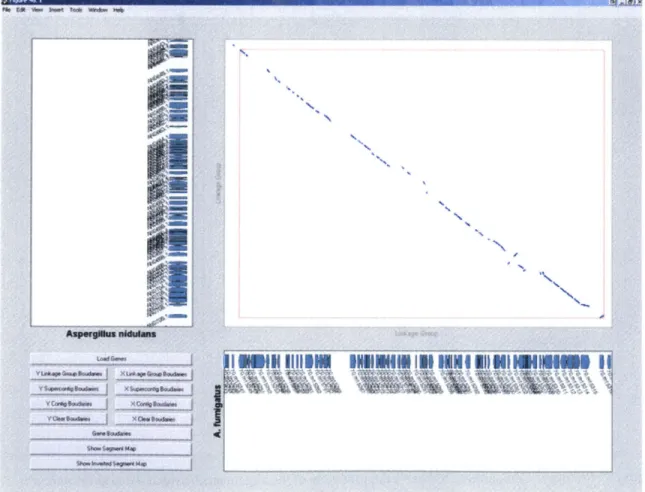
Zooming in on one of these boxes, Figure 8 shows the actual alignments and gaps of the two genomes in this region. The genes in this region are also marked as bars along the axes. The same region is displayed in Figure 9 as an alignment graph, which is useful in visualizing homology on a fine-grained level.
The viewer also showcases some powerful functions such as synchronized browsing between the individual genomes and the comparative graphs. The Prototype viewer is intended to be a prototype tool for research. However, the favorable comments this prototype received made a strong case that these functions should be implemented for a wider audience in the richer context of the Calhoun system.
141 V0s. k- ;.* W'4
-own
AXP4Wg#hU nkkdM* 41 6hW W41D ih-N N NI
Figure 8: A magnified section of the dot plot in Figure 7.
8 Courtesy of James Galagan, Broad Institute.
Q 94 A A z
I
5 iAP' N
S ,4Wq=M N " 4"W dOlW O Rq 54 40NOjqROIq O 11 WI
A ~$ 14 1* huI ~
Figure 9: Prototype Comparative Viewer's alignment graph view of the same region as in Figure 8.9
Chapter 3
Design
3.1 Goals
The ultimate goal for any user interface design is to make it easy for users to accomplish tasks. A ComBo user seeks to discover meaningful correlations between two sequences, but her ability to do so is often hindered by the overwhelming amount of data available. Thus, it is vital that ComBo allows the user to quickly explore the entire data space. There are also times when the user wants to focus on a local region of interest and the rest of the data space becomes distracting. Hence, ComBo's second goal is to draw the user's attention to relevant information based on the context.
Driven by these goals, the design of ComBo reflects two key concepts:
1. Dynamic user interaction emphasizes flexible display of up-to-date data with
convenient user control. Views are generated dynamically rather than chosen from a static set, making them highly customizable through direct manipulation. A straightforward and efficient navigation paradigm further enhances the user's experience with data exploration.
2. Content management is a combination of filtering out the irrelevant information from the view and presenting the relevant information in a logical and intuitive manner. Content management is necessary to prevent the browser from
overwhelming the user with data.
Moreover, for versatility, ComBo has been designed to retain the standard functionality of the Argo genome browser. Users can browse and edit a single genome, look at alignments, and compare genomes and annotations all in one application window.
3.2 Overview
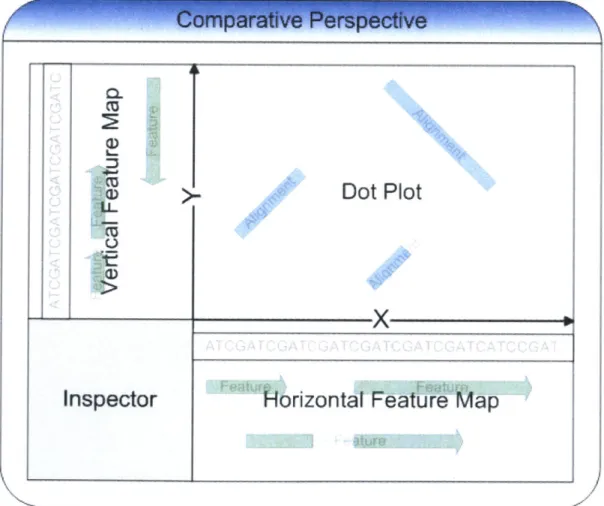
Building on the Argo foundation, ComBo introduces a comparative perspective, which is a visual container for components joined together to assist the user in data comparison. As shown in Figure 10, the comparative perspective is divided into four quadrants,
holding a dot plot, twofeature maps, and an inspector. The horizontal and vertical feature maps display two separate sequences with annotations. The dot plot displays alignments between these two sequences. The inspector displays detailed information about the maps' data contents.
CL
(D
Inspector
Dot Plot
Horizontal
Feature Map
_ _ _ _' I p e .
Figure 10: ComBo's comparative perspective.
/
The borders of these four components join to form the axes of a position-based coordinate system shared between the maps: The coordinates on the X and Y-axes
correspond to positions on the respective sequences, with the origin designated as the
5'-end of each sequence. Map contents, features and alignments, are placed according to their sequence positions.
The user may browse the entire map or zoom into a smaller region to examine it more closely. The feature maps are synchronized with the dot plot to display identical ranges of sequences, allowing the user to focus on a subset of the alignments and compare features around the same location.
3.3 Components
DOT PLOT
The dot plot displays pre-computed alignments, which represent correspondences between the X and Y-sequences at the residue level (Figure 11). Specifically, the projections of each alignment onto the X- and Y-axes bound the matching sequence regions. An alignment is inverted if they are on different strands of the sequences.
Sequence X
Figure 11: In this dot plot, the alignment in the center represents an inverse correspondence between two
sequence features.
The feature map displays a sequence and its features. ComBo uses a modified version of Argo's feature map that has two possible orientations instead of one. The vertical version looks and behaves like its horizontal counterpart, but is rotated 90 degrees
counterclockwise. As mentioned earlier, the dot plot and its adjacent feature map along each axis of the comparative perspective align to share the same coordinates for the same sequence. This allows the user to cross-reference alignments and features at the same location.
INSPECTOR
Like the feature map, the inspector is also a concept inherited from Argo. It displays the properties and details of the currently selected feature, alignment, or a user-defined sequence region.
3.4 Interactions
ComBo's strength as a comparative genome browser lies in the components' ability to interact with the user and among themselves. ComBo refines and builds upon many ideas in Argo's user interface, particularly the navigation paradigm in the feature map. To tie different pieces of data together to help the user discover the biological connection, ComBo utilizes a new technique: synchronization of views and actions among the maps. NAVIGATION
The dot plot and the feature maps are zoomable and scrollable. Only dimensions of a map that correspond to sequences are zoomable. This means a horizontal feature map is
zoomable along the X-axis and a vertical feature map is zoomable along the Y-axis. We will refer to the zoomable dimension of a feature map as the length dimension and the non-zoomable one as the height dimension. On the other hand, a dot plot is both horizontally and vertically zoomable.
ComBo has two basic navigation modes, select and zoom. The comparative perspective uses select-mode by default. A user may click on any feature, alignment, or sequence segment to retrieve additional information about them in the inspector. The user may also Control-select or area-select multiple items. She may switch to zoom-mode temporarily by holding down the Shift key. In zoom-mode, she can left-click to zoom in and right-click to zoom out by a magnification factor. She may also zoom into an arbitrary region
in the view defined by dragging the mouse.
SYNCHRONIZATION
The role of synchronization is to help the user stay on track with relevant data. ComBo synchronizes both zooming and selection to ensure a logical, consistent, and informative comparative perspective.
Synchronous zooming guarantees that neighboring maps make the same sequence range visible. This is achieved by maintaining the following invariant:
1. The views of two adjacent maps must have the same size along the border they share, and must align perfectly;
2. These two views must show the same segment of their corresponding sequence and nothing more; and
3. If the user changes one of the views by zooming or scrolling the map, the adjacent map must automatically adjust to match the user-updated view.
As a result, users can easily cross-reference alignments, potentially related features, and their nucleotide sequences.
ComBo also synchronizes selection highlights. When an alignment is selected, ComBo highlights the ranges it spans in both the horizontal and vertical dimensions. The same regions are also highlighted in the feature maps allowing users to easily identify overlapping features, as illustrated in Figure 12.
4, 1%r.' r WT% s - I %#trVW--& .
CU (DU
tJL
/
Dot Plot
~I~1
I
x
Inspector
Horizontal Feature Map
Figure 12: Selected alignment and its highlights.
Likewise, if a feature or a user-defined sequence segment is selected in a feature map, ComBo highlights the corresponding sequence region in the feature map and the dot plot. Furthermore, if the highlight overlaps with any alignments, the dot plot will interpolate and highlight those regions the selection aligns with in the other feature map. Finally, ComBo updates all highlights whenever the map views change. (Figure 13)
ci.
L.
L
I
Dot Plot
I 1t
'Horizontal
Feature
Map
Inspector
Figure 13: Highlight synchronization by interpolation. The highlights on the X-axis are interpolated from
the highlight for the selected vertical feature.
-- a
Chapter 4
Data
4.1 Data Objects
ComBo is designed to display the relationships between two sequences. The sequences may be DNA, RNA, or protein. The raw sequence data are simply two strings of residues. To begin uncovering potential underlying connections, researchers rely on two classes of evidence: alignments and features.
The first class of evidence is the sequences' pair-wise alignments at the residue level. An alignment is a near-perfect match between two regions on separate sequences. There are many programs available for finding global and local alignments between two sequences. Once the alignments have been computed externally, they can be loaded into ComBo for display. While short gaps are common in alignments, ComBo currently ignores them and simply treats an alignment as a pair of segment locations.
The second class of evidence consists of sequence features. These are specific locations on the sequences annotated as genes, repeats, BLAST alignments, EST alignments, etc. Feature data are computed by external feature finding programs or identified through manual annotation.
4.2 Data Sources
Sequence and feature data are typically loaded together for display. ComBo imports these single-genome data from two main data sources, the Calhoun database and flat files. The Calhoun database is an Oracle relational database at the Broad Institute, which tracks sequences from in-house genome projects as well as external databases. Additionally, it tracks features on these sequences. Both sequences and features have a variety of
object-or type-specific attributes. ComBo is also capable of loading data from flat files in Fasta, Genbank, or GFF format.
ComBo loads alignments separately from sequence and feature data. As there is not yet any standard format for comparative data, ComBo does not import alignments from databases. Moreover, the code for loading alignments from flat files are written as needed for custom data formats. Currently, ComBo accepts data files that describe pair-wise alignments in a simple, generic format, in which each line describes one alignment with twelve tab-delimited fields:
1. Alignment ID, 7. Sequence#2 strand,
2. Sequence#1 start, 8. Sequence#1 contig,
3. Sequence#1 stop, 9. Sequence#2 contig,
4. Sequence#2 start, 10. Percent identity,
5. Sequence#2 stop, 11. Alignment score, and
6. Sequence#1 strand, 12. Expected value.
This format essentially specifies an alignment as a pair of sequence segments with a few additional attributes. It does not include gap information.
Chapter 5
Implementation
The ComBo browser was implemented in Java. Besides being Argo's choice of language, Java has the obvious benefit of platform independence, eliminating a lot of the guesswork about native graphical peculiarities in different systems.
What is more, Argo has grown quickly into a complex system. It is foreseeable that ComBo will similarly take on more features and become an increasingly sophisticated and well-rounded tool. In order to keep the system manageable and extendable, great care must be taken to keep the code modular. Java, being an object-oriented language, is a natural choice for this task.
Keeping a system with so many functionally interdependent components modular and comprehensible is no straightforward task. To cope with complexity, the implementation of ComBo loosely follows the Model-View-Controller paradigm [15] pioneered by Java's predecessor, SmallTalk-80.
5.1 Model-View-Controller Paradigm
In the early 1980s, a programming language called SmallTalk-80 introduced the Model-View-Controller (MVC) paradigm, a powerful user interface design pattern. In the MVC paradigm, the modeling of the problem space, the user input, and the graphical output are explicitly separated and handled by three parts of the program, each specialized for its task. The model manages the behavior and data of the application domain. The view produces the graphical output for the model on screen. Finally, the controller interprets the mouse and keyboard inputs from the user and commands the model and/or the view to update accordingly.
The aim of MVC is to separate concerns and promote code reuse. MVC allows one to develop the software's user interface frontend and data-centric backend independently. One implication of this partition is that a single data model can take on several different views. Another is that no matter how the backend implementation changes, as long as it maintains the same interface, the frontend is not affected at all. Moreover, MVC
encourages the separation of input and output. The controller accepts user inputs and updates the model accordingly, while the view generates the output based on the state of the model. Overall, MVC is an effective abstraction that simplifies user interface
development.
5.2 Application of MVC in ComBo
ComBo is structured according to the Model-View-Controller paradigm, as illustrated in Figure 14. ComBo imports and models genomic data objects using the Java packages
calhoun.api, calhoun.db, and calhoun.model, graphically presents them in an application window using calhoun.ui, and orchestrates their actions and interactions using
calhoun.action and calhoun.event.
Controller View
input calhoun.action calhoun event I paeoutput
ca houn ul
Model
calhoun.modol calhoun.db calhoun.sp)
There are many advantages of structuring ComBo this way. First, since the code for accessing data (calhoun.db) is separate from the data model interface (calhoun.model), ComBo can take in data of any format from any source given a data manager to translate the data into the representation defined in the data model interface. The calhoun.api package provides templates for writing custom data managers. Second, the MVC pattern makes it possible to associate multiple views with the same data. This allows powerful features, such as toggling between views, to be added to ComBo in the future.
5.3 The Model
DATA TYPES
The model of ComBo is responsible for supplying data to the frontend. The first step is to let the frontend know what kinds of data to expect. The calhoun.model package defines the following data types:
A Sequence is a Java object that models a genomic sequence. Sequence has a number of attributes, including a unique ID, a name, a source, and a raw sequence, which is the
string of residues it represents.
A segment models a segment of a sequence. Its attributes include the sequence the segment is on, the starting and stopping positions on the sequence, and the strand if applicable.
A Feature represents an annotated feature on a sequence. It is a special kind of Segment bearing some biological significance. Besides those inherited from segment, Feature has additional type-specific attributes, such as the product of a gene.
An Alignment object is a simple model for a pair-wise alignment. It disregards gap
information; instead, it represents the alignment as a pair of Segment objects indicating which parts of the sequences share the similarity. In the future, gaps will likely be addressed in a nested-Alignments fashion that resembles the nested-Features approach for handling introns in a feature map and is compatible with the existing framework.
DATA MANAGERS
Data managers are modules that import and translate raw data into data objects
recognizable by ComBo. The calhoun.api package specifies the programming interface for data managers. The calhoun.db package contains functional implementations. Figure 15 illustrates the core Java classes and interfaces for data managers.
There are three main types of DataManagers: SequenceManager for sequences, TrackManager for features, and AlignmentManager for alignments. Three abstract classes,
AbstractSequenceManager, AbstractTrackManager, and AbstractAlignmentManager, serve as starting points for any concrete data manager implementation. They can be further sub-classed based on data sources. AbstractSingleFiledAlignmentManager and
AbstractSingleFiledTrackManager can be extended to create data managers that import data from flat files.
For ComBo, we were able to reuse various single-genome data managers written for Argo, such as the BroadSequenceManager for importing sequence data from the Calhoun database and the GenbankDatabaseDataManager for importing Genbank data (sequences and features). For the generic file-based test alignment data format described in Chapter 4, we created a TestAlignmentManager by extending the AbstractSingleFiledAlignmentManager
template in the API. It parses a flat file and produces a set of Alignment data objects as defined in calhoun.model.
Finally, the DataManagerRegistry helps the application track data managers available. When the user makes a data loading request, ComBo delegates the task to the appropriate data
manager, which reads data from the source, creates data objects such as sequences and Features, and passes them to the view for display.
calhoun.db SequenceMan gerRegistry TrackManager Registry Ge~nbankData-baseDataManl ager BroadSequen ceManager TestA49nment maager calhoun.api Identiable DataManager
AllgnmentMan SequenceMan TrackManager
-Absrect4Jgl AbstractSequ Abstract Track ractC
mentaneger enceManager Manager ager
Absbc*Wnge- S-Aestsi515
FeiAugnmen FiledTrackMa
tManager nager
Symbols:
Java objects Java
Java relations, extends
Abstract Java Class
implements
Java Class
Figure 15: Data Manager API. Colored objects represent the classes relevant to the implementation of the data manager for the alignment data described in Chapter 4.
Filel-oader
AfignmentFile TrackFilet-oad
Loader er
5.4 The
View
The view of ComBo is primarily responsible for displaying data from the model. Together with the controller, it gives users the means to directly manipulate the appearance as well as the actual data. ComBo organizes data into maps and maps into perspectives.
COMPARATIVE PERSPECTIVE
At the top of the UI hierarchy for ComBo's comparative perspective is the Java object
ComparativePerspective, which is a JlnternalFrame containing exactly four components: (1)
a DotPlotWindow, (2) a vertical FeatureMapWindow, (3) a horizontal FeatureMapWindow, and
(4) an InspectorWindow. The first three components are all maps. The ComparativePerspective
manages the layout of the components relative to one another and sets them up for the controller. However, the responsibility of data display lies entirely on the maps, which
Map Object Diagram
Map View
Schema Implementation
p --- ScrolfableMap viewport MapPanel
viewport
DotPlotWindow FeatureMapWindow FeatureMapPanel DotPlotPanel
-vewport- i"
Heaontans Glyph ontains
raw header i
column header contains
RulerPanel SegmentGlyph AlignmentGlyph
SequenceRulerPanel PositionRulerPanel FeatureGlyph ColumnGlyph HighlightGlyph
Symbols:
Java objects Javc Java cas Java Class
Java relations: extends implements (simple)
Figure 16: Object diagram of the main Java objects pertaining to a map.
MAP HIERARCHY
The different map-related objects in ComBo are related according to the hierarchy shown in Figure 16. The map schema is specified in the interface Map and partially implemented
in the abstract class ScrollableMap, which becomes the basis for feature map and dot plot's implementations.
The Map interface in the hierarchy embodies the concept of a map, which is a
representation of data locations. Analogous to a Global Positioning System that uses the globe's longitude and latitude as its coordinate system for locating a subject, Map uses positions on one or more sequences as the coordinate system for locating a piece of data, such as a feature or an alignment.
A ScrollableMap is an implementation of Map. It uses a JScrollPane to display the map object as shown in Figure 17. It has a fixed-sized viewport, which serves as a window to the view in the back. The view is a 2D rendering of the map (later referred to as the MapPanel). Since the view can have any size, zooming can be achieved by stretching or shrinking the map along its zoomable dimensions. To zoom in, for instance, the view's size increases, so that the map is drawn bigger. Since the viewport stays the same, the user sees what used to be only part of the viewport now occupying the entire viewable space. When the map's size is bigger than the viewport's size, the user can scroll the map horizontally and vertically to bring different parts of the map into the viewable area.
4. 7 . a
vew\r
ComBo has two uses for the ScrollableMap: the FeatureMapWindow for displaying features and the DotPlotWindow for displaying alignments. Besides avoiding duplicate code between FeatureMapWindow and DotPlotWindow, the map hierarchy allows the same navigation
mechanism to be reused in the future in other views, such as an alignment graph (Figure
9), by simply extending from ScrollableMap.
VIEW HIERARCHY
The view of a ScrollableMap is a MapPanel, which is a JPanel-type container for glyphs, or graphical objects, that represent, group, and highlight the data. Like ScrollableMap,
MapPanel is an abstract class. It has two concrete subclasses, FeatureMapPanel and DotPlotPanel, which serve as views for FeatureMapWindow and DotPlotWindow respectively.
MapPanel has two main functions: keeping track of glyphs and managing their layout. Recall that the locations of data such as features and alignments are in terms of sequence positions. To determine where a glyph should be drawn, A MapPanel must translate their sequence positions to Java's component coordinates and retranslated whenever the view is resized.
If two or more features share the same sequence position in a FeatureMapPanel, their glyphs are stacked up, or put in separate rows, along the height dimension. The stacking
order is customizable. On the other hand, stacking is not an option in a DotPlotPanel since there is not a non-sequence dimension. Therefore, some overlapping AlignmentGlyphs are unavoidably obscured, at least partially.
MAP HEADERS
Displaying data in a FeatureMapPanel illustrates their locations relative to one another, yet a map is incomplete without a ruler indicating their absolute locations on the sequence(s). FeatureMapWindow displays rulers through the viewport of the column (north) or row (east)
header of the JScrollPane. Figure 18 shows two FeatureMapWindows. The vertical feature map holds rulers in the row header, whereas its horizontal counterpart holds them in the column header.
The "Header" section in Figure 16 outlines the ruler hierarchy in ComBo. A RulerPanel is the graphical representation of a ruler. Two commonly used RulerPanels are the
PositionRulerPanel and the SequenceRulerPanel. The PositionRulerPanel marks the sequence
positions and is always visible. The SequenceRulerPane displays the residue at each
position. If the segment of the sequence viewable through the viewport is too long for the residue letters to be legible, the panel is left blank.
MAP CONTENTS
MapPanel uses glyphs to represent, group, and highlight data. The categorization of glyphs
parallels their models: AlignmentGlyph corresponds to Alignment; SegmentGlyph corresponds
to Segment. SegmentGlyph can be divided into three sub-categories: FeatureGlyph,
ColumnGlyph and HighlightGlyph. Figure 16 diagrams the relationship between these classes.
Figure 18 and Figure 19 illustrate the glyphs taken from screenshots.
PositionRulerPanel SequenceRuterPanel
L
I
_ HighlightGlyphFeatureGlyph
ColumnGlyph
vertical feature map horizontal feature map
HighlightGlyph
FeatureGlyph
Figure 19: Components in a dot plot.
A FeatureGlyph represents a Feature, and is drawn as an arrow to indicate the feature's
strand orientation. The user may also indicate an arbitrary segment on a sequence by creating a ColumnGlyph. A ColumnGlyph is drawn as a semi-transparent rectangle covering the entire section of the feature map bounded by the endpoints of the segment. A
ColumnGlyph remains in the FeatureMapPanel until the user explicitly deletes it or the FeatureMapPanel is disposed. However, unlike a feature, the segment it represents is not stored as permanent data. Neither FeatureGlyph nor ColumnGlyph is used in DotPlotPanel.
AlignmentGlyph, FeatureGlyph, and ColumnGlyph are selectable. Their selection is reflected in the Inspector, which displays various properties of the underlying alignment, feature, or column. The selection is also highlighted by HighlightGlyphs. HighlightGlyph is similar to ColumnGlyph, except it is not created by the user, and it is transient, meaning that it will be destroyed as soon its corresponding selection is deselected. There are three types of HighlightGlyphs: direct, neighboring, and interpolated. They are categorized by the contexts for which they are created. They play a central role in synchronization, which will be discussed in more detail later.
5.5 The Controller
The controller of ComBo handles all interactions with the user. There are two parts to the controller logic. The first involves direct manipulation of objects by the user, such as opening a new feature map or selecting a glyph. This is handled by actions and input listeners. The second involves the interactions between objects as the byproducts of direct manipulation. The theme of the interactions is synchronization, which is achieved by the resize listener and the view synchronizer.
ACTIONS
An Action is a Java object that represents a command. It is commonly used in
conjunction with a menu item. When the menu item is selected, the associated action is performed. For example, the action for the menu item "Refresh Map Data" is to reload the data from its source and regenerate the map. The calhoun.action package contains many such Actions.
Actions are neatly packaged controller logics that help make the code modular, easy to understand, and reusable. Unfortunately, not all controller logics can be wrapped up as Actions: mouse events make a prime example. Actions work well with standard GUI objects such as menus and toolbars, but another type of controller is necessary to handle more free-form interactions.
INPUT LISTENERS
Each map has a set of listeners that handles events from input devices, such as mouse clicks, characters typed, etc. FeatureMapKeyListener and DotPlotKeyListener listen for KeyEvents, while FeatureMapMouseListener and DotPlotMouseListener listen for
The main function of the key listeners is to set the mode. There are two modes in ComBo: select and zoom. ComBo responds to mouse inputs differently depending on what the current mode is. The default mode is select. When the user holds the Shift key down, the mode is temporarily shifted to zoom.
The mouse listeners react to a mouse event based on the current mode and the type of object clicked on. The following table summarizes mouse listeners' behaviors:
Mode E-ei-t Coipoient Crl Bitton Effect
MouseClicked FeatureGlyph, ColumnGlyph, AlignmentGlyph HighlightGlyph, none No Yes Left Left I ILeft I
Select component if it is not previously selected; deselect otherwise. Clear all other selections in all maps.
Select component if it is not previously selected; deselect otherwise.
Clear all selections in all maps.
FeatureGlyph, Left Drag and drop. Effect depends on the drag
ColumnGlyph model4.
Select all components enclosed by the
drag-MouseDragged AlignmentGlyph, No Left rectangle. Clear all other selections in all
HighlightGlyph, maps.
none Select all components enclosed by the
drag-Yrectangle.
MouseMoved
FeatureGlyph, ColumnGlyph,
AlignmentGlyph Display tool-tip.
Shift the map so that the clicked point is the
MouseClicked Left center of the visible area. Zoom in by a
factor (default is 2x).
Right Zoom out by a factor (default is 0.5x).
Zoom MouseDragged Left Zoom into the region enclosed by the
drag-rectangle. FeatureGlyph,
MouseMoved ColumnGlyph, Display tool-tip.
AlignmentGlyph ______
Table 1: Mouse controls in maps.
So far, we have described Actions and input listeners, which give the user the means to control and navigate individual maps. However, to make the most out of the data, these maps need to cooperate in a comparative context. Two additional controller components
0 The drag modes are artifacts of Argo. They are not meaningful in the comparative context, but are
retained in ComBo so that a user can open a standalone feature map and still get all the Argo functionality. Select
are responsible for managing the interactions between maps, the ResizeListener and the ViewSynchronizer. In a nutshell, the ResizeListener controls the layout of the maps in such a way that enables the ViewSynchronizer to easily coordinate zooming and highlighting in the views.
RESIZE LISTENER
The Corn parativePerspective controls the sizes and locations of its four components with a ResizeListener. In order to achieve perfect synchronization, the ResizeListener guarantees the following about the components:
1. Each component is anchored to its respective corner of the perspective, 2. The vertical FeatureMapWindow and the DotPlotWindow are equal in height, 3. The horizontal FeatureMapWindow and the DotPlotWindow are equal in width, 4. Neighboring maps abut without overlap, and
5. The InspectorWindow takes up the remaining space.
The result is a four-quadrant setup with the joint borders forming the X- and Y-axes. The ResizeListener allows the user to redistribute the space by dragging the origin or one of the axes. Figure 20 illustrates the layout properties guaranteed and the resizing operations supported by the ResizeListener.
Vertical Feature Map Dot Plot (Quadrant 2) (Quadrant 1)
Inspector Horizontal Feature Map (Quadrant 3) (Quadrant 4)
ResizeListener utilizes an event listener pattern to supervise the layout and provide immediate visual feedbacks to the user's resizing gestures. Specifically, the ComparativePerspective instantiates a ResizeListener that listens for MouseEvents and MouseMotionEvents in all four components. When the user clicks on one of these components near the axes and drags it, the ResizeListener causes the component to resize following the mouse movement and simultaneously adjusts the other three components. Contents are shown during resizing activities as they provide immediate feedback to the user in determining where to place the boundaries.
VIEW SYNCHRONIZER
A ViewSynchronizer is an object that relays updates from a source map to a target map. The source and the target share a border, which is either horizontal (X) or vertical (Y). The ComparativePerspective contains four ViewSynchronizers:
Hoina Fpnt-d
Horizontal FeatureMapWindow DotPlotWindow X
Vertical FeatureMapWindow DotPlotWindow Y
DotPlotWindow Horizontal FeatureMapWindow X
DotPlotWindow Vertical FeatureMapWindow Y
Table 2: Four instances of ViewSynchronizer in ComparativePerspective.
The ViewSynchronizer listens for both zoom and select changes in the source by implementing the ChangeListener and ContainerListener interfaces.
Zoom-Synchronization
The ViewSynchronizer is a ChangeListener registered with the source's viewport. When the MapPanel in the viewport resizes or changes its position, it fires a ChangeEvent. Zoom-related operations on a map, including zoom-in, zoom-out, and scroll, can all be captured as ChangeEvents. Thanks to ResizeListener's guarantees about map sizes and positions, zoom synchronization is straightforward: when the ViewSynchronizer receives a
ChangeEvent from the source, it sets the view of the target to the same size and the same position as the source along the shared border. (See an example in Figure 21.) This method is simple yet robust. We can count on the listener catching every zoom change in the source and making the appropriate update in the target regardless of what causes the zoom operation.
(z1. y2) Shared (x2, y2)
A 7borderN A
(Z1, y1) (xI1 y1)
ChangeEvent
Target Source M M
(zoom in)
-b2
Figure 21: A ViewSynchronizer propagates a zoom change (magnification) from its source to its target in the vertical dimension.
The ViewSynchronizer is also a ContainerListener registered with the source's view. It receives a ContainerEvent when a component is added to or removed from the view. If this component is a HighlightGlyph, then the viewSynchronizer must update the highlights in the target's view. However, before diving into the details of select-synchronization, it is necessary to first clarify the different types of HighlightGlyphs and how they relate to data glyphs as well as to each other.
Highlight Glyphs
Unlike most glyphs in ComBo, which are created to represent data objects,
HighlightGlyphs' primary function is to provide visual cues to related data regions across multiple maps. They are central to synchronization because they best emphasize the logical relations among the maps.
Recall that there are three types of HighlightGlyphs corresponding to the three ways
HighlightGlyphs are used: highlighting a selected data glyph, mirroring a HighlightGlyph in an
adjacent map, and interpolating the intersection of an AlignmentGlyph and another
HighlightGlyph. Each of these uses is illustrated in Figure 22 and is described separately
below.
Feature Map
Neighboring highlight Dighf
HighlightGlyph Hlgh ghtG yph
Direct mirror
HighlightG yph Dot Plot
highlight
mi-r-or HighlightGlyph
interpolate
Interpolated
HighlightGlyph
Figure 22: The relationship among highlight glyphs and data glyphs.
First, when the user selects a FeatureGlyph, a ColumnGlyph, or an AlignmentGlyph, ComBo creates a direct HighlightGlyph to highlight each sequence segment the selected data glyph corresponds to. (The highlights in the dot plot of Figure 12 are two examples of direct HighlightGlyphs.) A direct HighlightGlyph is created in the same map as the selected data
Secondly, a neighboring HighlightGlyph is created to mirror a non-neighboring HighlightGlyph
in an adjacent map and any of its subsequent changes. For example, when the vertical
FeatureMapWindow creates a direct HighlightGlyph, the DotPlotWindow in turn creates a
neighboring HighlightGlyph that highlights the same Y range (Figure 13).
Thirdly, when the neighboring HighlightGlyph that mirrors a direct HighlightGlyph in feature map A intersects with an AlignmentGlyph, we interpolate the segment on sequence B that would align with the highlighted segment on sequence A, and create an interpolated HighlightGlyph for it. (Both vertical highlights in the dot plot of Figure 13 are interpolated
HighlightGlyphs.)
Select-Synchronization
All HighlightGlyphs are either directly or indirectly created or destroyed by the selection
mechanism of MapPanel, or map. Since the map alone can set a data glyph as selected or unselected, only the map determines when to create or delete a direct HighlightGlyph. On the other hand, one map does not know about direct HighlightGlyphs that other maps have created. It needs the ViewSynchronizer to act as an agent. Only the ViewSynchronizer can instruct the map to create or delete a neighboring or interpolated HighlightGlyph.
When a ViewSynchronizer receives a ContainerEvent about the addition of a direct or interpolated HighlightGlyph to the source, it instructs the target to create a neighboring HighlightGlyph. If the target is a DotPlotMapPanel, it also asks the target to create interpolated
HighlightGlyphs if there are any. On the other hand, when the ViewSynchronizer is notified of
the removal of a HighlightGlyph from the source, it makes sure that all dependent
HighlightGlyphs in the target get removed.
5.6 Model Updates
ComBo makes extensive use of the event listener pattern to communicate changes among components. A component, the listener, registers interest in changes of another
component, the source. When the source changes, it sends an event notification to all of its listeners. This pattern is particularly common in the controller. The input listeners and the ResizeListener use it to capture mouse and keyboard events in the maps. The
ViewSynchronizer listens for changes in the contents of containers and in the bounds of components. These GUI components manage to never miss an update by taking full advantage of Java's event supports in AWT and Swing.
OBSERVER PATTERN
The need for timely update notifications, however, is not limited to the GUI components of ComBo. Data models also need a way of informing their views about their changes immediately to make sure that the views never display stale data and that users receive immediate feedbacks for the changes or commands they make.
ComBo allows any objects to utilize the event listener pattern by providing two interfaces in the calhoun.util package, Observer and Observable. By implementing the Observable
interface, an object can notify its observers about changes or even just send them a generic announcement. Any object can receive messages from the Observable object by implementing the Observer interface and registering itself with the Observable.
The Observer pattern is powerful, but must not be overused. In a situation that requires event notification, one should always consider Java's event listener implementation first. While the Observer pattern can also do the job, it often requires meticulous coding-one has to take great care to make sure that the notifyObservers() method is called in all possible update scenarios. This becomes highly error-prone when the component's behavior is complex, with a large number of potential scenarios. Therefore, the use of the Observer pattern must be kept in check.