HAL Id: hal-00714018
https://hal-brgm.archives-ouvertes.fr/hal-00714018
Submitted on 3 Jul 2012HAL is a multi-disciplinary open access archive for the deposit and dissemination of sci-entific research documents, whether they are pub-lished or not. The documents may come from teaching and research institutions in France or abroad, or from public or private research centers.
L’archive ouverte pluridisciplinaire HAL, est destinée au dépôt et à la diffusion de documents scientifiques de niveau recherche, publiés ou non, émanant des établissements d’enseignement et de recherche français ou étrangers, des laboratoires publics ou privés.
Strong-motion records selection for structural testing
John Douglas
To cite this version:
John Douglas. Strong-motion records selection for structural testing. First European Conference on Earthquake Engineering and Seismology (a joint event of the 13th ECEE & 30th General Assembly of the ESC), Sep 2006, Geneve, Switzerland. Paper Number: 5. �hal-00714018�
First European Conference on Earthquake Engineering and Seismology (a joint event of the 13th ECEE & 30th General Assembly of the ESC)
Geneva, Switzerland, 3-8 September 2006 Paper Number: 5
STRONG-MOTION RECORDS SELECTION FOR STRUCTURAL TESTING
John DOUGLAS1
SUMMARY
When structures are tested against earthquake loading, either within laboratories or by computer modelling, observed strong-motion records are commonly used as input. However, the method to select records is often not stated and it is thought that records are often chosen simply because they are well-known. Until the early 1990s, strong-motion data was relatively difficult to obtain and process and, in addition, the amount of, particularly near-source, strong-motion was limited. Therefore using standard records was often the only option. However, since then a number of large well-recorded earthquakes have occurred and also there are many new strong-motion data sources available.
As a snapshot of the state-of-the-practice for record selection for structural testing in Europe the proceedings of the last European Conference on Earthquake Engineering (12ECEE) was used. Using those articles concerned with structural testing where strong-motion records are used, a summary of the most popular records chosen and, if known, why they were selected, is given. It is found that a small subset of 13 well-known records is often used, irrespective of other considerations. The mode of the number of input accelerograms used per study is three.
Strong-motion records within structural testing could be used simply to validate that the shake table or the computer model functions and to show general aspects of the structures’ response. For such applications the choice of the strong-motion records is not important and the current method of using well-known records could be maintained. However, more often structural testing is employed in order to understand the characteristics of the modelled structure and to estimate its vulnerability to earthquake shaking. For this purpose a more scientific method of choosing input time-histories is required. The procedure suggested here recognises the observed variety with respect to amplitude, frequency content, duration and shape of earthquake ground motions in order to better understand the characteristics of the structure.
1. INTRODUCTION
In many articles on earthquake engineering the authors undertake testing of their considered structure within the laboratory and/or by using numerical modelling. In the past it was common to use harmonic signals, simple pulses or white noise as input time-histories since they were easy to apply, their results were relatively straightforward to interpret and strong-motion data was limited (e.g. Newmark & Rosenblueth, 1971). It has now become common to use observed strong-motion records as input to the structural models. For example, about 40% of the papers on structural aspects of earthquake engineering presented at the last European Conference on Earthquake Engineering in London in 2002 used at least one natural (modified or not) strong-motion record. At present, however, most papers focussed on structural modelling do not present their criteria for selecting the strong-motion records they use nor are the records they use optimal for gaining an understanding of the behaviour of the modelled system. Most studies are mainly concerned with the effect of structural parameters on the structure’s behaviour rather than on the importance of ground-motion characteristics even though shaking characteristics have a large effect on the structure’s response. These effects cannot fully be modelled by simply scaling the same time-history to different values of peak ground acceleration (PGA) as is commonly done.
1
BRGM – ARN/RIS, 3 avenue C. Guillemin, BP 36009, 45060 ORLEANS Cedex 2, France Email : [email protected]
The aim of this paper is not to propose a new scheme for systemic selection of records for proposed engineering projects [see, e.g., Bommer & Acevedo (2004) for a discussion of these procedures] but to encourage authors of studies on the analysis of structures presented at conferences or in journals to be more selective in their choice of input time-histories. A better selection of time-histories would enable significant extra value to be extracted from their work without requiring much extra computational or analysis effort on their part. In addition, it would allow a more accurate assessment of the sensitivity of their results to the ground motion, which is currently impossible when a very limited number of input accelerograms is used.
This article begins with a summary the results of a survey of the studies on structural modelling presented at the last European Conference. Following this, an improved method for the selection of natural accelerograms is proposed and an simple example application is presented.
2. SURVEY OF TIME-HISTORIES CURRENTLY USED IN STRUCTURAL TESTING
The articles in the Proceedings of the Twelfth European Conference on Earthquake Engineering from 2002 were used as a snapshot of the state-of-the-practice of structural testing for earthquake engineering. The focus here is on analysis of masonry, concrete and steel structures. Analysis of geotechnical structures is not considered. Articles from the theme ‘Structural Earthquake Engineering – Analysis & Design’ were consulted. In total, 188 articles were included in the survey. Of these, 72 articles (about 40%) used natural accelerograms (modified or not) as input to their analysis.
Some studies (e.g. Gomez et al., 2002) have used simulated strong-motion records since no records existed for their site of interest and a significant number of others (e.g. Isakovic et al., 2002) have generated synthetic records to match a design spectrum. These studies are not considered further here. The interested reader is referred to Bommer & Acevedo (2004) for a discussion of this type of approach.
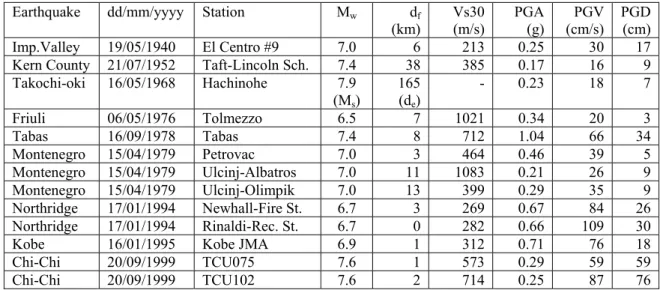
The mode of the number of acceleration time-histories used per study is three and the range is one to 80 records. Table 1 presents a summary of the strong-motion records commonly employed in structural testing along with basic event, path, site and strong-motion parameters of each record. Many studies use only a single record, often the NS component of the famous El Centro 1940 accelerogram. Independent variables and strong-motion parameters for the records listed in Table 1 were taken from the database of the PEER NGA project (http://peer.berkeley.edu/nga/index.html) or from Ambraseys et al. (2004) except for the parameters of the Hachinohe record.
Many of the time-histories commonly used are from analogue instruments that can feature significant long-period noise (e.g. Boore & Bommer, 2005) and hence examining response displacement time-histories produced by such motions could be inappropriate unless the long-period noise present in the records is removed by careful processing.
Due to the high sensitivity of results from structural modelling to the set of input acceleration time-histories used (e.g. Kwon & Elnashai, 2004) it is important that a reasonably large set of accelerograms is employed so that the uncertainty in the results can be assessed. However, many of the articles surveyed here used only a single input time-history and hence the sensitivity in the results obtained with respect to ground-motion characteristics cannot be assessed. In addition, the heavy reliance on the El Centro and other commonly chosen records could mean that results obtained are biased and their uncertainty could be underestimated.
Table 1: Strong-motion records most commonly employed in structural testing
Earthquake dd/mm/yyyy Station Mw df
(km) Vs30 (m/s) PGA (g) PGV (cm/s) PGD (cm) Imp.Valley 19/05/1940 El Centro #9 7.0 6 213 0.25 30 17 Kern County 21/07/1952 Taft-Lincoln Sch. 7.4 38 385 0.17 16 9 Takochi-oki 16/05/1968 Hachinohe 7.9 (Ms) 165 (de) - 0.23 18 7 Friuli 06/05/1976 Tolmezzo 6.5 7 1021 0.34 20 3 Tabas 16/09/1978 Tabas 7.4 8 712 1.04 66 34 Montenegro 15/04/1979 Petrovac 7.0 3 464 0.46 39 5 Montenegro 15/04/1979 Ulcinj-Albatros 7.0 11 1083 0.21 26 9 Montenegro 15/04/1979 Ulcinj-Olimpik 7.0 13 399 0.29 35 9 Northridge 17/01/1994 Newhall-Fire St. 6.7 3 269 0.67 84 26 Northridge 17/01/1994 Rinaldi-Rec. St. 6.7 0 282 0.66 109 30
Kobe 16/01/1995 Kobe JMA 6.9 1 312 0.71 76 18
Chi-Chi 20/09/1999 TCU075 7.6 1 573 0.29 59 59
Chi-Chi 20/09/1999 TCU102 7.6 2 714 0.25 87 76
where: df is the distance to the surface projection of the rupture (Joyner-Boore distance), de is the epicentral
distance, Vs30 is the average shear-wave velocity in the upper 30m, PGV is peak ground velocity and PGD is peak ground displacement. For records from Ambraseys et al. (2004) and for the Hachinohe record strong-motion parameters are reported for the component with the largest horizontal PGA. For other accelerograms the geometric average of the two orthogonal horizontal components orientated randomly is given.
If a strong-motion record is simply used within an analysis to verify that the numerical (e.g. finite element analysis) or experimental test works then the selection of which time-history to use is not important. However, in order to fully test the procedure it is suggested that ground motion records that produce large demands on the structure are selected in order that the simulation reaches the nonlinear range.
In a few studies, which accelerograms are used as input is not stated at all. This information is required by readers of the article in order that the results can be properly interpreted and also so that the experiments undertaken can be repeated by future researchers, which is an important requirement in scientific experiments. Similarly some studies simply state the name of the earthquake or recording site when introducing the time-histories used. In strong-motion databanks there are often numerous accelerograms of the same earthquake from different stations and multiple records from the same station of various earthquakes. Therefore this lack of precision does not help to understand the results of the study nor to repeat it. Also often the use of a strong-motion record is reported without stating which component of horizontal strong-motion was used. Since usually two perpendicular horizontal components are recorded that can display significantly different motions it is important to state which component is chosen.
Some studies are conducted to investigate the damage caused to a structure during a previous earthquake using strong-motion records that were recorded at the structure itself (e.g. Bessason et al., 2002), at a site close by (e.g. Akbas et al., 2002) or have characteristics of ground motions that were thought to have occurred at the site. This method for time-history selection is obviously only an option if the study is conducted after a damaging earthquake during which accelerograms were recorded.
2.1 Geographical selection criteria
One criterion adopted by many authors is geographical proximity of the earthquake to the site of the considered structure, although often this preference for records from close to home is not explicitly stated. Geographical proximity would be a important criterion if earthquake ground motions display high regional variability. However, this variation has not yet been shown to be real for many regions and therefore adopting regional proximity as a criterion is not currently justified and will often mean choosing from a small subset of available records. Douglas (2004a) considers ground motions from five regions of Europe (the Caucasus region, central Italy, Friuli, Greece and southern Iceland) and by applying analysis of variance to data binned into similar magnitude and distance intervals concludes that there is little evidence for inter-regional variations in ground motions within Europe. Douglas (2004b) applies a similar method to data from Europe and California and finds that ground motions could have, on average, slightly higher amplitudes in California than in Europe and
therefore perhaps it is best not to mixed data from these two regions. On the other hand, Ambraseys et al. (2005) find that predictions from their ground-motion model derived using only data from Europe and the Middle East matches predictions of models derived using Californian data and also peak ground accelerations observed during the Parkfield 2004 earthquake.
Ground motions in stable continental regions (SCRs) are richer in high-frequency motions than those in more seismically active regions (e.g. Campbell, 2003) and hence an analysis made for a structure in such a region should ideally use input accelerograms from SCRs. However, at present there is little ground-motion data of engineering significance from such regions (e.g. Lubkowski et al., 2004). One of the few studies to use records from SCRs in the 2002 proceedings is the study by Tremblay & Bouatay (2002), who use such records since the study is concerned with structures in Canada, part of which is an SCR.
Ground motions from subduction-zone earthquakes, especially shallow thrust events occurring on the interface between the two plates, display different characteristics to those from shallow crustal earthquakes (e.g. Atkinson & Boore, 2003) and hence only records from the tectonic type of events likely to be important for the considered structure should be selected.
2.2 Selection based on ground-motion characteristics
Amadio et al. (2002) select three accelerograms (El Centro 1940, Romania 1977 and Mexico City 1985) with varying frequency contents (shown by differences in their response spectra) in order to investigate the effect of frequency content on structural response. Similarly other authors have chosen records with varying characteristics (e.g. Aziz, 2002) although neither the selection procedure nor which characteristics vary are usually stated.
Some studies (e.g. Liao, 2002) make a distinction between near-field and far-field records because these two types of motions induce different types of response in the modelled structure.
De Matteis (2002) and other authors select sets of a handful of time-histories that have an average response spectrum similar to Eurocode 8 or other design spectra.
A number of studies make the (sometimes unstated) choice of selecting ‘severe’ records that will apply large demands to the modelled system. The method used for assessing the severity of these records, however, is not often explicitly stated. Most of the commonly-used records are not associated with strong-motion parameters that are the worst case.
2.3 Unspecified selection criteria
For many studies, no reason is given in for choosing the selected records listed in Table 1. Therefore it is assumed that the authors of these study used these records because they are commonly employed. In fact, Elghazouli (2002) explicitly states that he uses the El Centro 1940 record because it is often used for analysing structures. This finding that much work is still based on the El Centro 1940 record and that it is not necessarily an appropriate choice has been noted many times in the past, for example Bolt (1999) notes that the values of PGV and PGD from this record are less than would be expected for the associated magnitude and distance of this record. Many of the records listed in Table 1 were, at the time of their recording, exceptional records due to being recorded close to large magnitudes earthquakes and/or with high values of amplitude-based strong-motion parameters, such as PGA. However, most of the records listed in Table 1 are more than 25 years old and are no longer the severest motions recorded nor are they anymore the only accelerograms from the near-source of large earthquakes.
2.4 Selection criteria based on seismic hazard
If the location of the modelled structure is known or the study is conducted for a typical type of building for a region then the selected time-histories should be representative of the hazard level at the site. Very few studies in the sample set include a discussion on the applicably of the chosen records with respect the seismic hazard at the site under consideration. For example, all except one of the records listed in Table 1 are from earthquakes with Mw≥6.7 and consequently the use of such records to analyse structures in regions where such large earthquakes
are thought not to occur (e.g. many regions of Europe) is not appropriate since they will impose greater demands on the structure (particularly with respect to the duration of shaking) than could occur in practice. One study that does consider the hazard level to select accelerograms is the article by Tremblay & Bouatay (2002) who selects
records based on tectonics and the magnitude-distance ranges of design events. Di Donna et al. (2002) state that they use the Sturno record from the Irpina 1980 earthquake since it is considered representative of the 500-year ground motions for the considered site. In order to be able to consider the magnitude-distance couples of design events based on a probabilistic seismic hazard analysis, disaggregation of the hazard (e.g. Bazzurro & Cornell, 1999) would have to be performed, which is not yet common practice in Europe.
2.5 Modifications to selected time-histories
A number of studies (e.g. Colombo et al., 2002) account for variations in shaking intensity simply by scaling the selected records to different values of PGA. However, the severity of ground motion is not solely a function of the amplitude but also the frequency content, the duration of shaking and how and how much energy is imparted to the structure. The method proposed below allows the importance of these different characteristics to be assessed.
A few studies modify the natural accelerograms in other ways. For example, Sextos et al. (2002) deconvolve the Kallithea record from the Athens 1999 earthquake, which was from a soil site, down to bedrock. Some studies modified the selected time-histories to conform to a seismic building code (e.g. Colombo et al., 2002).
3. PROPOSED METHOD
In the past couple of decades, many new sources of earthquake strong-motion records have been developed: on the Internet, e.g. ISESD (http://www.isesd.cv.ic.ac.uk), COSMOS (http://db.cosmos-eq.org/scripts/default.plx) or the PEER NGA database (http://peer.berkeley.edu/nga/index.html), or on CD ROMs (e.g. Seekins et al., 1992; Ambraseys et al., 2004). These are the source of many thousands of potential input accelerograms to structural analysis. However, structural testing is an time-consuming and expensive exercise therefore the number of input time-histories used should be kept to a minimum but at the same time the selected records should allow the behaviour of the structures to be investigated and also the sensitivity of this behaviour to variations in ground motions to be understood. This section reports a method developed during the VEDA project (Douglas, 2006). This project seeks to derive fragility curves for earthquake risk evaluation in France using not only amplitude as the sole ground-motion intensity measure but also other parameters such as duration. The following section shows an application of this selection procedure.
Currently, most modelling of the response of structures to earthquakes is conducted using one-dimensional horizontal excitation and therefore only horizontal components are considered here and, in addition, the two horizontal components from the same triaxial strong-motion record are considered independently.
In order that a efficient set of input accelerograms is selected some ideas from the theory of Design of Experiments (DOE) (e.g. http://www.itl.nist.gov/div898/handbook/pri/section1/pri1.htm) are employed. Well design experiments maximize the amount of information that can be obtained for a given amount of experimental effort.
Since one purpose of structural testing should be to decide which characteristics of strong ground motions are important for the modelled structures, the experimental design required has a screening objective. The primary purpose of these experiments is to select or screen out the few important main effects from the many less important ones. These designs are also termed main effects designs.
In the terminology of black box process models of DOE, the structural model is the process and the estimated damage parameters from these models are the outputs (responses). The controlled inputs (factors) are split into the parameters defining the structural model (strength of concrete etc.) and the input ground motions. At this stage, there are no uncontrolled inputs (co-factors) since everything can be set by the experimenter. (In reality, the parameters required for the structural model are not known exactly.) Since there is an infinite variety of possible earthquake ground motions it is useful to characterise them using a number of scalar strong-motion parameters that approximately measure different properties of the motions (amplitude, frequency content, duration, energy etc.). Hence the set of strong-motion parameters becomes the controlled inputs to the process. The benefit of this approach is that it is then easier to understand the results of the structural modelling with respect to properties of the input accelerograms. However, since these strong-motion parameters do not perfectly characterise the ground motions (no small set of scalars can hope to fully characterise the true complexity of ground motions) the use of strong-motion parameters introduces uncontrolled factors (co-factors) due to the complexity of the motions not measured by the strong-motion parameters chosen. The strong-motion parameters chosen now define the main effects in the model.
Since it is not known a priori which strong-motion parameters are the most appropriate to model the demand for the considered structure, a screening study is required. It is hoped that the result of this screening process will be a preliminary list of which strong-motion parameters are useful to investigate as possible measures of the seismic intensity for further investigation of the structure’s response.
3.1 Selection based on seismic hazard of region
The first stage of the proposed method is to apply a magnitude-distance filter to exclude records from magnitudes and distances that are not possible for the considered region by considering the seismogenic sources in the region in terms of their location and maximum magnitude or by making use of disaggregation results. Also records from small earthquakes and great distances should be excluded since these will not lead to significant damage to modelled structures unless the structures are particularly weak.
After this first step it is likely that there will still be too many strong-motion records to use all as input to the structural models because of the long run times of numerical models and the high cost of shake-table tests. Therefore an additional selection procedure must be employed to further reduce the total number of selected accelerograms. This additional step is based on selecting records with different characteristics measured by the values of various strong-motion parameters.
3.2 Selection based on strong-motion parameters
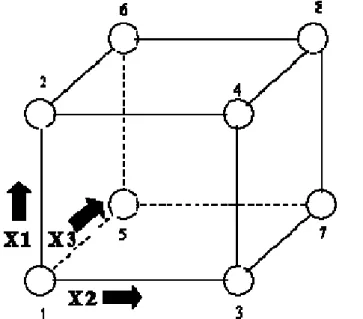
The selection procedure proposed here is to use a two-level factorial technique where for each strong-motion parameter selected records are chosen to fall within two intervals: either high or low value bins. Figure 1 graphically shows the approach for three strong-motion parameters. One record is chosen to be at each corner of the cube. This experimental design then allows the effect of each strong-motion parameter on the damage sustained to the structure to be investigated but also the interaction effects due to the combined effects of two parameters, for example amplitude and duration.
Figure 1: A 23 two-level, full factorial design with factors X1, X2 and X3. Arrows show increasing values of the factors (from http://www.itl.nist.gov/div898/handbook/pri/section3/pri3331.htm).
A full factorial run consisting of two-levels for each strong-motion parameter becomes large when only a few strong-motion parameters are considered (e.g. 26=64 records for six strong-motion parameters). In addition, it is important to produce a number of independent sets of strong-motion records in order that the variability due to the uncontrolled factors, not captured by the strong-motion parameters, can be studied. One type of experimental design that can reduce the required number of records is a fractional factorial design. This choice assumes that interaction effects can be neglected. The most commonly used fractional factorial design is one that uses only half the amount of experiments. Since 23=8 records is about the maximum possible for each experiment because it is necessary to undertake repeat experiments, this leads to a maximum choice of four strong-motion parameters (24/2=8 records). In addition, the choice of more strong-motion parameters would cut up the available data too much and would make it impossible to find records for each corner of the cube, leaving some bins empty.
So that an efficient set of strong-motion parameters (i.e. the smallest set that allows the effect of different aspects of the motions on the structure’s behaviour to be investigated) is used it is preferable if a set of poorly correlated parameters is chosen. Ideally the chosen parameters should be orthogonal to each other so that the same characteristics of the motions (e.g. amplitude or duration) is not measured twice by two different parameters. The following section shows the application of this approach for the selection of time-histories for the VEDA project (Douglas, 2006).
4. EXAMPLE APPLICATION 4.1 Selection based on seismic hazard of region
The geographical scope of VEDA is France although it is hoped that the results obtained will be useful for the definition of fragility curves for use in other countries. Metropolitan France has a seismic hazard that is thought to be characterised by earthquakes of magnitudes (ML) less than or equal to 6.3 (except for distant earthquakes
occurring in the Italian Apennines) (Marin et al., 2004). Therefore accelerograms from small and moderate earthquakes with magnitudes less than about 6.3 are most appropriate for this project. In addition, Marin et al. (2004) consider that the average focal depths in France are less than or equal to 12km. In view of this, the CD ROM of strong-motion records developed by Ambraseys et al. (2004) has been chosen as the source of data for this project since it provides a large set of data mainly from moderate (Mw<6.5) shallow (h<30km) earthquakes
that occurred within Europe and the Middle East. The data provided by Ambraseys et al. (2004) has also been thoroughly validated within various projects leading up to the publication of the CD ROM and consequently it provides a reliable source of data. Finally, the strong-motion records contained on the CD ROM have been individually processed using bandpass filters based on the signal-to-noise ratio of the record and therefore the acceleration, velocity and displacement time-histories should be free of noise within the passband of the filters used. Search criteria of 5.3≤Mw≤6.3, de≤30km and focal depths≤30km using the database of Ambraseys et al.
(2004) returned 210 horizontal components. This is obvious too many to use all as input to complex numerical models. Therefore the next stage is to reduce this number using criteria based on strong-motion parameters.
4.2 Selection based on strong-motion parameters
Another constraint that is important for future use of the fragility curves developed in VEDA is that the strong-motion parameters used to characterise the intensity of the ground strong-motions can be predicted with accuracy when conducting a earthquake risk assessment using the fragility curves. In practice, this means that reliable and consistent (with respect to the seismotectonics of metropolitan France and the magnitude and distance range considered) ground motion estimation equations (GMEE) (e.g. Douglas, 2003) for the prediction of the chosen strong-motion parameters must be available. This reduces the number of possible strong-motion parameters that can be used to select the set of records since reliable GMEEs are available for few strong-motion parameters. Unlike parameters for amplitude or duration, pure measures of the frequency content such as the mean period,
Tm, or predominant spectral period, Tp, (Rathje et al., 2004) will not cause a monotonic increase in damage with
increasing values of the parameter. For example, holding other characteristics of the motion constant an increase in the amplitude of ground motions will invariably lead to an increase in damage hence it can be used as a measure of the seismic intensity along the x-axis of fragility curves. However, an increase in Tm holding other
characteristics constant does not necessarily increase the damage but its effect will depend on the natural period of the structure and other structural parameters. Thus it is not useful to use such pure frequency content measures within a factorial design as proposed here.
Bommer et al. (2006) find that duration and the effective number of cycles within ground motions are, in general, very poorly correlated. Therefore it would be useful to select strong-motion records with varying durations and numbers of effective cycles in order to investigate the effect of both these ground-motion characteristics on the structural damage. However, since there are currently no useable GMEEs to predict number of cycles of earthquake ground motions, number of cycles is not chosen as a strong-motion parameter for the selection procedure.
Aochi & Douglas (2006) present a table (their Table VII) listing the correlation coefficients between a number of strong-motion parameters based on the data of Ambraseys et al. (2005). They find that relative significant duration (τSR) (using the interval between 5 and 95% of total Arias intensity, AI) is very weakly correlated to
the prediction of this parameter (Abrahamson & Silva, 1996). Hence it is a good choice of parameter for characterising the duration of earthquake ground motions for VEDA.
Aochi & Douglas (2006) also find that AI is quite strongly correlated with amplitude measures: PGA, PGV and Sa at periods from 0.1 to 2.0s (correlation coefficients between 0.60 and 0.80). Therefore it is not an ideal choice
as a selection strong-motion parameter but it does measure the energy input into the structure and also has been found to be useful for the prediction of structural damage in earlier studies (e.g. Bommer et al., 2004). However, it was found that within the dataset used here that, due to the high correlation between AI and Sd at 0.1 and 1.0s,
it was not possible to find strong-motion records within every bin. Therefore AI was dropped as a strong-motion parameter for selecting records.
PGA and Sa are also strongly correlated especially at short periods. Aochi & Douglas (2006) report correlations
between PGA and Sa between 0.63 (for 2.0s) and 0.93 (for 0.1s). However, the combination of two amplitude
measures at two separated periods provides a measure of both the amplitude and frequency content of a strong-motion record.
Table 2 lists the strong-motion parameters chosen to undertake the selection of records for VEDA along with the minimum and maximum values of these parameters within the set of records with 5.3≤Mw≤6.3, de≤30km and
focal depths≤30km and the ranges of the low and high bins used for selecting the records. The ranges of the low and high bins were chosen in order to have sufficient numbers of records within each bin. A more powerful test of which strong-motion parameters are useful for estimating damage would be obtained if the ranges of the bins used was minimised so that the scatter in the strong-motion parameters within each bin was reduced. However, due to the limited amount of data this was unfortunately not possible so large ranges had to be adopted.
Table 2 : Strong-motion parameters and ranges of low and high bins used for selecting records. Also given are the minimum and maximum values of the strong-motion parameters in the subset of Ambraseys et al.
(2004) used.
Parameter Minimum Maximum Low bin range High bin range
Sd at 0.1s in cm 0.0035 0.37 ≤0.03 >0.03
Sd at 1.0s in cm 0.059 16.7 ≤0.5 >0.5
τSR is s 2.56 24.48 ≤10 >10
Where Sd is elastic response spectral displacement for 5% damping.
The databank of records was searched to find records that fall within the different bins. Within each bin a random record from those within the bin was chosen to form part of the strong-motion selection. Since only three strong-motion parameters are used to undertake the selection the fractional factorial approach described above does not need to be followed. This will also allow the investigation of interaction effects between different characteristics of the motions. Hence sets of eight strong-motion records were selected for each independent input dataset. It was possible to find four independent sets of eight records (32 records in total) using this approach. These four sets will be used as input to the models of VEDA.
Once structural testing has been performed using these selected accelerograms it is planned to use the method of, for example, Rabinowitz et al. (1998) to interpret the results and find which characteristics of the ground motions are most important for understanding the behaviour of the structures considered. These results will then be used to construct fragility curves.
5. CONCLUSIONS
This article presents a survey of the current state-of-the-practice for natural accelerogram selection for use as input to structural testing. It shows that even though the quantity and quality of strong-motion data has increased dramatically over the past 25 years and also that access to this data has been considerably improved through the creation of CD ROMs and Internet sites, many authors continue to select from a limited set of well-known accelerograms (e.g. El Centro 1940). Since the use of a common set of strong-motion records (e.g. El Centro 1940 and Petrovac 1979) is firmly imbedded within earthquake engineering practice, a more appropriate set of
standard strong-motion records to use could be proposed. A common set would also allow comparisons to be easily made between different studies.
In contrast to this possible approach, this article presents a simple selection procedure leading to a small set (of probably eight or sixteen records) of accelerograms that can be used to efficiently investigate the behaviour of modelled structures under different types of earthquake loading.
6. ACKNOWLEDGEMENTS
Some of the work presented in this article was developed during the ANR project ‘Seismic vulnerability of structures: A damage mechanics approach’ (VEDA). The rest was funded by internal BRGM research projects. I thank Caterina Negulescu for her comments on the first version of this paper.
7. REFERENCES
Abrahamson N. A., Silva W. J. (1996), Empirical ground motion models. Report to Brookhaven National Laboratory. Reported in Stewart et al. (2001).
Akbas, B., Uckan, E., Shen, J. (2002), Seismic behaviour and push-over analysis of M.Inan viaduct, Proceedings
of the Twelfth European Conference on Earthquake Engineering, Paper no. 042.
Amadio, C., Fragiacomo, M., Rajgelj, S. (2002), The effect of repeated seismic actions on structures,
Proceedings of the Twelfth European Conference on Earthquake Engineering, Paper no. 756.
Ambraseys, N. N., Douglas, J., Sarma, S. K., Smit, P. M. (2005), Equations for the estimation of strong ground motions from shallow crustal earthquakes using data from Europe and the Middle East: Horizontal peak ground acceleration and spectral acceleration. Bulletin of Earthquake Engineering, 3(1):1–53.
Ambraseys, N. N., Douglas, J., Sigbjörnsson, R., Berge-Thierry, C., Suhadolc, P., Costa, G., Smit, P. M. (2004),
Dissemination of European Strong- Motion Data, vol. 2 using Strong-Motion Datascape Navigator.
CD-ROM collection, Engineering and Physical Sciences Research Council, United Kingdom.
Aochi, H., Douglas, J. (2006), Testing the validity of simulated strong ground motion from the dynamic rupture of a finite fault, by using empirical equations, Bulletin of Earthquake Engineering, in press.
Atkinson, G. M., Boore, D. M. (2003), Empirical ground-motion relations for subduction-zone earthquakes and their application to Cascadia and other regions, Bulletin of the Seismological Society of America, 93(4), 1703-1729.
Aziz, T. S. (2002), Nonlinear secondary systems interactions in buildings, Proceedings of the Twelfth European
Conference on Earthquake Engineering, Paper no. 739.
Bazzurro, P., Cornell, C. A. (1999), Disaggregation of seismic hazard, Bulletin of the Seismological Society of
America, 89(2), 501-520.
Bessason, B., Thorarinsson, O., Haflidason, E. (2002), The south Iceland earthquakes of June 2000 – recorded response of retrofitted base isolated steel arch bridge, Proceedings of the Twelfth European Conference on
Earthquake Engineering, Paper no. 300.
Bolt, B. A. (1999), Estimating seismic ground motion, Earthquake Spectra, 15(2), 187-197.
Bommer J. J., Acevedo A. B. (2004), The use of real earthquake accelerograms as input to dynamic analysis,
Journal of Earthquake Engineering, 8(Special issue 1), 43-91.
Bommer, J. J., Hancock, J., Alarcón, J. E. (2006), Correlations between duration and number of effective cycles of earthquake ground motion, Soil Dynamics and Earthquake Engineering, 26(1), 1-13.
Bommer, J. J., Magenes, G., Hancock, J., Penazzo, P. (2004), The influence of strong-motion duration on the seismic response of masonry structures, Bulletin of Earthquake Engineering, 2(1), 1-26.
Boore, D. M., Bommer, J. J. (2005), Processing of strong-motion accelerograms: needs, options and consequences, Soil Dynamics and Earthquake Engineering, 25, 93-115.
Campbell, K. W. (2003), Prediction of strong ground-motion using the hybrid empirical method and its use in the development of ground-motion (attenuation) relations in eastern North America, Bulletin of the
Seismological Society of America, 93(3), 1012-1033.
Colombo, A., Fardis, M. N., Molina, J., Negro, P., Panagiotakos, T. B., Tsionis, G. (2002), Pseudodynamic response of dual RC structure with different designs, Proceedings of the Twelfth European Conference on
Earthquake Engineering, Paper no. 297.
De Matteis, G. (2002), Seismic performance of MR steel frames stiffened by light-weight cladding panels,
Proceedings of the Twelfth European Conference on Earthquake Engineering, Paper no. 308.
Di Donna, M., Serino, G., Giannini, R. (2002), Advanced earthquake protection systems for high voltage electic equipment, Proceedings of the Twelfth European Conference on Earthquake Engineering, Paper no. 570.
Douglas, J. (2003), Earthquake ground motion estimation using strong-motion records: A review of equations for the estimation of peak ground acceleration and response spectral ordinates. Earth-Science Reviews, 61(1– 2): 43–104.
Douglas, J. (2004a), An investigation of analysis of variance as a tool for exploring regional differences in strong ground motions. Journal of Seismology, 8(4):485–496.
Douglas, J. (2004b), Use of analysis of variance for the investigation of regional dependence of strong ground motions. Proceedings of Thirteenth World Conference on Earthquake Engineering, Paper no. 29.
Douglas, J. (2006), Selection of strong-motion records for use as input to the structural models of VEDA, Final report, BRGM/RP-54584-FR.
Elghazouli, A. Y. (2002), Seismic performance of concentrically braced steel frames, Proceedings of the Twelfth
European Conference on Earthquake Engineering, Paper no. 520.
Gomez, R., Muñoz, D., Escobar, J. A., Garcia, M., Calderon, A. (2002), Seismic evaluation of a truss bridge with energy isolation devices, Proceedings of the Twelfth European Conference on Earthquake
Engineering, Paper no. 659.
Isakovic, T., Fischinger, M., Medeot, R. (2002), Seismic isolation of viaducts in Slovenia, Proceedings of the
Twelfth European Conference on Earthquake Engineering, Paper no. 077.
Kwon, O.-S., Elnashai, A. (2004), Sensitivity of analytical vulnerability functions to input and response parameter randomness, Proceedings of the Thirteenth World Conference on Earthquake Engineering, Paper no. 3433.
Liao, W. I. (2002), Earthquake responses of steel moment resisting frames subjected to near-fault ground motions, Proceedings of the Twelfth European Conference on Earthquake Engineering, Paper no. 035. Lubkowski, Z., Bommer, J., Baptie, B., Bird, J., Douglas, J., Free, M., Hancock, J., Sargeant, S., Sartain, N.,
Strasser, F. (2004), An evaluation of attenuation relationships for seismic hazard assessment in the UK,
Proceedings of the Thirteenth World Conference on Earthquake Engineering, Paper no. 1422.
Marin, S., Avouac, J.-P., Nicolas, M., Schlupp, A. (2004), A probabilistic approach to seismic hazard in metropolitan France, Bulletin of the Seismological Society of America, 94(6), 2137-2163.
Newmark, N. M., Rosenblueth, E. (1971), Fundamentals of earthquake engineering, Englewood Cliffs, New Jersey, USA: Prentice-Hall, Inc.
Rabinowitz, N., Steinberg, D. M., Leonard, G. (1998), Logic trees, sensitivity analyses, and data reduction in probabilistic seismic hazard assessment. Earthquake Spectra, 14(1) , 189-201.
Rathje, E. M., Faraj, F., Russell, S., Bray, J. D. (2004), Empirical relationships for frequency content parameters of earthquake ground motions, Earthquake Spectra, 20(1), 119-144.
Seekins L.C., Brady A.G., Carpenter C., Brown N. (1992), Digital Data Series DDS-7. ‘Digitized strong-motion
accelerograms of North and Central American earthquakes 1933-1986’. CD-ROM.
Sextos, A., Kappos, A., Pitilakis, K. (2002), Effect of analysis complexity on the calculated ductility demand of R/C bridge piers, Proceedings of the Twelfth European Conference on Earthquake Engineering, Paper no. 653.
Stewart J. P., Chiou S.-J., Bray J. D., Graves R. W., Somerville P. G., Abrahamson N. A. (2001), Ground motion evaluation procedures for performance-based design. PEER Report 2001/09, Pacific Earthquake Engineering Research Center, College of Engineering, University of California, Berkeley, USA.
Tremblay, R., Bouatay, N. (2002), Loading protocols for the seismic testing of ductile bracing members in concentrically braced steel frames, Proceedings of the Twelfth European Conference on Earthquake