Characterization of Performance-Limiting Flow Mechanisms
in a Centrifugal Compressor Stage
by
David W. Erickson
B.S. Aerospace Engineering
Massachusetts Institute of Technology, 2010
Submitted to the Department of Aeronautics and Astronautics
in Partial Fulfillment of the Requirements for the Degree of
Master of Science in Aerospace Engineering
at the
MASSACHUSETTS INSTITUTE OF TECHNOLOGY
February 2017
2017 Massachusetts Institute of Technology. All rights reserved.
A uth or ...
Certified by ...
Certified
by...
r-7
Signature redacted
)epartment of Aeronautics and Astronautics
February 2, 2016
Signature redacted
...
Choon S. Tan
Senior Research Engineer of Aeronautics and Astronautics
Thesis Supervisor
Signature redacted
Signatur
Accepted by
...
MASSACHUSETTS INSTITUTE OF TECHNOLOGYMAR 0
9
2017
LIBRARIES
ARCHIVES
Michael Macrorie
Consulting Engineer at GE Aviation
Thesis Supervisor
e
redacted-Youssef M. Marzouk
Associate
rofessor of Aeronautics and Astronautics
Chair, Graduate Program Committee
... ... ... .... . . .. . .... .
Characterization of Performance-Limiting Flow Mechanisms
in a Centrifugal Compressor Stage
by
David W. Erickson
Submitted to the Department of Aeronautics and Astronautics
on February 2, 2017, in Partial Fulfillment of the
Requirements for the Degree of
Master of Science in Aerospace Engineering
Abstract
This research characterizes the performance of a centrifugal compressor stage with a spe-cial focus on the pipe diffuser. Two diffuser configurations are studied, one of which is a truncated version of the other. Experimental data acquired on a research compressor stage is interrogated along with a set of well-designed Reynolds-Averaged Navier Stokes compu-tations, complemented by reduced order flow modeling. The fundamental performance-limiting flow mechanisms in the diffuser are identified and used to physically relate im-portant geometry features and operating conditions to the observed compressor pressure rise, efficiency, and operability characteristics.
Despite large differences in their geometry, the two diffuser configurations exhibit simi-lar pressure recovery characteristics due to differences in exit nonuniformity and flow angle which result in similar effective area ratios. Variations in the diffuser pressure recovery coefficient with operating point are found to be most influenced by the diffuser inlet flow angle, and secondly by the inlet Mach number. The diffuser inlet flow angle has the prima-ry effect of setting the diffuser inlet one-dimensional area ratio, increasing diffusion at high flow angles. In addition, the diffuser incidence angle influences the formation of counter-rotating vortex pairs that persist throughout the diffuser passage. Using a two-dimensional integral boundary layer model that is modified to accommodate three-dimensional effects as source terms, these secondary flows are shown to detrimentally im-pact the diffuser pressure rise capability by accumulating high loss flow along the diffuser wall near the plane of symmetry between the vortices. This contributes to the extent and location of a large diffuser passage separation, especially for the baseline diffuser. The im-pact of the vortices on the boundary layer growth rate is shown to scale inversely with dif-fuser aspect ratio.
The major performance difference between the two diffuser configurations is that the truncated diffuser configuration experiences enhanced stall margin over the baseline dif-fuser at the design speed. These differences are traced to reduced secondary flows influence and thus reduced separation extent for the higher aspect ratio truncated diffuser. It is hy-pothesized that the onset of stall for the baseline diffuser configuration is initiated by the transition of the vortex location and corresponding passage separation between diffuser pressure and suction sides with increasing cusp incidence. Conversely, because the extent
of the passage separation in the truncated diffuser is diminished due to the higher aspect ratio, the switch in separation side does not immediately initiate instability.
The fact that secondary flows have a large influence on diffuser pressure rise capability and compressor stability is counter to conventional preliminary diffuser design approaches which neglect such 3D effects. The findings of this research may therefore be considered during preliminary design optimization to produce better-performing diffuser designs. Thesis Supervisor: Choon S. Tan
Title: Senior Research Engineer of Aeronautics and Astronautics Thesis Supervisor: Michael Macrorie
Acknowledgments
This research was a multi-year endeavor, complete with many ups, downs, and unexpected challenges. However, I had many people beside me, supporting this work and supporting me personally through completion. I would like to thank those people.
I'd like to thank GE Aviation on many levels. First, I am grateful for GE's financial
sponsorship of this research through contract 023859-001. Thanks to all who endeavored to work out the associated funding and legal details, including Caitlin Smythe for managing
these details throughout the duration of the program. I am also grateful for the expertise and guidance GE provided, especially from Mike Macrorie, Dave Parker, and Steve
Donnel-ly. Lastly, I am grateful for the support and flexibility allowed to me by my manager, Dave
Miller, as I struggled to balance work and school.
I also would like to thank both GE and the folks at RWTH Aachen University for all the
work that has been done over the past two decades to generate experimental data leveraged
by my work. Thanks to you, the most difficult part of this research was completed before I
even began.
Thank you to the MIT Gas Turbine Lab (GTL), and particularly to my advisor, Dr. Choon Tan, for your technical expertise and guidance. I am also grateful for the personal relationship that we developed during this period. I feel lucky to have a strong technical advisor who could keep me on track, while also prioritizing casual conversations and oyster feasts.
Thank you to all of my friends. Thank you to my GTL labmates who helped make the oldest offices at MIT feel more like a community. I also appreciated my time leading and competing with my friends in the MIT Sporting Clays Association (SCA). Also, thank you to my mountain biking friends, hiking friends, skiing friends, board game friends, etc., who really made this time enjoyable. Lastly, thank you to my church friends for waking up
ear-ly with me for Monday motivational coffee, and for conversations that helped me grow
per-sonally during this time as much as I grew professionally.
Thank you to my parents for all the work you invested into me in my younger days, only to have me pursue a life hundreds of miles away when I became older. Although you are not here physically, I know that you thought about me often as I worked through this, and that you cared. In the future, I look forward to Christmases at home without the thesis writing distraction. Thank you also to my mother-in-law, who ensures I feel at home here.
Last, but certainly not least, thank you to my wife Julie. I was afraid of marrying you halfway through this intensive degree, but because I did I may never be afraid again. Thank you for always making sacrifices for my sake, but especially these past few months. Thank you for your cheery, carefree personality that helps me to remember the bigger and better picture. I always enjoy coming home to your smiles, hugs, and unconditional love. I am excited for the future because it will be with you. I love you very much.
Contents
A b stra ct ... 3
Acknowledgm ents...5
List of Figures ... 11
List of Tables ... 19
List of Sym bols and Abbreviations ... 21
R o m a n ... 2 1 G reek ... 2 3 Subscripts and Superscripts...24
Abbreviations...25
Chapter 1 Introduction...27
1.1 Background and M otivation ... 27
1.2 Experim ental Com pressor Stage Description ... 28
1.3 Previous W ork...32
1.4 Research Objectives ... 35
1.5 Key Research Findings ... 36
1.6 Organization of Thesis... 37
Chapter 2 Research Approach ... 39
2.1 Com pressor Station Designations and Coordinate System s... 39
2.2 1D Flow Analysis ... 41
2.2.2 ID Flow Property Sets... 43
2.2.3 1D Closure Param eters ... 47
2.3 Perform ance Assessm ent Criteria... 50
2.4 Experim ental Data ... 54
2.4.1 Description of Test Rig ... 54
2.4.2 Sum m ary of Experim ental Data ... 57
2.4.3 Data Post-processing ... 61
2.5 Computational Fluid Dynamics (CFD)... 71
2.5.1 Description of CFD M odeling... 71
2.5.2 Sum m ary of CFD Cases ... 83
2.5.3 CFD Post-processing ... 83
2.6 Low-Order Flow M odeling ... 85
2.7 M odular Perspective of Diffusion System ... 85
2.8 Sum m ary of Research Approach ... 86
Chapter 3 Overall Com pressor Perform ance Assessm ent ... 89
3.1 Operating Point Definition ... 89
3.2 Overall Compressor Perform ance...93
3.3 Utility of CFD Solutions ... 102
3.3.1 Comparison of CFD Flow Field with Detailed Experimental Measurements...102
3.3.2 Effect of Diffuser Grid ... 105
Chapter 4 Im peller Perform ance Assessm ent ... 109
4.1 Im peller Perform ance ... 109
4.2 Im peller Perform ance Characterization...115
4.3 Im peller Exit Conditions ... 116
Chapter 5 Fundam ental Diffuser Flow M echanism s and Effects...121
5.2 Nonideal Effects...122
5.3 Effect of Compressibility...130
5.4 Summ ary of Fundamental Flow M echanisms ... 134
Chapter 6 Diffusion System Perform ance Assessment ... 137
6.1 Diffusion System and Diffuser Perform ance...139
6.2 Identification of Diffuser Flow M echanism s ... 148
6.3 Evolution of 1D Flow Conditions along Diffuser...153
6.4 Evaluation of Nonideal Effects...159
6.5 Diffuser Inlet Perform ance Assessment...165
6.5.1 Diffuser Inlet Perform ance...166
6.5.2 Diffuser Throat Conditions ... 171
6.5.3 Evaluation of Nonideal Effects...173
6.5.4 M ixing of Impeller Exit Circumferential Nonuniformity ... 177
6.5.5 Effect of Impeller Exit Flow Angle...181
6.5.6 Effect of Compressibility ... 185
6.5.7 Secondary Flows...187
6.5.8 Sum m ary of Diffuser Inlet Perform ance Assessment ... 199
6.6 Diffuser Passage Perform ance Assessment ... 200
6.6.1 Diffuser Passage Perform ance ... 201
6.6.2 Diffuser Exit Conditions...205
6.6.3 Evaluation of Nonideal Effects...207
6.6.4 Effect of Trailing Edge Thickness ... 210
6.6.5 Effect of Compressibility ... 211
6.6.6 Effect of Secondary Flows ... 214 6.6.7 Reconciliation of Experimental and CFD Calculated Diffuser Performance Trends
6.6.8 Summary of Diffuser Passage Performance Assessment ... 242
6.7 Role of Diffuser Leading Edge Cusps ... 243
6.8 Summary of Diffusion System Performance Assessment...245
Chapter 7 Overall Com pressor Stability Considerations...247
7.1 Stability Fundam entals ... 247
7.2 Hypothesized Stall M echanism s...249
Chapter 8 Sum m ary...253
Chapter 9 on usions ... 261
9.1 Objectives and Approach ... 261
9.2 Key Findings ... 262
9.3 Future W ork...263
Appendix A Problem s with the M ixed Out Average...265
List of Figures
Figure 1.1: 3D cutaway view of experimental centrifugal compressor in baseline
con figu ra tion ... 3 0
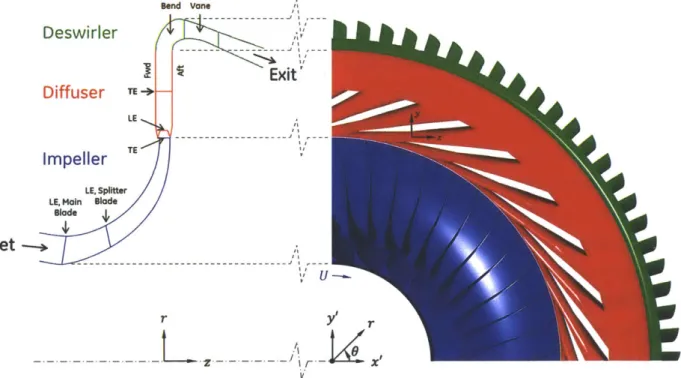
Figure 1.2: Side and front cutaway views of experimental centrifugal compressor with b a selin e diffu ser...3 1
Figure 1.3: Side and front cutaway views of experimental centrifugal compressor with trun cated diffu ser...3 1
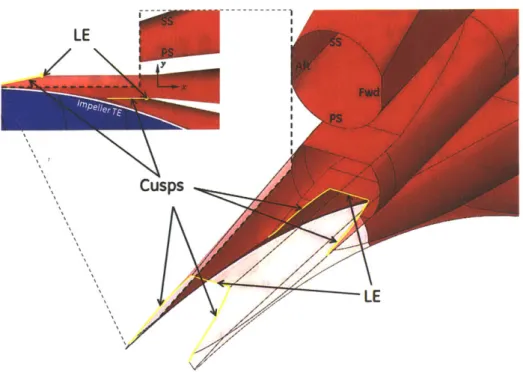
Figure 1.4: Front and 3D cutaway views of diffuser inlet geometry featuring leading edge
cu sp s . ... 3 2
Figure 2.1: Centrifugal compressor station designations and coordinate systems. ... 40 Figure 2.2: RWTH Aachen University compressor rig schematic [18] ... 55
Figure 2.3: RWTH Aachen University centrifugal compressor cross-section [1]...55
Figure 2.4: Overall compressor pressure ratio versus inlet corrected mass flow based on experimental measurements, highlighting key operating points. ... 57
Figure 2.5: Types and locations of permanent instrumentation utilized in current research.
... 5 9
Figure 2.6: Types and locations of traverse measurements utilized in current research. ... 60 Figure 2.7: Considerations for estimating 1D average impeller exit static pressure...66 Figure 2.8: Measured and estimated impeller shroud static pressure rise coefficient,V25 =
(pshroud- pt25)/(pt25U272), versus radius for baseline diffuser. ... 70
Figure 2.9: CFD model of compressor stage featuring baseline diffuser. ... 72
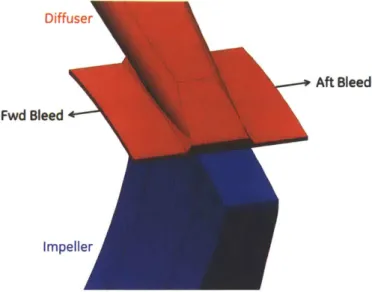
Figure 2.10: CFD model of impeller-diffuser interface featuring forward and aftward bleed slots ... 7 3
Figure 2.11: Compressor inlet conditions versus span used for CFD simulations...77 Figure 2.12: Structured and unstructured baseline diffuser grids near inlet. ... 79
Figure 2.14: Structured baseline diffuser grid y+ levels at 100E operating point. ... 81
Figure 2.15: Unstructured baseline diffuser grid y+ levels at 100E operating point...81
Figure 2.16: Structured truncated diffuser grid y+ levels at 100E operating point...82
Figure 2.17: Deswirler grid y+ levels at 100E operating point...82
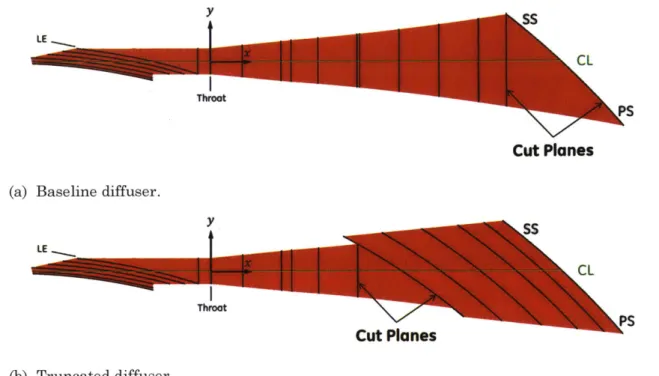
Figure 2.18: Cut planes used for 1D averaging of diffuser CFD solutions. ... 84
Figure 2.19: Cut planes used for 3D flow field visualization of CFD solutions (baseline diffu ser sh ow n). ... 8 5 Figure 2.20: Modular perspective of diffusion system...86
Figure 3.1: Regions along diffuser forward wall where experimental and CFD calculated static pressure distributions are interrogated for comparison...90
Figure 3.2: Static pressure recovery coefficient versus circumferential position at diffuser leading edge and forw ard w all. ... 91
Figure 3.3: Diffuser static pressure recovery coefficient versus throughflow position along diffuser centerline at forw ard w all. ... 92
Figure 3.4: 1D average impeller exit flow angles at major operating points...93
Figure 3.5: Overall compressor performance versus inlet corrected mass flow...95
Figure 3.6: Overall compressor performance versus impeller exit flow coefficient...96
Figure 3.7: Overall compressor polytropic efficiency versus impeller exit flow coefficient. .97 Figure 3.8: Overall compressor work coefficient versus impeller exit flow coefficient...99
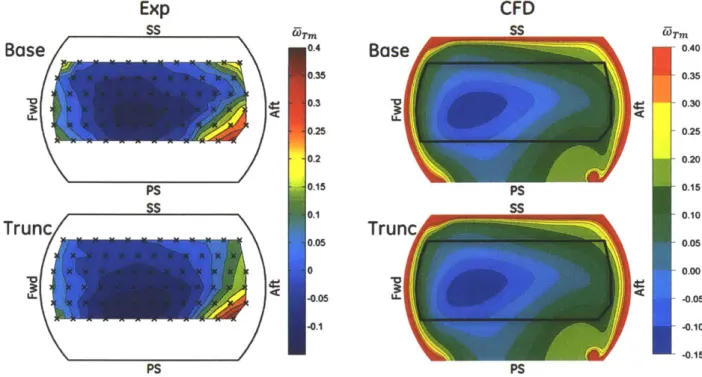
Figure 3.9: Overall compressor pressure rise coefficient versus impeller exit flow coefficien t...10 0 Figure 3.10: Overall compressor polytropic efficiency versus impeller exit flow coefficient. ... 1 0 1 Figure 3.11: Diffuser throat traverse plane (station Tm) stagnation pressure loss coefficient a t 10 0 E ... 10 3 Figure 3.12: Baseline diffuser exit plane (station 29) stagnation pressure loss coefficient at 10 0 E ... 10 4 Figure 3.13: Truncated diffuser exit plane (station 29) stagnation pressure loss coefficient a t 10 0 E ... 10 4 Figure 3.14: CFD calculated diffuser mid plane (Z2) stagnation pressure loss coefficient, velocity vectors, and reversed flow regions at 100E...105
Figure 3.15: Overall compressor work coefficient versus impeller exit flow coefficient at
10 0 %
N c25... . . . .. . . ..10 6Figure 3.16: Overall compressor pressure rise coefficient versus impeller exit flow
coefficient at 100% N c25. ... 107
Figure 3.17: Overall compressor polytropic efficiency versus impeller exit flow coefficient at 10 0 % N c25. ... 10 7 Figure 4.1: Impeller performance versus exit flow coefficient. ... 110
Figure 4.2: Impeller pressure rise coefficient versus exit flow coefficient. ... 111
Figure 4.3: Impeller polytropic efficiency versus exit flow coefficient. ... 112
Figure 4.4: Impeller polytropic efficiency calculated from static pressure measurements versus inlet corrected m ass flow ... 114
Figure 4.5: Impeller polytropic efficiency versus inlet relative flow angle...116
Figure 4.6: Impeller exit flow angle versus flow coefficient...117
Figure 4.7: Impeller exit Mach number versus flow angle...117
Figure 4.8: Impeller exit endwall vorticity vectors and streamwise vorticity distribution in absolute reference fram e...119
Figure 4.9: Impeller exit mass blockage versus flow angle...119
Figure 5.1: ID uniform flow in a conical diffuser. ... 121
Figure 5.2: Static pressure recovery coefficient versus diffuser area ratio for 1D inviscid incom pressible flow ... 122
Figure 5.3: Example inlet and exit velocity profiles (normalized by availability average inlet velocity) associated with simulated two stream incompressible diffusion process...123
Figure 5.4: Collection of nonuniform flow conditions imposed at inlet of two stream diffuser model to study impacts of nonuniformity amplification and mixing on diffuser pressure recovery an d loss. ... 124
Figure 5.5: Effect of flow nonuniformity on diffuser static pressure recovery coefficients w ith and w ithout m ixing...125
Figure 5.6: Effect of flow nonuniformity and associated mixing on diffuser stagnation pressure loss coefficients...127
Figure 5.7: 1D representation of nonuniform flow in a conical diffuser showing effective a re a ... 12 8
Figure 5.8: 1D uniform flow stagnation pressure loss coefficient due to scrubbing losses
versus diffuser area ratio...129
Figure 5.9: Sensitivity of pressure recovery coefficient changes to area changes versus M ach n u m ber...13 1 Figure 5.10: Static pressure recovery coefficient versus diffuser area ratio for 1D inviscid com pressible flow ... 132
Figure 5.11: 1D uniform flow stagnation pressure loss coefficient due to scrubbing losses normalized by equivalent incompressible loss versus diffuser area ratio. ... 134
Figure 6.1: Modular perspective of diffusion system performance ... 138
Figure 6.2: Fraction of diffusion system performance attributable to diffuser. ... 140
Figure 6.3: Fraction of diffuser performance attributable to inlet...141
Figure 6.4: Static pressure recovery coefficient versus impeller exit flow angle...142
Figure 6.5: Stagnation pressure loss coefficient versus impeller exit flow angle...143
Figure 6.6: Diffuser static pressure recovery coefficient versus impeller exit flow angle.. 146
Figure 6.7: Diffuser stagnation pressure loss coefficient versus impeller exit flow angle. 147 Figure 6.8: CFD calculated distributions of stagnation pressure loss coefficient (left) and entropy generation rate (right) at 100% Nc25 for baseline diffuser. ... 149
Figure 6.9: CFD calculated distributions of stagnation pressure loss coefficient (left) and entropy generation rate (right) at 100% Nc25 for truncated diffuser...150
Figure 6.10: CFD calculated distributions of stagnation pressure loss coefficient (left) and entropy generation rate (right) at 80% Nc25 for baseline diffuser. ... 151
Figure 6.11: CFD calculated distributions of stagnation pressure loss coefficient (left) and entropy generation rate (right) at 80% Nc25 for truncate diffuser...152
Figure 6.12: CFD calculated ID static pressure recovery coefficient throughout diffuser. 154 Figure 6.13: CFD calculated ID stagnation pressure loss coefficient throughout diffuser. ... 1 5 5 Figure 6.14: CFD calculated 1D aerodynamic mass blockage throughout diffuser...157
Figure 6.15: CFD calculated 1D shape factor throughout diffuser...158 Figure 6.16: Measurements of conical diffuser loss coefficients, defined as A= 1 - (Cp/Cp.),
versus inlet boundary layer momentum thickness, showing effects of area ratio and cone
Figure 6.17: Relative influence of nonideal effects on diffuser pressure rise versus impeller exit flow angle, based on CFD solutions...161 Figure 6.18: Relative influence of nonideal effects on diffuser pressure rise versus impeller exit flow angle, based on CFD solutions...163 Figure 6.19: Diffuser inlet pressure recovery coefficient versus impeller exit flow angle.. 167 Figure 6.20: Diffuser inlet stagnation pressure loss coefficient versus impeller exit flow a n gle . ... 16 8
Figure 6.21: Diffuser inlet static pressure recovery coefficient versus impeller exit flow a n gle . ... 17 0
Figure 6.22. Diffuser throat Mach number versus impeller exit flow angle...171 Figure 6.23: Diffuser mass blockage versus impeller exit flow angle...172 Figure 6.24: Relative influence of nonideal effects on diffuser inlet pressure rise versus impeller exit flow angle, based on CFD solutions. ... 174
Figure 6.25: Relative influence of nonideal effects on diffuser inlet pressure rise versus impeller exit flow angle, based on CFD solutions. ... 176
Figure 6.26: Flow nonuniformity at the impeller trailing edge plane from baseline diffuser
100E C F D sim ulation ... 178
Figure 6.27: Flow nonuniformity at the diffuser inlet, immediately downstream of the impeller-diffuser mixing plane from baseline diffuser 100E CFD simulation...178 Figure 6.28: Impeller exit blockage versus flow angle, based on CFD solutions...179 Figure 6.29: CFD calculated diffuser inlet stagnation pressure loss coefficient versus
impeller exit flow angle, showing effects of impeller exit nonuniformity and CFD mixing p lan e o n loss...18 0
Figure 6.30: CFD calculated diffuser inlet stagnation pressure loss coefficient beginning
downstream of mixing plan versus impeller exit flow angle...180 Figure 6.31: Illustration showing influence of diffuser inlet flow angle on 1D area ratio
(A 'r/A '27), path length (L(12)), and incidence (i). ... 182
Figure 6.32: CFD calculated diffuser inlet ID area ratio, path length, and cusp incidence versus im peller exit flow angle...182
Figure 6.33: Stagnation pressure loss coefficients downstream of mixing plane versus im peller exit flow an gle...183
Figure 6.34: Ideal uniform diffuser inlet pressure recovery coefficient versus impeller exit
flow angle, showing effect of com pressibility...185
Figure 6.35: Diffuser inlet stagnation pressure loss coefficient versus impeller exit flow angle, showing effect of com pressibility...187 Figure 6.36: Distribution of vorticity in diffuser passage direction at 100% Nc25 for baseline
d iffu ser...18 8
Figure 6.37: Distribution of vorticity in diffuser passage direction at 80% Nc25 for baseline
d iffu ser...18 9
Figure 6.38: Diffuser secondary flow structures...190 Figure 6.39: Vortex zones at low (80C) and high (100S') diffuser inlet flow angles for
baselin e diffu ser. ... 19 1
Figure 6.40: Normalized circulation around vortex regions versus impeller exit flow angle.
... 1 9 2
Figure 6.41: Streamlines and vortex lines through background vortex regions for baseline
diffuser 100E CFD sim ulation...195
Figure 6.42: Convection of circumferential fluid line through diffuser. ... 195
Figure 6.43: Streamlines and vortex lines through incidence vortex regions. ... 196
Figure 6.44: Formation of incidence vortices due to flow separation off diffuser cusps and introduction of boundary layer vorticity into main flow stream. ... 196
Figure 6.45: Effect of wall friction and impeller exit spanwise nonuniformity on throat secondary flow structures for baseline diffuser 100E CFD simulation. ... 198
Figure 6.46: Introduction of vorticity into main flowstream via separation...199 Figure 6.47: Diffuser passage performance versus impeller exit flow angle. ... 202 Figure 6.48: Diffuser passage pressure recovery coefficient versus impeller exit flow angle.
... 2 0 4
Figure 6.49: Diffuser exit flow angle versus impeller exit flow angle...206
Figure 6.50: Diffuser exit mass blockage versus impeller exit flow angle...206 Figure 6.51: Relative influence of nonideal effects on diffuser passage pressure rise versus impeller exit flow angle, based on CFD solutions. ... 208
Figure 6.52: Relative influence of nonideal effects on diffuser passage pressure rise versus impeller exit flow angle, based on CFD solutions. ... 209
Figure 6.53: Mixed out average stagnation pressure loss across diffuser trailing edge normalized by mixed out stagnation pressure loss between diffuser throat and exit versus im peller exit flow an gle...211
Figure 6.54: Diffuser passage static pressure recovery coefficient versus throat Mach number, showing effect of compressibility on pressure rise...212 Figure 6.55: Diffuser passage stagnation pressure loss coefficient versus throat Mach num ber, showing effect of com pressibility...212 Figure 6.56: CFD calculated distributions of stagnation pressure loss coefficient at 100%
N c25 for baseline diffuser...215
Figure 6.57: 3D effect of transverse velocity gradient, aw/Oz, on boundary layer growth ra te ... 2 1 6
Figure 6.58: Transverse velocity gradient in z-direction (OV2/az)...218 Figure 6.59: CFD calculated distributions of entropy generation rate at 100% NC25 for
baselin e diffu ser. ... 2 19
Figure 6.60: Velocity and velocity gradient fields associated with infinitesimal 2D vortex of stren gth f= a xdA ... 220
Figure 6.61: Representation of diffuser secondary flow field as superposition of vortex and im age vortex 2D velocity fields...221 Figure 6.62: Measured and estimated strength of transverse velocity gradient at diffuser m id plane versus im peller exit flow angle. ... 224
Figure 6.63: Definition of 100E boundary layer edge on baseline diffuser mid plane, showing relation with respect to diffuser geometry, stagnation pressure loss distribution, an d velocity profiles...226
Figure 6.64: Definition of 10OS' boundary layer edge on baseline diffuser mid plane, showing relation with respect to diffuser geometry, stagnation pressure loss distribution, and velocity profiles...227
Figure 6.65: CFD calculated boundary layer growth rates and vortex source terms versus throughiflow position for baseline diffuser...228 Figure 6.66: Boundary layer displacement thickness versus throughiflow position for baselin e diffu ser. ... 230
Figure 6.67: Boundary layer shape factor versus throughflow position for baseline diffuser.
Figure 6.68: Mass blockage based on potential core average properties versus throughflow position for baseline diffuser passage...233 Figure 6.69: Static pressure recovery coefficient versus throughflow position for baseline
d iffu ser...2 3 4
Figure 7.1: Illustration of diffusion system, impeller, and overall compressor pressure rise coefficients versus impeller exit flow coefficient, demonstrating combined effects of impeller
and diffusion system on overall compressor stability...250 Figure 8.1: Ideal uniform diffuser inlet pressure recovery coefficient versus impeller exit flow a n gle ... 2 5 4
Figure 8.2: Illustration showing influence of diffuser inlet flow angle on ID area ratio
(A 'r/A '27), path length (L(1 2)), and incidence (i). ... 254
Figure 8.3: Normalized circulation around vortex regions versus impeller exit flow angle.
... 2 5 6
Figure 8.4: Relationship between secondary flows, transverse velocity gradient, and accum ulation of high loss fluid. ... 257
Figure 8.5: 3D effect of transverse velocity gradient, aw/az, on boundary layer growth rate.
... 2 5 7
Figure 8.6: Boundary layer displacement thickness versus throughflow position for baselin e diffu ser. ... 258
Figure 8.7: Illustration of diffusion system, impeller, and overall compressor pressure rise coefficients versus impeller exit flow coefficient, demonstrating combined effects of impeller and diffusion system on overall compressor stability...260 Figure A. 1: Averaging of a nonuniform swirling flow in a radial vaneless diffuser...266 Figure A.2: Availability and mixed out average ID stagnation pressure loss coefficient throughout baseline diffuser at 100S'...267 Figure A.3: Example of flow field where mixed out average analysis yields nonphysical entropy reduction . ... 268
List of Tables
Table 2.1: Sets of ID flow properties utilized in this thesis...43 Table 2.2: Average sensitivities of calculated impeller exit conditions to measurements and
assumptions for baseline diffuser at 100E operating point...68 Table 2.3: Differences in experimental and CFD calculated stagnation pressure loss between impeller exit and near throat traverse for baseline diffuser. ... 69
Table 2.4: CFD m esh size and quality statistics. ... 80
Table 6.1: Scales for vortex and pressure gradient impacts on boundary layer growth rate, norm alized by baseline diffuser values...239
List of Symbols and Abbreviations
Roman
A cos a' A'(1 - Bm) C yR Y-1 P2P 1 Pti-Pi CP CPU f rVopVdA f hpVdA Bm Bp Ox OxArea of cut plane
1D area
Effective area
Vane or blade aspect ratio
Chord
Circumference or perimeter Choke operating point Skin friction coefficient Dissipation coefficient
Centerline of diffuser (y, z) = (0, 0)
Specific heat at constant pressure
Static pressure recovery coefficient (subscripts denote start and end stations)
Uniform flow ideal static pressure recovery coefficient (sub-scripts denote start and end stations)
Incompressible uniform flow ideal static pressure recovery coef-ficient (subscripts denote start and end stations)
Diameter
Effective diameter Effectiveness
Peak efficiency operating point Passage height between endwalls Specific enthalpy
Angular momentum flow rate Enthalpy flow rate
1D shape factor
Boundary layer shape factor (x-flux component)
Boundary layer kinetic energy shape factor (x-flux component)
Boundary layer density flux shape factor (x-flux component)
A A' Ae AR C C C Cf CD CL C CPU CPUO d de E E
h
h
Hi
H H Hx H* H;**i L M N Nv p Pref P r r R S S Sref S S'7 SA T Tref U f pVndA 101,325 Pa. f VpVdA 287 J/(kg-K) 0 J/(kg-K) 288.15 K rN Incidence
Length (subscripts denote start and end stations) Mass flow rate
Mach number
Impeller angular velocity
Number of contributing vortices Pressure
Reference pressure
Momentum flow rate (subscript denotes component)
Compressor radial coordinate; r = 0 at compressor rotation axis
Distance from vortex core Ideal gas constant
Streamline coordinate Specific entropy
Reference specific entropy Stall operating point Post-stall operating point Surface area
Temperature
Reference temperature
Velocity component along local boundary layer x coordinate Impeller wheel speed
Velocity component along local boundary layer y coordinate Velocity (subscripts denote component)
Volume
Velocity component along local boundary layer z coordinate Velocity in rotating reference frame (subscripts denote
compo-nent) Power
Local boundary layer coordinate along primary flow direction Compressor coordinate along diffuser passage throughflow
di-rection; x = 0 at diffuser throat
Compressor coordinate along diffuser passage throughflow
di-rection; x' = 0 at compressor rotation axis
Local boundary layer coordinate normal to wall
Compressor coordinate perpendicular to engine axis and
diffus-er passage throughflow direction; y = 0 at diffuser
center-line
Compressor coordinate perpendicular to engine axis and
diffus-er passage throughflow direction; y' = 0 at compressor
ro-tation axis
Local boundary layer coordinate in transverse direction
U V
V
V w W x x XI y y y' zCompressor coordinate along compressor rotation axis; z = 0 at diffuser mid plane or centerline, increasing from compres-sor inlet to exit
tan-1( ) Cos-tan-' (O 1.4 f wdA fYe 1 Pu dy Ye(1 -L)- udy P( e Ue y In(_[(1-2)) a
a'
Y 17,5x*
77 p(1-2) 0x
8zf
o*
f~
7T(1-2>) p T T(1-2) Y(1-2) y'(1-2) Pudy PWIdy (P~ldy I WIdy [(2we~ Tt2 Tti Vm 2 tan-' d2-2L(1-2)/ tan-'(K
CP(TM2 -Ttl) U27 Pt2 _PtI pTiU2Flow angle relative to meridional direction Flow angle relative to cut plane
Flow angle relative to meridional direction in rotating refer-ence frame
Reduced frequency Specific heat ratio Circulation
Boundary layer displacement thickness (x-flux component) Boundary layer density flux thickness (x-flux component) Polytropic efficiency (subscripts denote start and end stations) Circumferential position around compressor rotation axis Circumferential position around vortex core
Boundary layer momentum thickness (x-flux component) Boundary layer momentum thickness (z-flux component) Boundary layer kinetic energy thickness (x-flux component) Boundary layer kinetic energy thickness (z-flux component) Aspect ratio of diffuser passage cross-section
Dynamic viscosity
Total pressure ratio (subscripts denote start and end stations) Density
Solidity Torque
Total temperature ratio (subscripts denote start and end sta-tions)
Flow coefficient
Cone angle for conical diffuser
Flow angle between meridional and axial directions
Work coefficient (subscripts denote start and end stations) Pressure rise coefficient (subscripts denote start and end
sta-tions) z
Greek
e ( -e (1 -Vt Ye (i-)
'Ye
-
f2 2 h2 PtX Physical blade angle relative to meridional
O> Angular frequency
( 2 Ptl _Pt2 Stagnation pressure loss coefficient (subscripts denote start
Pti Pi
and end stations)
D Stagnation pressure loss coefficient estimate based on constant
dissipation coefficient (subscripts denote start and end sta-tions)
DO Incompressible stagnation pressure loss coefficient estimate
based on constant dissipation coefficient (subscripts denote start and end stations)
CDuO Incompressible uniform flow stagnation pressure loss
coeffi-cient estimate based on constant dissipation coefficoeffi-cient (subscripts denote start and end stations)
&j Vorticity (subscripts denote component)
Subscripts and Superscripts
* Reference value (average of 100E baseline diffuser
experi-mental measurements)
0
Incompressible
1D 1D calculated average
25 Compressor inlet station
26 Impeller leading edge station
27 Impeller trailing edge station
27m Impeller near trailing edge static pressure measurement
sta-tion
28 Diffuser leading edge station
29 Diffuser exit station (baseline diffuser trailing edge)
31 Deswirler exit station
A Availability average
D Dissipation
D Dump average
c Corrected to reference conditions
c Compressor, as in Apc
e Boundary layer edge position
i
Idealized calculation, as in Cp(12j)1 Inlet station (i.e. settling chamber)
L Laminar, as in laminar dynamic viscosity
m Vector component in meridional direction, defined by flow or
flowpath direction in z-r plane
m Mass, as in mass blockage
M Mixed out average at constant area
n Vector component normal to cut plane or control volume
P Momentum, as in momentum blockage
P Potential core average ref Reference value
t Stagnation or total state
t Blade tip
t, ti, t2 Vector component transverse to cut plane T Turbulent, as in turbulent dynamic viscosity T Diffuser throat station
Tm Diffuser near throat total pressure traverse measurement sta-tion
u Uniform flow
x, y, z, r, 6 Vector component along respective coordinate
Abbreviations
ID One-dimensional
2D Two-dimensional
3D Three-dimensional
Aft Aftward or hub side diffuser endwall AMB Active magnetic bearing
Base Baseline diffuser configuration
CFD Computational fluid dynamics
Exp Experimental
Fwd Forward or shroud side diffuser endwall HPC High pressure compressor
IGV Inlet guide vane
LE Leading edge
PS Pressure side of diffuser passage
PIV Particle Image Velocimetry
RANS Reynolds-Averaged Navier Stokes
SS Suction side of diffuser passage
Sta Station
TE Trailing edge
Trunc Truncated diffuser configuration
Chapter 1 Introduction
1.1 Background and Motivation
Centrifugal compressors differ from axial compressors in that they pump a working fluid through a significant radius increase between the inlet and exit of the rotating component. While the relatively large exit radius can sometimes be unmanageable for applications that must be compact or lightweight, the radius change allows the rotating impeller to take ad-vantage of the centrifugal force imparted on the fluid to generate a large static pressure rise for a given blade loading level. This is especially beneficial for situations where large clearance-to-blade height fractions are unavoidable. The radius increase also allows the impeller to utilize its high exit wheel speed to generate a large dynamic pressure rise with-out experiencing high inlet Mach numbers. Taking all of these considerations into account, centrifugal compressors can be better suited than axial compressors for low airflow applica-tions requiring high pressure rise and low part count or cost. Therefore, it is not surprising that centrifugal compressors are found in many such applications ranging from household vacuum cleaners to vehicle turbochargers to small aircraft engines. It is a
high-performance aerospace centrifugal compressor that is the focus of this research.
Downstream of the impeller in a centrifugal compressor is the diffusion system, a non-rotating component which converts the high dynamic pressure exiting the impeller into static pressure rise. There are a few common diffusion system design configurations which range from lower-cost vaneless diffusers with volutes or scrolls to high-efficiency vaned or pipe diffusers, sometimes followed by additional rows of vanes, typically found on aircraft engines. While the increase in flowpath radius throughout a centrifugal compressor inher-ently benefits the performance of the rotating impeller, the diffusion system does not rotate so it does not experience the same benefit. Conversely, there are a number of factors which actually increase the level of design challenge to the diffuser above that of an axial
com-pressor stator. At the inlet to the diffuser, the meridional direction of the flow is radial, and the Mach number and swirl angle can be high due to the high impeller exit wheel speed. However, in aircraft applications, the centrifugal stage is followed by a combustor requiring that the diffuser exit Mach number and swirl level be low and that the radial velocity ponent be zero or even slightly inward. This means that aircraft engine centrifugal com-pressor diffusers must both diffuse and turn the flow substantially.
With high-efficiency aircraft engines trending towards increased overall compressor pressure ratios and decreased core airflow for a given power level, centrifugal compressors have the potential to see even more widespread use in future aircraft engines. However, the physical relationships between centrifugal compressor geometry, the details of the re-sulting flow behavior, and ultimately the compressor's performance are not as well under-stood as they are for axial compressors, especially in the diffusion system. This makes the preliminary design of centrifugal compressors a challenging task, with reliance on empiri-cal models of limited applicability or on cumbersome 3D Computational Fluid Dynamics
(CFD) simulations not well-suited for preliminary design trade studies.
1.2 Experimental Compressor Stage Description
Centrifugal compressors are found in many high-pressure compressors (HPCs) designed and produced by GE Aviation for small turboshaft, turboprop, and turbofan engine applica-tions. Often, the centrifugal compressor is part of an axial-centrifugal HPC, that is, a sin-gle-spool compressor consisting of some number of axial stages followed by a single centrif-ugal stage. Beginning in 2000, GE Aviation supported a centrifcentrif-ugal compressor rig test program at RWTH Aachen University based on the centrifugal stage of a GE axial-centrifugal HPC design. The purpose of this test program was to assess the performance effects of various operating parameters and diffusion system configurations. It is this com-pressor that is used as the vehicle for the current research. Much of the experimental data and learnings that resulted from the RWTH Aachen test program are leveraged here as well.
The baseline compressor configuration studied for the RWTH Aachen test program is shown in Figure 1.1 and Figure 1.2. The impeller consists of a 46 blades alternating be-tween longer main blades and shorter splitter blades, it features 24.6 deg of backsweep, it has an inlet hub to trailing edge radius ratio of 0.43, and it operates at a design point
Reyn-olds number of 2.5x101 (based on standard day air properties, impeller tip width, and im-peller tip speed). The diffusion system for this compressor consists of two main compo-nents: the diffuser and the deswirler. The diffuser performs most of the diffusion system's pressure rise while removing some of the swirl from the impeller. It is made up of 30 pipe-type passages oriented radially and tangentially, and its leading edge radius is 3.4% great-er than the impellgreat-er trailing edge radius. Near the diffusgreat-er leading edge, the diffusgreat-er pas-sages are wider on the pressure side than they are on the suction side at a constant radial location. As a result, the intersection of adjacent diffuser passages creates leading edge cusps, which project along the endwalls into the vaneless space between the impeller trail-ing edge and the diffuser leadtrail-ing edge, as seen in Figure 1.4. Downstream of the diffuser, the deswirler contains a flowpath bend followed by a row of 90 vanes, which together turn the flow slightly inward from axial while performing additional diffusion.
During the test program, a number of diffuser and deswirler configurations were stud-ied. This research, however, specifically investigates the details of only two configurations utilizing the same impeller and deswirler but different diffusers-the baseline diffuser and a truncated diffuser, shown in Figure 1.3. As the name suggests, the truncated diffuser is the same as the baseline diffuser except that the diffuser trailing edge has been simply truncated, reducing its radius by 13% from 1.39 to 1.21 times the impeller trailing edge ra-dius. The endwall shapes are identical between the baseline and truncated diffusers.
Deswirler
Diffuser
Impeller
Bend Vane
Deswirler
TI ----4,-Exit'
Diffuser
LIE TEImpeller
TE LE, Splitter LE. Main BladeBlade 4
Inlet
--U
r y r
Figure 1.2: Side and front cutaway views of experimental centrifugal compressor with baseline diffuser. Bend Vane
Deswirler
Exit'
Diffuser TE-LEImpeller
TI LE, SplitterLE, Main Blade
Blde 4
Inlet
--r Y r
...--- . .. .-2 --- ----- -r -r -x,
Figure 1.3: Side and front cutaway views of experimental centrifugal compressor with truncated diffuser.
LE/
*
PS-Cusps
LE
Figure 1.4: Front and 3D cutaway views of diffuser inlet geometry featuring leading edge cusps.
1.3 Previous Work
As mentioned, significant work has been performed at RWTH Aachen University to gener-ate the experimental data leveraged in this research, most notably by Zachau et. al. and Kunte et. al. [1] [2] [3] [4]. Furthermore, a number of experimental observations were made in their research that inspired this research. Using high frequency pressure and Particle Image Velocimetry (PIV) measurements, the existence of a large pressure side flow separa-tion in the passage of the baseline diffuser was hypothesized by Zachau et. al. [1] [2]. This was confirmed in additional PIV and stagnation pressure traverse measurements as well as
CFD simulations conducted by Kunte et. al. [3]. It was for this reason that a truncated
dif-fuser was tested by Kunte et. al. The truncated difdif-fuser was shown to reduce the extent of
this separation and increase the operable range of the compressor at high speed [4]. Addi-tional experimentation and CFD simulations have also been performed on this compressor at RWTH Aachen University, investigating a wide range of diffusion system configurations and operating conditions not directly leveraged here. However, further work is necessary to fundamentally explain the causes of the measured performance characteristics, including how they vary with diffuser geometry and operating point.
Many other attempts have been made to characterize the performance of centrifugal compressors, and diffusers in particular. Experimentally derived diffuser performance maps, relating a diffuser's pressure rise capability to its most basic geometric parameters and operating conditions, were created in the 1960s by Cockrell and Markland [5], Reneau et. al. [6], and Sovran and Klomp [7]. In general, these demonstrated that for a given dif-fuser area ratio and inlet passage height, an optimal difdif-fuser length exists which maximiz-es is prmaximiz-essure recovery potential. Attempting too much diffusion in a short length rmaximiz-esults in a large exit blockage and reduced pressure rise. Conversely, large stagnation pressure losses are incurred due to wall friction if the diffuser is too long. These studies also charac-terized the effect of inlet mass blockage, which is shown to reduce the pressure recovery po-tential of a diffuser.
The claim that diffuser throat nonuniformity has a large impact on pressure rise is also made by Cumpsty in his book, where he cites the work of many other authors with the same observation [8]. However, for radial diffusers, there seems to be a disconnect between the diffuser inlet mass blockage and the diffuser throat mass blockage. In the experimental work of Filipenco and Everitt, the spanwise velocity profiles at the inlet to radial pipe and vaned diffusers respectively were varied with little effect on the diffuser pressure rise capa-bility, at least relative to other more important effects. Both hypothesize that the diffuser inlet nonuniformities are rapidly mixed out upstream of the throat, but also caution against the use of inlet mass blockage as a measure of nonuniformity as it lacks important infor-mation about the distribution of this nonuniformity [9] [10].
Cumpsty further claims that pipe diffusers can obtain greater pressure recoveries than vaned diffusers for a given level of inlet blockage, hypothesizing that the leading edge cusps play a role by inhibiting inlet secondary flows and thus reducing throat blockage [8]. Zachau et. al., Kunte et. al., and Wilkosz et. al. similarly propose that the leading edge cusps offer an advantage over vaned diffusers in this area, but with a different hypothesis. Their hypothesis is that the cusps actually generate vortices which enhance mixing, thus reducing the throat blockage or disconnecting it from the diffuser inlet blockage [2] [3] [11]. While the work of Kenny does suggest that pipe diffusers operate with lower throat block-age than vaned diffusers, and that greater pressure recoveries can be achieved in pipe dif-fusers even with the same throat blockage, clear evidence is not provided that link this ob-servation to the leading edge cusps or secondary flows [12] [13]. Furthermore, Wilkosz et.
al. found that the secondary flows in the diffuser passage cause high loss endwall flow to accumulate between them, actually reducing the mixing effectiveness downstream of the throat within the diffuser passage and contributing to the pressure side passage separation identified by Zachau et. al. and Kunte et. al. [11]. What is consistent in each of these hy-potheses is that flow nonuniformity is important to the performance of a diffuser, and that it can be affected by secondary flows via changes in mixing effectiveness.
Since the impeller and the diffuser tend to be closely coupled, another form of flow non-uniformity, unsteadiness, has also been a focus of prior research. In summarizing many of these studies, Cumpsty claims that unsteadiness generally has little effect on compressor performance. Again, this may partially be due to the rapid mixing that occurs in the diffus-er inlet. Howevdiffus-er, Cumpsty also posits that this is due to the fact that nonuniformities in impeller exit relative stagnation pressure are translated to flow angle nonuniformities in the absolute reference frame, while the unsteady variations in absolute stagnation pressure at the diffuser inlet are small [8]. In this way, the close coupling of the impeller and diffus-er may actually benefit impelldiffus-er wake recovdiffus-ery. The work by Shum confirms that the un-steadiness plays a small role in the diffuser on a time-averaged basis. The largest role of unsteadiness, Shum claims, is that the pressure field imposed by the diffuser can interfere with the impeller tip clearance flow. This modifies the impeller pressure rise and reduces efficiency through an increase in loss, a reduction in blockage, and a reduction in slip [14]. Everitt investigated the effects of unsteadiness by comparing diffuser performance meas-urements from a full compressor (high unsteadiness) with those from a swirl rig (low un-steadiness). Everitt saw a little influence of unsteadiness in the middle of the operating range, but he observed impacts close to choke and stall, including a change in the stall line. He hypothesized this is due to unsteady excursions into higher or lower flow angle regimes than experienced in steady operation, which impact the diffuser loss in a nonlinear manner
[10]. Wilkosz studied the effects of unsteadiness on the truncated diffuser configuration of
interest here, confirming Shum's claim that the largest impact of unsteadiness is on the impeller tip clearance flows. The overall pressure recovery of the diffuser was negligibly affected by unsteadiness, although this was due to an increase in the inlet pressure rise canceling a reduction in the passage pressure rise [15].
Filipenco and Everitt concluded from their research that, while the effects of inlet non-uniformity and unsteadiness are small, the performance of a diffuser correlates strongly
with the inlet flow angle. Filipenco defined his correlation using the impeller exit momen-tum averaged flow angle, defined based on the mass averaged tangential and meridional velocity components, and a pressure recovery coefficient calculated from an availability av-erage of impeller exit stagnation pressure. The two quantities were positively correlated for his pipe diffuser [9]. Everitt defined the correlation for his vaned diffuser using the mixed out average impeller exit flow angle and the diffuser effectiveness, defined as the ratio of actual and ideal pressure recovery coefficients. Everitt claimed that the effectiveness could correct for operating point variations in Mach number and ID area ratio. He found the ef-fectiveness to be insensitive to flow angle at high flow angles, but observed that it de-creased below a threshold flow angle. He hypothesized that this was due to incidence-related losses [10].
1.4 Research Objectives
This research aims to characterize the performance of a centrifugal compressor stage utiliz-ing a pipe diffuser, with a focus on the diffuser. Performance metrics of interest include the compressor's pressure rise capability and efficiency, both of which depend on the diffuser's pressure recovery coefficient, as well as the operable range of the compressor. Specifically, the following questions are addressed:
* What flow mechanisms drive the observed performance trends in the tested centrif-ugal compressor across a range of speeds and throttle levels? What are the implica-tions for other compressor designs?
* What are the differences in influential flow mechanisms between the baseline and
truncated diffuser configurations? Why is the stall line of the centrifugal compres-sor improved with the truncated diffuser? What are the implications for other com-pressor designs?
* What impact do diffuser leading edge cusps and secondary flows have on the
influ-ential flow mechanisms within the diffuser?
* How do the impacts of the various flow mechanisms scale with different compressor
geometries and operating conditions?
The intention is to move beyond simply recognizing performance trends, but to describe and quantify the causal relationships between these trends and the fundamental
perfor-mance limiting flow mechanisms. In this way, the insights gained here may be applied to a wide range of diffuser geometries and operating conditions.
1.5 Key Research Findings
This research succeeds in addressing the questions posed. This is accomplished by leverag-ing the RWTH Aachen University experimental compressor measurements, CFD simula-tions, and low-order flow models. This includes utilization of the following strategies, which are unique to this research:
" A framework is established for evaluating the diffusion system in terms of
interac-tions between subcomponents: the diffuser inlet, diffuser passage, and deswirler.
" A 2D integral boundary layer growth model is modified to include 3D secondary
flows effects as source terms.
Using these approaches, this research yields a number of significant findings. Perfor-mance variations between operating points are found to be primarily driven by changes in the impeller exit flow angle and secondarily by changes in impeller exit Mach number. The diffuser incidence angle greatly impacts the formation of secondary flows within the diffus-er passage, which are found to have a detrimental effect on the diffusdiffus-er pressure rise capa-bility. The origin and performance impact of these secondary flows are summarized as
fol-lows:
" Secondary flows are made up of a superposition of two types of counter-rotating
vor-tex pairs. "Background vortices" originate in the impeller exit nonuniformity and flow transition from impeller exit to diffuser inlet, while "incidence vortices" result from boundary layer separation off the diffuser leading edge cusps.
* Through accumulation of weak flow on the diffuser wall near the plane of symmetry
between the vortices, secondary flows reduce mixing effectiveness in the diffuser passage and contribute to the passage separation extent and location (pressure side near choke, suction side near stall).
" The impact of the secondary flows on boundary layer growth is found to scale
in-versely with the diffuser aspect ratio.
The baseline and truncated diffuser pressure recovery and loss magnitudes and trends are comparable, though the responsible flow mechanisms differ. This is explained by the following:
* The two diffuser configurations have similar effective area ratios, with the baseline diffuser having a larger exit blockage but lower exit flow angle than the truncated diffuser.
* The truncated diffuser experiences greater loss due to the thicker trailing edge, while the baseline diffuser experiences greater inefficiency due to wall friction and nonuniformity amplification.
The truncated diffuser improves the compressor's high-speed stall line relative to the baseline diffuser. Based on insights gained from the experimental and CFD results, the following hypothesis is developed to explain this observation:
* With the baseline diffuser, the compressor stalls when the diffuser separation switches from the pressure side (stabilizing) to the suction side (destabilizing).
" With the truncated diffuser, the compressor stalls due to a gradual reduction in
dif-fuser stability as suction side loss worsens. Instability is not immediately initiated when separation side switches for the truncated diffuser, since the separation extent is reduced relative to the baseline diffuser. Consequently, compressor stability is al-so dependent on the impeller pressure rise characteristics.
The fact that secondary flows have a large influence on diffuser pressure rise capability and compressor stability is counter to conventional preliminary diffuser design approaches which neglect such 3D effects. The findings of this research may therefore be considered during preliminary design optimization to produce better-performing diffuser designs.
1.6 Organization of Thesis
The process through which the research results and findings are determined from the ex-perimental data and supporting CFD computations are presented as follows. The research
approach will be described in Chapter 2, describing the use of experimental measurements,
CFD simulations, and reduced-order modeling. A modular perspective is taken to evaluate
the compressor and diffusion system, so the remainder of this thesis is organized as such which specific performance-limiting flow mechanisms discussed in the context of each mod-ule. The overall compressor performance characteristics are first presented in Chapter 3, and the utility of the CFD results are evaluated. Next, the impeller performance and exit conditions are shown in Chapter 4, and the mechanism contributing to the slope of the im-peller pressure rise characteristic is identified. After that, a discussion of diffuser flow
fun-damentals is presented in Chapter 5, and the overall diffusion system performance assess-ment is given in Chapter 6. Chapter 6 is further broken into a specific analysis of the per-formance and flow mechanisms in the diffuser inlet (Section 6.5) and the diffuser passage
(Section 6.6). Finally, the findings regarding the various flow mechanisms within each
component are synthesized in Chapter 7 in a discussion about the overall compressor stabil-ity. A summary that highlights the key results of this thesis is provided in Chapter 8. Fi-nally the conclusions are delineated in Chapter 9.
Chapter 2 Research Approach
To address the research questions posed, experimental data acquired on a research com-pressor stage is interrogated along with a set of well-designed CFD computations, comple-mented by reduced order flow modeling. The experimental data is primarily used to deter-mine high-level 1D performance results and trends and to assess where CFD may be used as a tool for detailed investigation. Where CFD and data are determined to follow the same trends, CFD is used to further understand the details of the flow mechanisms present at the 3D level. Additionally, measurements made from CFD results are used to guide anoth-er level of data reduction, allowing for a more useful intanoth-erpretation of the data. Lastly, low-order models are developed and utilized to quantify the importance of specific flow mecha-nisms observed in the CFD without confounding effects from other mechamecha-nisms, and to gain insight into the process by which these mechanisms influence performance.
2.1 Compressor Station Designations and Coordinate
Systems
Compressor station designations are chosen to be consistent with the industry practice for naming stations in an axial-centrifugal HPC. In this naming convention, the axial com-pressor is assigned stations 20-25, and the centrifugal comcom-pressor is assigned stations
26-31. These numbered stations are surfaces of revolution, which can be defined as lines in
the meridional plane. An additional station, T, is defined at the diffuser throat, oriented perpendicular to the diffuser passage. Figure 2.1 shows the locations of the centrifugal compressor test rig stations in more detail. Note that throughout this research, station 29 refers to the radial plane near the trailing edge of the baseline diffuser, such that trailing edge of the truncated diffuser is not at station 29.