HAL Id: hal-03026843
https://hal.archives-ouvertes.fr/hal-03026843
Submitted on 8 Jan 2021HAL is a multi-disciplinary open access archive for the deposit and dissemination of sci-entific research documents, whether they are pub-lished or not. The documents may come from teaching and research institutions in France or abroad, or from public or private research centers.
L’archive ouverte pluridisciplinaire HAL, est destinée au dépôt et à la diffusion de documents scientifiques de niveau recherche, publiés ou non, émanant des établissements d’enseignement et de recherche français ou étrangers, des laboratoires publics ou privés.
Modeling of Interdigital Electrodes Geometrical
Parameters Effects on Chemical Sensor Response
Khalid Dallah, A. Bellelli, O.C.Lezzar Lezzar, Salah Sahli, P. Raynaud
To cite this version:
Khalid Dallah, A. Bellelli, O.C.Lezzar Lezzar, Salah Sahli, P. Raynaud. Modeling of Interdigital Electrodes Geometrical Parameters Effects on Chemical Sensor Response. Key Engineering Materi-als, Trans Tech Publications, 2019, 826, pp.67 - 72. �10.4028/www.scientific.net/kem.826.67�. �hal-03026843�
Modeling of interdigital electrodes geometrical parameters
effects on chemical sensor response
K.Dallah1,A.Bellel1,O.C.Lezzar1,S.Sahli2,P. Raynaud3
1Laboratory of Electronic Materials for Medical Application, Faculty of Sciences and Technology, University of Constantine 1, Constantine 25000, Algeria
2Laboratory of Microsystems and Instrumentation, Faculty of sciences and technology, University of Constantine 1, Constantine 25000, Algeria
3Laboratory of Plasma and Conversion of Energy (LAPLACE), University Paul Sabatier 118 route de Narbonne, 31062 Toulouse cedex, France
E-mail: [email protected]
Abstract. The detection of volatile organic compounds (VOCs), humidity and toxic industrial chemicals is important for various environmental and industrial applications. The design of interdigital capacitor (IDCs) sensor is carried out in such a way that it would be suitable for microelectronic technology. The basic geometry of IDCs is defined by some parameters such as: number of electrodes N, electrode width W, electrode length L and the separation between electrodes G. The interactions between IDCs sensitive coating and analyte induced a change in the sensors capacitance due to the permittivity variation of the sensitive layer and to the change in polymer thickness (swelling). In this work, a fairly new approach of IDCs based sensor in terms of capacitance calculation has been presented. The results have been obtained from the modeling of the sensors geometry 2D and 3D using multi-physics simulation software COMSOL. The effect of some geometry parameters coupled with swelling measurements for polymeric films has been studied.
1. Introduction
Detection of volatile organic compounds (VOCs) becomes the world interest in the last few decades, owning to concerns about environmental protection, human health care, industrial processing and air
quality control [1]. Alcohols such as methanol and ethanol are volatile organic solvents that are used
in many workplaces and laboratories, medicine and food industry. High concentration exposure to
some VOCs over a short or long term may cause diseases or serious irreversible effect [2-3]. VOCs do
not only harm the human and survival health but also pollute the environment due to their contribution to stratospheric ozone depletion. The identification and monitoring of VOCs have become serious tasks in many countries of the world and are important for the early control of environmental pollution. The on-line monitoring and the in-situ analysis of gases represent one of the main objective
of current research in the sensor field. In this context, one widely investigated device is the interdigital
capacitors (IDCs). These structures have been used in many applications such as surface acoustic wave [4], humidity [5] and chemical [6] sensors. Typical IDCs sensors are made with two comb electrodes deposited on the top of an inert substrate with sensitive coating applied over the electrodes.
The transduction mechanism relies on the permittivity changes and swelling of the sensitive layer, to inflict a change in the sensor capacitance. To achieve high sensitivity from IDCs transducers in chemical detection, an accurate estimation of the electrical parameters (capacitance, impedance, electric field) as a function of the electrode geometrical parameters is crucial. In this work, the simulation of the interdigital capacitor structure has been carried out by COMSOL multiphysics software. The variation of the capacitance for a particular sensor configuration is a function of the materials dielectric permittivity, the ratio between the electrodes gap (the metallization ration), finger widths and the variation of the sensitive layer thickness. Our goal is to explain the effect of these parameters on the sensor sensitivity.
2.2. Numerical modelling of the sensor capacitance
In this section, a numerical simulation of the sensors capacitance as function of IDCs geometrical parameters by developing total capacitance equations has been investigated. The COMSOL Multiphysics software was used to simulate the model design of interdigital transducer in (2D) and (3D) dimensions. The software applications are based on partial differential equations (PDEs). The prediction of the IDCs capacitance is based on finite element analysis. The simulation results are very important to design an optimum sensor structure for better performance.
The value for electrostatic energy density We can be obtained from the simulation. The energy
required to charge a capacitor should equal to that of the electrostatic field, which is given by :
we= Q2
2C (1) We is available in the Electrostatics application mode; the software calculates it by integrating across
the domain.
we= D. E dΩΩ (2)
where D is the electric displacement, E is the electric field intensity and dΩ is the domain boundary. The capacitance C is related to the charge on the two conductive electrodes Q and the voltage difference across those electrodes ΔV is given by:
C = Q
Δv (3)
The calculation of C is carried out from the stored electric energy We and the voltage across the two electrodes ΔV: 𝐶 = 𝑄2 2𝑤𝑒𝐶 = 𝐶2𝛥𝑣2 2𝑤𝑒 (4) 𝐶 =2𝑤𝑒 𝛥𝑣2 (5)
3. Modeling of IDCS based sensor response
The sensor responses in terms of capacitance change after analyte sorption have been also simulated in this study. The sensor sensitivity is related to the change in the sensitive layer thickness (because of swelling) and to the change in the sensitive layer permittivity (changing the dielectric constant of the polymer). The swelling phenomenon is related to the amount of analyte molecules that diffuses into the polymer, changing its permittivity [9].
The new permittivity values have been calculated using the Clausius-Mossoti mixing rule [10] ℇmix−1 ℇmix+2= ℇa−1 ℇp+2 1 − ϕs + ℇa−1 ℇa+2ϕs (6) Where:
εp, εa and are the dielectric constants of polymer and analyte, respectively. εmix is the new permittivity value.Φs is the volume fraction of the analyte molecules in the polymeric film which is given by:
ϕs= Δh
h0+Δh (7)
Where h0 is the dry polymer film thickness and Δh= h – h0 is equal to the fraction volume change. In this work, the sensitive layers have been deposited on quartz crystal microbalance (QCM) substrates in order to measure fraction volume change in the polymer. The measured fraction volume change due to polymer swelling has been used in the sensor response simulation. In case of coated QCM, an increase of mass into the crystal electrode due to sorption of analyte molecules induces a shift in the resonance frequency (Δf) according to the well-known Sauerbrey equation [11]
Δf = − 2f02 pQμQ . Δm A = − 2f02 pQvQ . Δm A (8) Δm =Pp. A. h (9) h =2fvQ.Δf 0 2P p (10)
Where f0 is the resonant frequency, A is the active electrode area, pQ is the density of the quartz
crystal, µQ is the shear modulus and vQ is the shear wave velocity of the quartz crystal, Pp is the density
of polymer, h is the polymer film thickness, Δf is the frequency change and Δm is the change in mass
per unit area. From this equation we may calculate the change in polymer thickness and the volume
fraction in the polymer according to equation (7). 4. Results and discussion
4.1. Effect of the coating layer thickness on the sensor capacitance
The effect of coating layer thickness on the IDCs structure capacitance has been studied using COMSOL Multiphysics. The simulation results shown in fig.1 indicated that the value of IDCs capacitance increases with increasing sensitive layer thickness then reaches a steady state. For layer thickness lower than about 200 nm, the capacitance increases significantly than slowly. Beyond the thickness of about 330 nm, electric field distribution in the sensitive layer decreases with increasing layer thickness and the sensor capacity did not change much further. From this observation, we may conclude that the IDCs-based sensor is not sensitive to layer thickness greater than half of its wavelength.
4.2. Effect of the metallization ratio on the sensor capacity
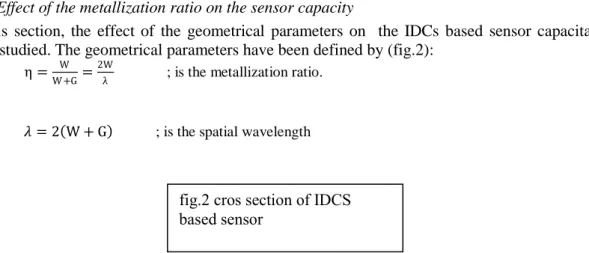
In this section, the effect of the geometrical parameters on the IDCs based sensor capacitance has been studied. The geometrical parameters have been defined by (fig.2):
η = W
W +G= 2W
λ ; is the metallization ratio.
𝜆 = 2 W + G ; is the spatial wavelength
Fig.3 shows the variation of the IDCs structure capacity with the metallization ratio. As expected, the sensor capacity increases with decreasing the inter electrode distance. High values of IDCs capacitance are obtained for the metallization ratio greater than 250µm.
Figure 3. capacitance as a function of the metallization ratio 4.3. Simulation of the IDCs-based sensor response
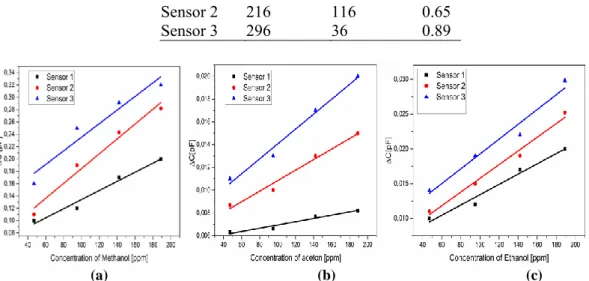
The response in terms of capacity variation of the studied sensor towards different concentrations of analyte ranging from 47 to 189 ppm has been simulated. The simulation analysis has been carried out on three different IDCs-based sensors having different geometrical parameters. The electrode width and the separation between electrodes values are summarized in table 1. The results shown in Fig.5 indicate that the sensors responses increase with increasing analyte concentration. The sensors responses exhibited a satisfactory linear relationship with the variation of analyte concentration. Furthermore, the simulation results shown in fig.3 indicates that the sensitivity of the IDCs-based sensor increase with increasing metallization ratio. The sensor with the metallization ratio of about 0.89 showed the highest sensitivity.
Table 1. Geometrical parameters of the studied sensors
Sensors W(um) G( um) η Sensor 1 46 276 0.14
fig.2 cros section of IDCS based sensor
Sensor 2 Sensor 3 216 296 116 0.65 36 0.89 (a) (b) (c) Figure 5. Sensors Responses as a function of : (a) Methanol , (b) Acetone, and (c)Ethanol concentration
5. Conclusion
The sensor responses toward (VOCs) molecules have been simulated with varying VOCs concentration in the ppm level. The calibrating curves exhibited fairly linear relationship. The simulation model for the IDCs capacitance has been proposed using the software COMSOL Multiphysics and measured volume fraction. The strong dependence of the capacitive response with the geometrical parameters of interdigital capacitive sensors has been studied in this work.
Acknowledgments
This work is supported by the Algerian Thematic Agency of Research in Sciences and Technology
(ATRST).
References
[1] Wen-Tien Tsai , “Toxic Volatile Organic Compounds (VOCs) in the Atmospheric Environment: Regulatory Aspects and Monitoring in Japan and Korea”,environments, Vol.3 (2016)
[2] Jian Zhou, Yan You, Zhipeng Bai*, Yandi Hu, Jiefeng Zhang, Nan Zhang, “Health risk assessment of personal inhalation exposure to volatile organiccompounds in Tianjin, China”, Science of the Total Environmen.Vol 409(2011) pp. 452–459.
[3] Sait C. Sofuoglu ,Guler Aslan , FikretInal , AysunSofuoglu “An assessment of indoor air concentrations and health risks of volatile organic compounds in three primary schools”, International Journal of Hygiene and Environmental HealthVol 214(2011) pp. 36–46
[4] Wei “Distributed capacitance of planar electrodes in optic and acoustic surface wave devices”, IEEE J. Quantum Electron. Vol 13 (1977) pp. 152–158
[5] H.D. Wu, Z. Zhang, F. Barnes, C.M. Jackson, A. Kain, J.D. Cuchiaro., “Voltage tunable capacitors using high temperature superconductors and ferroelectrics”, IEEE Trans. Appl. Supercond Vol 4 (1994) pp. 156–160.
[6] G.D. Alley., (1970) “Interdigital capacitors and their application to lumped-element microwave integrated circuits “, IEEE Trans. Microwave Theory Tech Vol 18(1970) pp. 1028–1033.
[7] Noubeil Guermat, Azzedine Bellel, Salah Sahli, Yvan Segui. Patrice Raynaud,“Plasma Polymerization of Hexamethyldisiloxane and Tetraethoxysilane Thin Films for Humidity Sensing Application “, Defect and Diffusion Forum Vol 354 (2014) pp. 41–74
[8] Marco Righettoni, Antonio Tricoli, and Sotiris E. Pratsinis, “Si:WO3 Sensors for Highly Selective Detection of Acetone for Easy Diagnosis of Diabetes by Breath Analysis”, Anal. Chem., Vol 82(2010) pp. 3581–3587.
[9] Rui Igreja, C.J. Dias “Dielectric response of interdigital chemocapacitors: The role of the sensitive layer thickness”, Sensors and Actuators , Vol. B 115 (2006) pp. 69–78.
[10] P. Oikonomou , A. Botsialas , K. Manoli , D. Goustouridis , E. Valamontes , M. Sanopoulou , I. Raptis , G.P. Patsis ,”Chemocapacitor performance modeling by means of polymer swelling optical measurements”, Sensors and Actuators Vol. B171-172 (2012) pp. 409–415.
[11] G.SAUERBREY.“Verwendung von SchwingquarzenzurWaigungdunnerSchichten und zurMikrowaigung”, ZeitschriftfiirPhysik., Vol 155(1959) pp. 206–222.