Publisher’s version / Version de l'éditeur: Energy & Fuels, 17, May 3, pp. 714-724, 2003-05-01
READ THESE TERMS AND CONDITIONS CAREFULLY BEFORE USING THIS WEBSITE.
https://nrc-publications.canada.ca/eng/copyright
Vous avez des questions? Nous pouvons vous aider. Pour communiquer directement avec un auteur, consultez la première page de la revue dans laquelle son article a été publié afin de trouver ses coordonnées. Si vous n’arrivez pas à les repérer, communiquez avec nous à PublicationsArchive-ArchivesPublications@nrc-cnrc.gc.ca.
Questions? Contact the NRC Publications Archive team at
PublicationsArchive-ArchivesPublications@nrc-cnrc.gc.ca. If you wish to email the authors directly, please see the first page of the publication for their contact information.
NRC Publications Archive
Archives des publications du CNRC
This publication could be one of several versions: author’s original, accepted manuscript or the publisher’s version. / La version de cette publication peut être l’une des suivantes : la version prépublication de l’auteur, la version acceptée du manuscrit ou la version de l’éditeur.
For the publisher’s version, please access the DOI link below./ Pour consulter la version de l’éditeur, utilisez le lien DOI ci-dessous.
https://doi.org/10.1021/ef0202687
Access and use of this website and the material on it are subject to the Terms and Conditions set forth at Thermodynamics, phase diagrams, and stability of bitumen-polymer blends
Masson, J-F.; Collins, P.; Robertson, G.; Woods, J. R.; Margeson, J. C.
https://publications-cnrc.canada.ca/fra/droits
L’accès à ce site Web et l’utilisation de son contenu sont assujettis aux conditions présentées dans le site
LISEZ CES CONDITIONS ATTENTIVEMENT AVANT D’UTILISER CE SITE WEB.
NRC Publications Record / Notice d'Archives des publications de CNRC:
https://nrc-publications.canada.ca/eng/view/object/?id=0b6ab9b3-7783-4229-8d67-4242729110f3 https://publications-cnrc.canada.ca/fra/voir/objet/?id=0b6ab9b3-7783-4229-8d67-4242729110f3
Thermodynamic, phase diagrams, and stability of bitumen-polymer blends
Masson, J-F.; Collins, P.; Robertson, G.; Woods, J.R.; Margeson, J.
NRCC-46409
A version of this document is published in / Une version de ce document se trouve dans : Energy & Fuels, v. 17, 2003, pp. 714-724
Thermodynamics, phase diagrams, and stability of bitumen-polymer blends
J-F. Masson* 1, P. Collins1, G. Robertson2, J. R. Woods2, J. Margeson1
1
Institute for Research in Construction
2
Institute for Chemical Process and Environmental Technology National Research Council of Canada,
Ottawa, Ontario, Canada, K1A 0R6 *(613) 993-2144; fax (613) 952-8102
jean-francois.masson@nrc.gc.ca
Abstract
Infrared spectroscopy was used to measure the stability, segregation rates and equilibrium concentrations of blends with bitumen and styrene-butadiene (SB)-type copolymers stored at 100-180°C. The effects of SB concentration, molecular weight, S/B ratio, branching, and bitumen source were investigated. The results were analyzed in light of established mechanisms for phase segregation, blend thermodynamics, and phase diagrams for binary mixtures. It is shown that the phase diagram for bitumen-SB blends is tri-dimensional and that it contains a lower critical solution temperature (LCST) that decreases in temperature with an increase in polymer content or molecular weight. Equilibrium blend stability is governed by the entropy and enthalpy of mixing, i.e., molecular weights and intermolecular interactions. The rate of segregation, if any, is affected by the molecular shape of the blend components and their molecular weights. It is also found that SBS branching does not to affect blend stability and that the morphology of incompatible blends likely results from spinodal decomposition. Hildebrand solubility coefficients provide inaccurate predictions of interactions between bitumen and SBS, but infrared frequency shifts do reveal the nature and strength of the intermolecular interactions. The colloidal instability index, the aromatics content and the asphaltenes contents in bitumen lead to discordant stability predictions for bitumen-SBS
blends. This study provides a theoretical framework for understanding the complex interrelationship of the various parameters that affect the stability of bitumen-polymer blends in general.
Introduction
Bitumen is used primarily in roadway and roofing applications.1 With demands for increased performance, bitumen is often blended with a polymer. Bitumen-polymer blends can have greater resistance to cracking in cold temperatures, and lower flow and deformation in hot temperatures than bitumen alone.2 To impart desirable properties to a blend, bitumen and polymer must be compatible. Compatibility can be assessed by optical microscopy, and mechanical or rheological testing.3,4 However, compatibility is most often defined by the extent of segregation of the bitumen and polymer during hot-storage at 140-180°C for 4h to 1 week.2,3,5,6
Blends of bitumen with styrene-butadiene (SB)-type copolymers have received the greatest attention amongst bitumen-polymer blends because of their industrial importance. Bitumen is a complex blend of oligomeric hydrocarbons7 of natural origin conveniently fractionated into maltenes and asphaltenes.8 The asphaltenes are the heaviest bitumen components, whereas the maltenes are mixtures of compounds known as saturates, aromatics, and resins. The copolymers are commonly identified as SBS or SB, although they are truly (SB)n-x diblocks where n is the functionality of the branch
point x. 9,10 When n is 2, 3 and 4, the copolymer is respectively, linear, branched, and star-shaped. Here SB is used in the generic sense to identify any of these copolymers,
SBS refers to the linear structure, and PS and PB to the respective polystyrene and polybutadiene blocks. Given the complexity of bitumen and the choice in SB characteristics, the selection of a compatible bitumen-SB pair is difficult.
In 1980, Kraus and Rollman3 indicated that the S/B ratio, the SB molecular weight and concentration, and the asphaltenes content in bitumen affected the mechanical, rheological and morphological properties of bitumen-SB blends. It was concluded that blends were bi-phasic, with a bitumen phase rich in asphaltenes, and an SB phase rich in maltenes and unswollen PS. In 1983, Brion and Brûlé4 provided a detailed analysis of the phase composition in the blends and concluded that SB is swollen with saturates and aromatics. The significance and thoroughness of these two studies is not well recognized, undoubtedly because they were not published in English. Kraus also published a shorter paper,11 in which he showed that SBS is compatible with bitumen of high aromatics content and incompatible with a highly paraffinic bitumen. Based on such work, it is customary to select bitumen with high aromatics content in an effort to obtain a compatible and stable mixture with SB. Wloczysiak et al.12 showed that bitumens with 70-80 wt % aromatics not only caused PS to swell, but also caused anti-plasticization of PS, i.e., an increase in its glass transition temperature. From blends with bitumens that contained 50-65 wt % aromatics, Lu et al.13 concluded that linear SB provided greater blend stability than branched SB and later suggested14 that bitumen-SB blends segregate during hot-storage because of gravitation.
In this paper, it is shown that Fourier transform infrared spectroscopy (FTIR) can provide a quantitative assessment of stability in bitumen-SB blends. This stability is related to the phase diagram of the blends and the (in)compatibility is explained by thermodymanics. The effect of the copolymer content, S/B ratio, molecular weight, and branching, and that of bitumen composition is investigated and explained by their contribution to entropy or enthalpy. It is shown that the thermodynamics of blends provides a general theoretical framework for understanding the complex interrelationship of the various parameters that affect the stability of bitumen-polymer blends.
Thermodynamics background
The phase behavior of a binary blend is reflected in its phase diagram.15-17 In totally miscible binary blends, the phase diagram is a continuous 1-phase region (Figure 1a). In blends that segregate, the composition of the phases depends on the spinodal and the temperature; the spinodal being the border between the 1- and 2-phase regions (Figure 1b-e). Some blends segregate upon heating and have a lower critical solution temperature (LCST, Figure 1b), whereas blends that segregate upon cooling show an upper critical solution temperature (UCST, Figure 1c). Some blends have both a UCST and an LCST (Figures 1d and 1e). When segregation occurs at Ti, the equilibrium
composition of the segregated phases, φa and φb, is defined by the spinodal (Figure 1f).
The stability of a blend, as assessed by its phase diagram, is governed by thermodynamics. For a blend to be stable, the change in Gibbs energy upon mixing (∆Gmix) must be lower than zero :15-17
∆Gmix = ∆Hmix− T∆Smix < 0 (eq. 1)
where ∆H is the change in enthalpy and ∆S is the change in combinatorial entropy that occurs upon mixing. When the blend components have an attractive interaction, heat is released and ∆H is negative, which favors mixing. The blending of low molecular weight compounds produce a larger change in ∆S and contributes more to the Gibbs energy than the blending of high molecular weight materials. At the spinodal, ∂2∆Gmix /∂φa 2 = 0 so
that a sufficient and necessary condition for stability is ∂2∆Gmix /∂φa 2 > 0. According to
the Flory-Huggins formalism15-17 for binary mixtures, ∆H and ∆S can be written :
∆H = kTχ12NV1V2 (eq. 2)
∆S = −k[n1 lnV1+ n2 lnV2] (eq. 3)
where k is the Boltzman constant, T is the temperature, χ12 is a parameter for the interaction between components 1 and 2, Vi is the molar volume of component i, ni the
number of moles of that component and N the total number of moles.
On this basis, it is expected that for blends of bitumen with polymers, the molecular weights of both bitumen and polymer will affect ∆S, but given that Vi increases with
molecular weight, the polymer will have a dominant effect. Similarly, a change in bitumen or polymer composition will affect intermolecular interactions between the pair, and thus ∆H.
Experimental Section
Table 1. The bitumens were obtained from the Strategic Highway Research Program (ABA, a blown bitumen), and Petro-Canada (PC, an 85/100 penetration grade bitumen). The bitumen characteristics are shown in Table 2. Component analysis was obtained by thin-layer chromatography/flame ionization detection (TLC/FID) after 1h in trichloroethylene, as described in detail elsewhere18 Polystyrene-equivalent molecular weights were obtained with a Waters gel permeation chromatograph equipped with 4 Styragel columns (HR-1, -3, -4, -5) and a refractive index detector. Reported values are those for a 2% (w/v) solutions in tetrahydrofuran prepared 1h before injection. Elemental analysis on bitumen was performed on a Leco CHNOS analyzer model 932 equipped with a VTF-900 furnace for oxygen analysis. Calibration was done with EDTA. The analysis of inorganics in bitumen was done on a Cambridge Stereoscan 250 scanning electron microscope equipped with an Oxford Link energy dispersive spectrometre attachment.
The signal integration values from carbon and hydrogen nuclear magnetic resonance (NMR) spectra were used to calculate the percent aromatic carbon and hydrogen of bitumen. Spectra were recorded on a Varian Unity Inova NMR spectrometer at a resonance frequency of 399.961 MHz for 1H and 100.579 MHz for 13C. Quantitative carbon spectra were obtained using a 10 mm broadband probe with acquisition time and relaxation delay set to 5 and 15 seconds respectively; hydrogen frequencies were fully decoupled only during the acquisition time. The samples for 13C NMR were prepared by dissolving 150-200 mg of bitumen in 3 ml of deuterated chloroform (CDCl3). The CDCl3
Blends. Blends were prepared with 3, 6 or 10% copolymer by weight of bitumen by the
slow addition of SB to about 400g of bitumen held at 165°C. The SB was dispersed in 30 min with a Silverson L4RT high shear mixer operated at 5200 rpm. After mixing, the blends were cooled to room temperature. For the stability tests, the blends were heated in an oven under a nitrogen blanket. Samples were collected at a depth of 0 to 5 mm from the surface after storage at 100-180°C.
FTIR. SB content at the sample surface was determined by FTIR as described earlier.19
Reported values are the average of 5 measurements.
Fluorescence microscopy. SB-bitumen dispersions were viewed with a light
microscope equipped with quartz optics and a mercury lamp that produced high intensity light. Filters limited the light to UV wavelengths (300-400 nm). On top of the microscope was a low-light, high-sensitivity, color CCD camera (Dage-MTI Inc., model DC330E). Lens magnification was 50x.
Results and Discussion
To assess stability, the concentration of SB at the surface of a blend was determined from the individual PS- and PB-block concentrations as measured by FTIR after blends were stored 0-24h at 165°C. PS and PB have absorbances in the IR spectrum well separated from those of bitumen.19 Any increase in SB concentration at the blend surface is readily observed as an increase in the absorbances at 699 and 966 cm-1 for the respective PS and
PB block (Figure 2). In all blends, the percent change in PS and PB was identical, which indicated that PB did not oxidize during hot storage and that PS did not depolymerize.19
Effect of copolymer content on blend stability. Bitumen ABA was blended with 3, 6
and 10% of L1, a linear SBS. With 3% L1 in the blend, the copolymer was finely dispersed in the bitumen-rich matrix (Figure 3). With 6% L1, both phases were continuous, and with 10% L1, bitumen particles were finely dispersed in a SBS-rich phase. The effect of hot storage on copolymer concentration at the blend surface is shown in Figure 4, where for improved clarity the change in PS is plotted, but the identical trend for PB is omitted. There was no segregation in the blends with 3% L1, but there was significant segregation in the blends with 6 and 10% L1. At equilibrium, the copolymer at the surface of the segregated blend had about twice the original concentration.
The phase diagram for bitumen-SBS blends is unknown, but the results in Figure 4 indicate that at 165 °C the blend of ABA with 3% L1 lies in a stable (1-phase) region, whereas the 6 and 10 % blends lie in a 2-phase region (Figure 1). The existence of a UCST or a LCST was determined by storing the blends between 100 and 180 °C (Figure 5). The blend with 10% SBS did not segregate at 100°C, but it did segregate at higher temperatures. Segregation rate increased with temperature, so that equilibrium was reached in 24h at 140 and 160 °C, but not at 120°C. The same trend was observed for the blends with 6% SBS, but equilibrium was reached at 120°C. Blends with 3% SBS remained stable at all temperatures between 100 and 180°C. Hence, blends can be stable
in low temperatures, but they can segregate when the temperature is raised. This demonstrates that the phase diagram for bitumen-SBS blends is of the type shown in Figure 1b. The LCST and the position of the line of equilibrium composition (the spinodal) remain undetermined.
In binary mixtures, the equilibrium compositions of segregating phases is governed by the temperature and the spinodal. It is expected that during hot storage all compositions that fall within the 2-phase region would slowly segregate into phases of composition φa
and φb (Figure 1f). The blends of bitumen with L1 do not follow this behavior, as blends
with 6 and 10% copolymer do not segregate into phases of identical compositions when exposed to the same temperature. Hence, the behavior of bitumen-L1 blends is not totally consistent with that expected from binary mixtures. The lower segregation in the blends with 6% L1 indicates an apparent translation of the spinodal on the temperature axis (Figure 6), which affects the equilibrium concentrations.
Figure 4 shows that segregation is rate dependent and asymptotic. It was complete in about 3 and 7h in blends with 6 and 10% L1, respectively. This relatively slow segregation rate suggests that diffusion governs the time to equilibrium. Diffusion can be expressed as20
D = kT/6πηr (eq. 4)
where kT is the kinetic energy, η the viscosity of the continuous phase, and r the radius of the dispersed phase. Figure 4 shows a decreased segregation rate with increased polymer concentration C in accordance with the effect of concentration on viscosity21
η = ηo [1+aC1+bC2+cC3…] (eq. 5)
and where a, b, and c are constants and ηo the bitumen viscosity without polymer.
The movement of non-interacting solid particles of radius r suspended in a liquid is governed by Brownian motion and the distribution of the particles is affected by gravitation.22 In contrast, the segregation or distribution of the phases in blends with
interacting components can proceed by two mechanisms, nucleation and growth (NG) or
spinodal decomposition (SD).15-17 Segregation by NG starts from small nuclei that grow in size, a nucleus being defined by an area with a large change in structure or composition. NG typically occurs upon cooling below the UCST, whereas SD can occur continuously and spontaneously based on diffusion, due to small amplitude fluctuations of composition.15-17 SD is followed by coarsening and coalescence,23 which incidentally is best studied with blends having a very fine dispersion and a polymer content below 1%.24 Figure 7 illustrates the morphological difference between NG and SD.
The morphology of segregated bitumen-SBS blends,3 the fluctuation in composition in unsegregated blends (Fig. 3) and the diffusion dependent segregation (Fig. 4), indicate that this segregation is likely the result of SD. Moreover, the good miscibility of PS and PB blocks above 100-110°C25 make the PS-block/PB-block junction an unlikely locus for NG. Segregation by NG may be more typical of bitumen blends with semi-crystalline polymers, e.g. polyethylene, where crystal nuclei can grow upon cooling. As a result,
these blends may have an upper critical solution temperature (UCST) with or without an LCST (Figures 1e and 1c, respectively).
Effect of copolymer molecular weight on blend stability. The effect of molecular
weight on blend stability was investigated by mixing ABA with linear SBS copolymers L1 and L3. In blends with 3% SBS, the higher molecular weight L3 segregated slowly, whereas L1 did not segregate. In blends with 6 % SBS, both L1 and L3 segregated from bitumen, but segregation was slower and more extensive with L3 (Figure 8).
An increase in molecular weight (or molar volume) decreases entropy (eq. 3) and blend stability (eq. 1). In this respect, the results for blends with 6% L1 or L3 (Fig. 8) follow the behavior of polymer-polymer26 or polymer-diluent27 mixtures that contain polymers of increasing molecular weights (Fig. 9). The increase in molecular weight lowers the LCST so that at 165°C, the 2-phase region is wider for L3 than for L1. With 3% polymer, the blend with L1 is in the single-phase region, but with the lowering of the LCST that comes with the increase in molecular weight, the blend with L3 falls within the 2-phase region of the phase diagram and, consequently, segregates.
The behavior of the blend with 6% SBS indicates that an increase in SBS molecular weight reduces the rate of segregation. The effect is close to that of concentration and consistent with the effect of molecular weight M on viscosity28 (eq. 6, where a and k are constants), and the fact that polymers are not incompressible spheres of fixed radius r, but permeable polymeric coils whose mean square radius of gyration 〈s2〉 depends on the
degree of polymerization n, and chain branching, repeat unit stiffness and solvent interactions,29 as characterized by constant ν in eq. 7. Until values for the various constants in equations 6 and 7 are known, applications of eq. 4 to non-ideal dispersions, including bitumen-polymer blends, will remain qualitative, as for colloids.20
η = kMa (eq. 6)
〈s2〉 ∝
n 2ν (eq. 7)
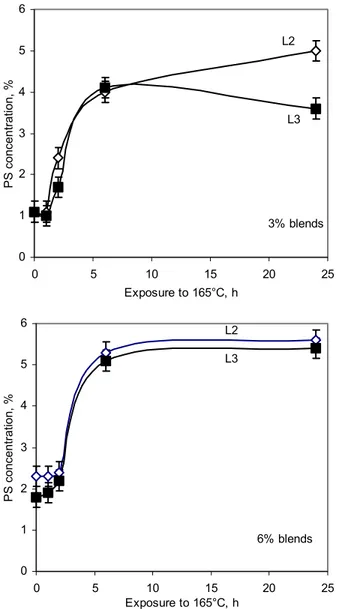
Effect of S/B ratio on blend stability. The effect of S/B ratio on blend stability was
investigated by mixing ABA with linear SBS copolymers L2 and L3, whose respective S/B ratios were 33/67 and 30/70. The ratio made little difference in blends with 6% SBS, which segregated at the same rate and to the same extent, but it made a difference in blends with 3% SBS (Figure 10). These blends showed the same segregation rate, as expected because of matching molecular weights, but different equilibrium SBS concentrations. The greater PB content of L3 reduced the extent of segregation.
The relative stability of the blend with 3% L3 arises from a favourable ∆H, i.e., attractive interactions (eq. 2). The strength of these interactions, assessed by the interaction parameter χ12 is unknown, but it is often approximated by the differences in solubility between interacting components of a blend:15-17
with δibeing the Hildebrand solubility parameter for the components. Based on this
equation, the closer the solubility parameters of the blended components, the greater their interaction. According to Figure 11, which shows the solubility parameters for the various bitumen and SBS fractions,30 it is the aromatics and saturates in bitumen that interact with SBS, in accordance with earlier findings.4 Figure 11 also shows that interactions with PS should be favored over those with PB, in contrast to the results in Figure 10 and the findings of Kraus and Rollman3 who found that PS was not swollen by bitumen. Thus the approach based on Hildebrand solubility parameters to gauge blend compatibility, and stability, has its limits. A better understanding of the interactions between bitumen and the PB and PS blocks can be obtained by FTIR.
Figure 12 shows the shift in PS and PB infrared absorbances due to blending of SBS with bitumen. A shift in absorbance, even a very small one, is a sign of interaction.31 As the SBS content decreases, the shift increases, which indicates increased interactions in accord with the greater stability of the blends with 3% SBS (Figures 4 and 10). The maximum shift observed for PS is 0.11 cm-1, and 0.35 cm-1 for PB, which indicates that PB interacts more strongly with bitumen than PS. This is consistent with the greater stability of L3 over L2 (Figure 10), and again highlights the limits of the approach based on eq. 8 to assess compatibility.
Upon blending SBS with bitumen, the PS and PB absorbances at 699 and 966 cm-1 are respectively shifted to higher and lower frequencies (Figure 12). These different shift directions indicate that the nature of the PB-bitumen interactions is different from the
PS-bitumen interactions. The PB absorbance at 966 cm-1 arises from the out-of-plane wagging of the C−H group of a trans-substituted double bond.32 Given that electronegative substituants on a double bond cause a shift to lower frequencies,32 the shift in the PB absorbance indicates that it is caused by a decrease in the π-electron density around the double bond. In other words, the shift may be caused by the interaction of the PB π-electrons with positively charged atoms or functions in bitumen, the most likely candidates being metallic groups and acidic protons. The possibility of weak π/CH interactions must also be considered given its ubiquity and the importance it plays in many systems.33 In contrast, the PS absorbance at 699 cm-1 arises from the C−H bending of the aromatic ring.32 As bending frequencies increase upon hydrogen bonding,34 the increase in PS frequency upon blending with bitumen must arise from weak hydrogen-bonding type of interactions between Ar−H groups and electron-rich species in bitumen (e.g. nitrogen, oxygen, sulfur, halogens).
Effect of copolymer structure on blend stability. The stability of bitumen blends with
S1, a star-shaped SB copolymer, was investigated and compared to that for L3, a linear SBS. Both had large molecular weights, but S1 had the largest (Table 1). In blends with 3% S1, there was a slow and moderate segregation (Figure 13). In blends with 6% copolymer, S1 segregated more slowly than L3. In both blends, segregation was less extensive with S1 than with L3.
Based on the entropic effect of molecular weight, S1 was expected to segregate more than L3, but Figure 13 shows the reverse because of the higher PB content of S1 over L3
(Table 1). Figure 14 shows the linear relationship between the PB content in SBS and the equilibrium SB concentration in various blends. It is clear from this relationship that branching has little effect, if any, on blend stability although it may effect segregation rate and blend rheology. Such an effect would be determined after comparison of SB copolymers with different molecular architecture and identical S/B ratios and molecular weights, which could not be obtained.
The negligible effect of branching, as gathered from Figure 14, is contrary to the earlier conclusion13,14 that branched SBS produced blends less stable than those with linear SBS. The studies were undertaken without an equal basis for comparison, as the copolymer S/B ratios were close, but the branched SBS had a molecular weight about twice that of the linear polymer. The blend with the branched SBS showed greater segregation, as expected based on the effect of molecular weights showed here. It is doubtful that a significant difference in stability would have been observed between the linear and branched copolymers had the molecular weights been close.
Effect of bitumen on stability. The effect of bitumen was investigated by blending L1
with two bitumens, ABA and PC (Table 2). The stability of these blends is shown in Figure 15. Blends with 3% SBS were stable regardless of bitumen, but blends with 6% SBS segregated. With ABA, segregation was faster and more extensive than with PC.
Previous results have shown that the rate of segregation, or the diffusion, is governed by the molecular weight, M, and the size and shape of the molecular coil, n2ν. This is summarized into a rearrangement of eq. 4, 6 and 7 :
D ∝ 1/(M n2ν ) (eq. 9)
On the basis of molecular weight alone and with MABA > MPC (Table 2), blends with
ABA were expected to segregate the slowest. That the reverse was obtained demonstrates that molecular shape affected segregation. For bitumen n≈10,9 hence νABA
> νPC. Given that ν increases in going from a spherical to a stiffer rod-like structure,29 the
average ABA molecular structure may be stiffer than that of PC because it contains more (or longer) aromatics with fused rings, which are more rod-like than simple alkyl aromatics. This is in agreement with the lower aromatic H/aromatic C ratio for ABA than for PC, as calculated by NMR (Table 2). The lower the ratio, the greater the substitution on aromatic carbons and the greater the likelihood of fused aromatics.
Earlier studies concluded that bitumen-SBS blends were more stable and segregated less when bitumen had a low asphaltenes content,3 a high aromatics content,11 or a low colloidal instability index (Ic),13 this index being defined as the ratio
(saturates+aromatics)/(resins+asphaltenes). According to these criteria, blends with ABA were expected to be more/less/more stable than blends with PC, respectively. Figure 15 shows that when segregation occurred, blends with ABA were less stable than blends with PC. Hence, the existing criteria for selecting bitumen are not absolute, and they can be inaccurate and inconsistent amongst themselves.
The use of Ic is of dubious value as it has been shown that both saturates and aromatics
contribute to the stability of SBS.4 These fractions play against each other in the calculation of Ic (Table 2), so it may be the other fractions, the asphaltenes in particular,
that have the greatest influence on Ic. This would explain the consistency between the
above predictions for Ic and asphaltenes content.
The necessity for a high aromatics content to enhance stability is also questionable. The results in Figure 15 were obtained with bitumens of relatively low aromatics contents (15-30%) and they were not different from those obtained in similar conditions with bitumens of 50-65% aromatics.13 The poor value of the aromatics content as a guide of bitumen-SBS stability is also recognized in the instability of blends of SBS with a West-Texas intermediate bitumen35,36 (labeled AAM by the Strategic Highway Research Program), despite the content of 41% naphtene aromatics and 50% polar aromatics for this bitumen.37
The failure of existing methods to correctly assess bitumen-SBS stability stems from their inability to account for combined contributions to ∆H and ∆S (eq. 2, 3). Selections based on Ic or aromatics aim to maximize molecular interactions, and therefore the favorable
contribution of ∆H to ∆G (eq. 1). In contrast, that based on asphaltenes aims to minimize the content of the highest molecular weight fraction within bitumen, and thus maximize
On this basis, it is interesting that the stability of ABA and PC with L1 (Figure 15) seems governed by ∆S rather than ∆H. The molecular weight for PC is about 60% of that for ABA, hence, ∆SPC > ∆SABA. In terms of strong interactions and effect on ∆H, the oxygen
and chlorine content in ABA suggest that it can form more hydrogen bonds than PC. However, this probably does not enhance stability because, as seen earlier, these electron-rich atoms would interact with PS, which by itself does not favour mixing with bitumen. It is PB blocks that favour mixing, and so it is likely that only weak interactions exist between bitumen and SBS. As a result, it appears that ∆S has more effect on ∆G than ∆H. This order of importance may differ for polymers other than SBS.
A phase diagram for bitumen-polymer blends
For blends of bitumen with SBS, the relative importance of ∆S and ∆H may be inferred, but they have yet to be calculated and a precise phase diagram plotted because the parameters in eq. 2 and 3 remain elusive. Some characteristics of the phase diagram can be deduced from the FTIR and other data.3,4,11-14
Bitumen is not a homogeneous material, but a mixture conveniently fractionated into saturates (S), aromatics (A), resins (R) and asphaltenes (As). Hence, bitumen-polymer blends are pseudo-binary mixtures. Saturates and aromatics swell SBS, and a r = 0.9 correlation exists between the polymer content in the blend and an enrichment of the bitumen-rich phase in asphaltenes.4 Given that the molecular weight of the bitumen fraction increases in the order S<A<R<As,8 the increase in polymer content in the blend translates into an effective increase in the molecular weight of the bitumen phase. This
leads to a decrease in ∆S and a higher ∆G, which favors segregation (eq. 1 and 3). This results is the downward translation of the spinodal due to the increase in polymer content (e.g. Figure 6).
As a consequence of the non-ideal behavior of bitumen-polymer blends, two dimensional phase diagrams like those in Figure 1 are inaccurate because they disregard the change in effective bitumen molecular weight due to mixing. A tri-dimensional phase diagram can account for the polymer and bitumen constituents that lead to mixing, e.g. PB, the saturates (S) and the aromatics (A). Figure 16 illustrates the case for bitumen ABA and L1 where the LCST goes down and to the left as the SBS concentration increases (or PB content decreases) and the S+A content in bitumen decreases (or As content increases). The dotted spinodal indicates the possibility of a LCST above 180°C, whereas the junction of the spinodal and the 165°C plane reflects the extent of segregation for the blends with 6 and 10 % SBS. The phase diagram helps explain the effect of the blend components on stability, including concentrations, molecular weights, and compositions. Upon cooling from the 2-phase region, the LCST represents the temperature at which the polymer is soluble in bitumen.
Conclusion
Bitumen-polymer blends, and in particular those with styrene-butadiene (SB)-type copolymers, have received much attention in the last 20 years. It has been shown that copolymer and bitumen composition and characteristics affect the stability of these blends. No comprehensive theoretical treatment unites or criticizes these approaches, and as a result, it is impossible to a priori identify compatible bitumen-polymer pairs.
In this work, infrared spectroscopy was used to measure the stability, segregation rates and equilibrium concentrations in bitumen-SB blends stored at 100-180°C, and define the type of molecular interactions responsible for blend stability. The results were analyzed in light of established mechanisms for phase segregation, blend thermodynamics, and phase diagrams for binary mixtures. This allowed for a fundamental approach to the effect of polymer concentration, molecular weight, copolymer composition and branching, and bitumen source on blend stability. This study has highlighted the following:
•
•
•
•
The stability of bitumen-polymer blends is governed by the entropy (∆S) and enthalpy (∆H) of mixing, in other words, by molecular weights and intermolecular interactions.
In bitumen-SB blends, shifts in infrared absorbances indicate that the intermolecular interactions between bitumen and the polybutadiene blocks (PB) are stronger than those with the polystyrene (PS) blocks. PB interacts through its π -electrons with positively charged groups in bitumen, whereas PS interacts through its aromatic protons with electron-rich groups in bitumen.
The use of Hildebrand solubility coefficients to assess interactions between bitumen and SBS leads to inaccurate predictions of blend stability.
The phase diagram for bitumen-SB blends shows a lower critical solution temperature (LCST) below which the blends are stable, but above which they segregate.
• • • • • •
The morphology of the incompatible blends is most likely the result of spinodal decomposition followed by coarsening and coalescence.
The rate of segregation, if any, is governed by the molecular weight and the molecular shape of both blend components.
The branching of SB does not affect blend stability. It is the copolymer composition and molecular weight that determines its compatibility with bitumen. The PB content of SB is linearly correlated with the equilibrium copolymer concentration after segregation. An increase in PB content decreases segregation.
An increase in copolymer concentration leads to an effective increase in the molecular weight of the bitumen rich fraction and a reduction in ∆S. The result is a lower LCST, and reduced blend stability. An increase in copolymer molecular weight leads to the same result.
The colloidal instability index, and the content of aromatics or asphaltenes in bitumen lead to discordant stability predictions. These methods effectively emphasize the effect of either ∆H or ∆S on blend stability, but not both.
Bitumen-polymer blends are pseudo-binary mixtures. The two-dimensional phase diagram typical of regular binary mixtures must be expanded to three dimensions to account for the behavior of these blends.
It must be emphasized that these results are semi-quantitative and certainly not comprehensive in light of all possible bitumen-polymer blends, but they are nonetheless very significant. Extensive work on polymer blends has shown that the same fundamentals govern the general behavior, and it is not expected that it would be
different for bitumen-polymer blends. Hence, the theoretical framework identified in this work can be applied to the general behavior of bitumen-polymer blends. Moreover, the usefulness of precise phases diagrams that thermodynamics can provide cannot be over emphasized. Such diagrams would help determine the temperature at which storage without segregation is possible, and the quench temperatures to use in an attempt to control dispersion size and blend morphology. The result would be improved control over macroscopic properties.
Acknowledgements
The authors would like to thank Mr. Floyd Toll of the Institute for Chemical Process and Environmental Technology for elemental analysis.
References
(1) Anonymous, The Asphalt Handbook, Asphalt Institute: Lexington, KY,1989
(2) Whiteoak, D. Shell Bitumen Handbook, Shell Bitumen U.K.: Surrey, 1990.
(3) Kraus, G.; Rollman, K.W. Kautschuk Gummi Kunststoffe 1981, 34, 645-657 (in German).
(4) Brion, Y.; Brûlé, B. Étude des mélanges bitumes-polymères: composition,
structure, propriétés. Report PC-6, French Central Laboratory for Roads and
Bridges (LCPC), July 1986, p. 67 (in French).
(5) Isacsson, U.; Lu. X. Materials and Structures 1995, 28, 139-159.
(6) Migliori, F.; Durieu, F.; Ramond, G. Revue Générale des Routes et des
Aérodromes 1993, 711, 23-30.
(8) Speight, J. The Chemistry and Technology of Petroleum, Marcel Dekker: New
York, 3rd Ed. 1999.
(9) Legge, N. R. Rubber Chem. Technol. 1987, 60(3), G83-G117.
(10) Harlan, J. T.; Petershagen, L. A.; Ewins, E. E.; Davies, G. A. Thermoplastic
Rubbers (ABA Block Copolymers) in Adhesives. In Handbook of Adhesives, 3rd
Ed. Skeist, I. Ed., Van Nostrand Reinhold: New York, 1990, 239-269. (11) Kraus, G. Rubber Chem. Technol. 1982, 55, 1389-1402.
(12) Wloczysiak, P.; Vidal, A.; Papirer, E.; Gauvin, P. J. Appl. Polym. Sci. 1997, 65, 1595-1607.
(13) Lu, X,; Isacsson, U. Mat. Struct. 1997, 30, 618-626.
(14) Lu, X,; Isacsson, U.; Ekblad, J. J. Mat. Civil. Eng. 1999, 11(1), 51-57.
(15) Olabisi, O.; Robeson, L.; Shaw, M. T. Polymer-Polymer Miscibility, Academic Press: New York, 1979.
(16) Utracki, L.A. Polymer Alloys and Blends: Thermodynamics and Rheology,
Hanser Publishers: New York, 1990.
(17) Kwei, T. K.; Wang, T. T. Phase Separation Behavior of Polymer-Polymer Mixtures, in Polymer Blends, Paul, D. R. and Newman, S. Ed., Academic Press: New York, 1978.
(18) Masson, J-F.; Price, T.; Collins, P. Energy Fuels 2001, 15, 955-960.
(19) Masson, J-F.; Pelletier, L.; Collins, P. J. App. Polym. Sci. 2001, 79, 1034-1041. (20) Lyklema, J. Fundamentals of Interface and Colloid Science, Vol. 1, Academic
(22) Halliday, D. and Resnick, R. Physics. Wiley: New York, 1963, p. 522.
(23) van der Heijden, P. A DSC Study on the Demixing of Binary Polymer Solutions. Ph. D. thesis, University of Twente, 2001.
(24) Hesp, S. A. M.; Woodhams, R. T. Colloid & Polymer Science 1991, 834, 269-825.
(25) Hamley, I. W. The Physics of Block Copolymers, Oxford Science Publications: New York, 1998.
(26) McMaster, L. P. Macromol. 1973, 6(5), 760-773.
(27) Siow, K. S.; Delmas, G.; Patterson, D. Macromol. 1972, 5(1), 29-34.
(28) Billmeyer, F. W. Textbook of Polymer Science, Wiley: New York, 3rd Ed. 1984.
(29) Mattice, W. L.; Pugh, C. Masses, Sizes and Shapes of Macromolecules from
Multifunctional Monomers, Chap. 1 in Dendrimers and Dendrons: Concepts, Syntheses, Applications, Newkome, G.R.; Moorefield, C.N.; Vogtle, F. Ed.,
Wiley-VCH, New-York, 2001.
(30) Ho, R-M.; Adedeji, A.; Giles, D. W.; Hajduk, D. A.; Macosko, C. W.; Bates, F. S.
J. Polym. Sci. B: Polym. Phys. 1997, 35, 2857-2877.
(31 ) Coleman, M. M.; Painter, P. C. Appl. Spectros. Rev., 1984, 20, 255-346. (32) Lin-Vien, D.; Colthup, N. B.; Fateley, W. G.; Grasselli, J. G. The Handbook of
Infrared and Raman Characteristic Frequencies of Organic Molecules, Academic
Press: New York, 1991, p.81.
(33) Nishio, M.; Minoru, H.; Umezawa, Y. The CH/π Interaction: Evidence, Nature and Consequences. Wiley-VCH: New York, 1998.
(34) Joesten, M.D.; Schaad, L. J. Hydrogen Bonding, Marcel Dekker: New York, 1974.
(35) King, G., Private communication, 2001.
(36) Collins, J. H.; Bouldin, M. G. Rubber World August 1992, 32-68.
(37) Jones IV, D. R. SHRP Materials Reference Library: Asphalt Cements: A Concise
Data Compilation. Report SHRP-A-645, Strategic Highway Research Program,
Table 1. Characteristics of SB-type copolymers
Copolymer Typea Product S:B Ratiob Mn Mw/Mn
L1 Linear SBS Enichem, SOL T166 30:70 124,000 1.04
L2 Linear SBS Shell, Kraton D1101 33:67 166,000 1.09
L3 Linear SBS Enichem, SOL T6302 30:70 173,000 1.06
S1 Star SBS Enichem, SOL T6205 24:76 264,000 1.14
a
linear type is (SB)2-x and star type (SB)4-x, where x is a coupler. b Measured by
proton NMR.
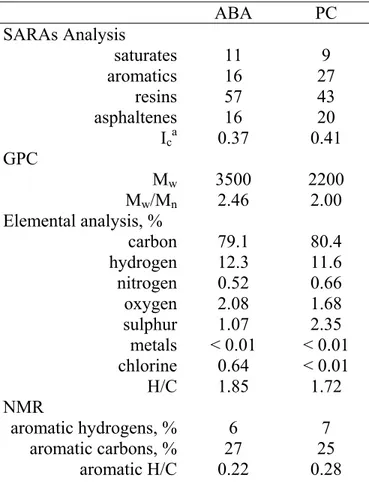
Table 2. Bitumen characteristics
ABA PC SARAs Analysis saturates 11 9 aromatics 16 27 resins 57 43 asphaltenes 16 20 Ica 0.37 0.41 GPC Mw 3500 2200 Mw/Mn 2.46 2.00 Elemental analysis, % carbon 79.1 80.4 hydrogen 12.3 11.6 nitrogen 0.52 0.66 oxygen 2.08 1.68 sulphur 1.07 2.35 metals < 0.01 < 0.01 chlorine 0.64 < 0.01 H/C 1.85 1.72 NMR aromatic hydrogens, % 6 7 aromatic carbons, % 27 25 aromatic H/C 0.22 0.28 a Ic = (saturates+asphaltenes/aromatics+resins)
Figures
Figure 1. Typical phase diagrams for binary mixtures miscible in all temperatures (a),
that segregate upon heating (b), that segregate upon cooling (c), that segregate upon heating and cooling (d, e). The composition of the segregated phases (φa and φb) is
governed by the spinodal curve (f).
0 0.2 0.4 0.6 0.8 1 650 700 750 800 850 900 950 1000 1050 1100 Frequency, wavenumber Ab so rb an ce 0 ho urs 2 ho urs 2 4 ho urs
Figure 2. Portion of FTIR spectra for blends of ABA with 3% SBS. The copolymer
Figure 3. Dispersion of 3, 6, and 10 % (w/w) of linear SBS (L1) in ABA as obtained by
fluorescence microscopy. The lighter phase is polymer-rich and the darker phase is bitumen-rich.
0 1 2 3 4 5 6 7 0 5 10 15 20 25 Exposure to 165°C (h) PS concentration (%) 10%L1 6%L1 3%L1
Figure 4. Concentration of PS at the surface of a blend of ABA with 3, 6, and 10% of
SBS copolymer L1 after storage at 165 °C.
0 2 4 6 8 10 0 5 10 15 20 25 Storage time, h PS concentration, % 100°C 120°C 140°C 160°C ABA + 10% L1
Figure 5. PS concentration at the surface of blends with ABA and 10% L1 stored 0-24 h
Figure 6. Translation of the spinodal along the temperature axis due to a change in SBS
content and its affect on equilibrium concentration.
Figure 7. Schematic illustration of phase segregation by nucleation and growth (top row)
0 1 2 3 4 5 6 0 5 10 15 20 25 Exposure to 165°C, h PS concentration, % 3% blends L1 L3 0 1 2 3 4 5 6 0 5 10 15 20 25 Exposure to 165°C, h PS concent rat ion, % 6% blends L1 L3
Figure 8. Change in concentration of PS at the surface of blends prepared with ABA and
linear SBS copolymers of different molecular weights, L3 being of a larger molecular weight than L1.
Figure 9. Effect of polymer molecular weight on the LCST in polymer blends (a) and
0 1 2 3 4 5 6 0 5 10 15 20 25 Exposure to 165°C, h PS concentration, % 3% blends L3 L2 0 1 2 3 4 5 6 0 5 10 15 20 25 Exposure to 165°C, h PS concentrati on, % 6% blends L3 L2
Figure 10. Change in PS concentration in blends of ABA with SBS of different S/B
8 10 12 14 16 18 Solubility parameter, (cal/cc)1/2
PB saturates PS aromatics resins asphaltenes miscible miscible
Figure 11. Hildebrand solubility parameters for the PS and PB blocks, and the bitumen
fractions. Adapted from ref. 30.
R2 = 0.9876 698.5 698.6 698.7 698.8 698.9 699 699.1 0 20 40 60 80 1 SBS content (%) PS frequency (w avenum ber) 00 R2 = 0.9039 965.32 965.34 965.36 965.38 965.4 965.42 965.44 965.46 0 10 20 30 40 50 60 70 80 90 100 SBS content, % PB frequency, w avenum ber
Figure 12. Shift in frequency for PS (top) and PB blocks in blends of SBS with bitumen.
0 1 2 3 4 5 6 0 5 10 15 20 25 Exposure to 165°C, h P S concent rat ion, % 3% blends L3 S1 0 1 2 3 4 5 6 0 5 10 15 20 25 Exposure to 165°C, h PS concentration, % 6% blends L3 S1
Figure 13. Change in PS concentration in blends prepared with linear and star SB after
storage at 165 °C. The 3% and 24 h values are at equilibrium, as longer heat storage did not lead to further segregation.
R2 = 0.982 66 68 70 72 74 76 78 0 1 2 3 4 5 Equilibrium PS concentration, % PB content 6
Figure 14. Equilibrium copolymer concentration as assessed from the PS block
concentration at the surface of blends prepared with ABA and 3% L2, L3 and S1. The PB contents are from Table 1 and the concentrations from Figures 10 and 13.
0 1 2 3 4 5 6 0 5 10 15 20 25 Exposure to 165°C, h PS concent rat ion, % 6% 3% ABA PC
Figure 15. Concentration of PS at the surface of blends prepared with linear SBS
copolymer L1 and ABA, or PC, after storage at 165 °C. Labels indicate the bitumen source and copolymer concentration.
Figure 16. Schematic phase diagram for bitumen-SBS blends that accounts for the