READ THESE TERMS AND CONDITIONS CAREFULLY BEFORE USING THIS WEBSITE.
https://nrc-publications.canada.ca/eng/copyright
Vous avez des questions? Nous pouvons vous aider. Pour communiquer directement avec un auteur, consultez la
première page de la revue dans laquelle son article a été publié afin de trouver ses coordonnées. Si vous n’arrivez pas à les repérer, communiquez avec nous à PublicationsArchive-ArchivesPublications@nrc-cnrc.gc.ca.
Questions? Contact the NRC Publications Archive team at
PublicationsArchive-ArchivesPublications@nrc-cnrc.gc.ca. If you wish to email the authors directly, please see the first page of the publication for their contact information.
NRC Publications Archive
Archives des publications du CNRC
This publication could be one of several versions: author’s original, accepted manuscript or the publisher’s version. / La version de cette publication peut être l’une des suivantes : la version prépublication de l’auteur, la version acceptée du manuscrit ou la version de l’éditeur.
Access and use of this website and the material on it are subject to the Terms and Conditions set forth at
Condition assessment and rehabilitation of large sewers
McDonald, S. E.; Zhao, J. Q.
https://publications-cnrc.canada.ca/fra/droits
L’accès à ce site Web et l’utilisation de son contenu sont assujettis aux conditions présentées dans le site LISEZ CES CONDITIONS ATTENTIVEMENT AVANT D’UTILISER CE SITE WEB.
NRC Publications Record / Notice d'Archives des publications de CNRC: https://nrc-publications.canada.ca/eng/view/object/?id=9885d070-00e7-49ba-bc0c-72c44fcd8c4f https://publications-cnrc.canada.ca/fra/voir/objet/?id=9885d070-00e7-49ba-bc0c-72c44fcd8c4f
Condition assessment and rehabilitation of large sewers
McDonald, S.E.; Zhao, J.Q.
A version of this paper is published in / Une version de ce document se trouve dans : International Conference on Underground Infrastructure Research, University of
Waterloo, Waterloo, Ontario, June 10-13, 2001, pp. 361-369
www.nrc.ca/irc/ircpubs
1 INRODUCTION
It is encouraging to note that more and more mu-nicipal engineers take a pro-active approach in man-aging their buried municipal assets in order to main-tain the expected level of service to their clients. The sewer system is one such service that is expected to function without interruptions.
The current state of practice in managing sewer systems varies from city to city, resulting in incon-sistencies in use of terminology, inspection, condi-tion assessment, seleccondi-tion of rehabilitacondi-tion methods, and record keeping (Zhao 1998). Some municipali-ties have carried out extensive work to assess the condition of their sewers, whereas others may have not even started partially due to lack of user-friendly and consistent guidelines. While some Canadian municipalities have adopted the approach by WRc (1994), others have developed their own sewer in-spection and condition assessment manuals (Edmon-ton 1996a, 1996b). The sewer manuals by NASSCO (1995) and ASCE (1994) are also available. Al-though these sewer manuals are useful, engineers of-ten find themselves searching through various manuals to compile useful information and to for-mulate a practical approach to the problems on hand. Furthermore, there is no consistent approach for the assessment of impact factors associated with the sewer systems and of access holes.
The Urban Infrastructure Rehabilitation Program of the National Research Council Canada (NRC) in collaboration with 10 municipalities and two
con-sulting companies has just completed a set of guide-lines for the condition assessment and rehabilitation of large diameter sewers (> 900 mm) and access holes. The objective was to provide users with a practical and easy to follow approach on how to manage large sewers effectively. More specifically, users can find information on the following subjects:
• health and safety;
• availability, applicability and limitations of ex-isting technologies for inspection, condition as-sessment and rehabilitation of large sewers;
• assessment of major impact factors in decision making;
• data management;
• selection of rehabilitation methods;
• prediction of existing sewer conditions; and
• cost estimates.
This paper summarizes the guidelines developed by NRC as a result of the joint research project. The use of the approach is also illustrated through a prac-tical example. However, some details and rationale are omitted for this paper. A full document is ex-pected to be published by NRC in the near future.
2 APPROACH
The necessary steps to maintaining the performance of sewer systems is illustrated in Figure 1. This ap-proach is recommended for both the pipe and the ac-cess holes that are attached to the pipe. The contents
Condition assessment and rehabilitation of large sewers
Shelley E. McDonald & Jack Q. Zhao
Institute for Research in Construction, National Research Council Canada, Ottawa, Ontario, Canada
ABSTRACT: The Urban Infrastructure Rehabilitation Program of the National Research Council Canada (NRC) in conjunction with 10 municipalities and two consulting companies has just completed a set of guide-lines focusing on the impact and condition assessments, and rehabilitation of large diameter sewers (> 900 mm) as well as access holes. The guidelines provide a consistent approach for assessing the impact of pipe failure, coding defects and assigning priorities for rehabilitation. The user-friendly approach is demonstrated with an example. By using unified definitions of terminology and a consistent defect coding system, informa-tion can be shared between utilities across the country. Pooling scarce sewer condiinforma-tion data from various mu-nicipalities across Canada will enable the development and verification of statistical models for assessing sewer deterioration and predicting its remaining service life.
and the relationships between each step will be dis-cussed in detail in the following sections.
Figure 1. Approach for managing sewer assets
2.1 Inventory
As the first step, the available inventory data must be compiled in a manageable format for their effective use. The established database can then be linked to other databases such as inspection and re-habilitation databases. Pipe identification (pipe ID) or access hole identification (MH ID) can be used as unique identifiers to link different relational data-bases. Examples of the types of information that should be included in the inventory database are shown in Table 1. Database tables are to be filled in with the inventory information for each pipe seg-ment, where each segment is expressed in a per-metre unit length.
2.2 Impact assessment
The criteria used to prioritize inspection and reha-bilitation should include not only the physical condi-tion of the pipe, but also the degree of impact of a sewer failure. The proposed impact assessment ranks the pipe segments in unit length in terms of six major factors – location, type of embedment soil, burial depth, pipe size, functionality and seismic zone. The assessment will generate a ranking of im-pact for the sewer system. The premise for an imim-pact factor follows from the fact that not all pipe seg-ments have the same likelihood of failure or the same consequence of failure.
Table 1. Sewer pipe inventory
Field name Entry example(s)
Pipe ID XYZ-ABC
Upstream access hole ID ABC-1234
Downstream access hole ID ABC-1235
Installation year 1950
Material Concrete
Construction method Cast in place
Length Value in metres
Slope Value in percent
Shape Circular/ellipse/arch
Dimensions Values in millimetres
Joint type Bell and spigot/welded
Soil type Clay/native
Burial depth (to crown) Value in metres
Sewer function Interceptor/collector
Service lateral Connections
Yes/no
Service lateral type Concrete/PVC
Land use Residential/commercial/
industrial
Seismic zone Rating based on city
Internal lining type Mortar/asphalt
Each of the six factors is assigned a degree of im-pact defined by low, medium or high. How each fac-tor is assessed is explained below:
• The impact based on pipe location is assessed on how the public and environment will be af-fected if failure occurs. The contributing as-pects include land use, traffic intensity, access for repair, location under or adjacent to critical establishments and environmental classifica-tions. These factors were considered similarly by the City of Phoenix (Brown and Caldwell 1998). For instance, a segment of pipe within an airport perimeter or under 6 lanes of traffic or in a commercial area will have a high de-gree of impact (rating of 3). On the other hand, a pipe in an industrial park or under 1 or 2 lanes of traffic will have a low degree of im-pact (rating of 1). The pipe location affects both the likelihood of failure and the severity of failure consequence.
• Soil support is an integral component of the pipe-soil system. Void formation and loss of soil support resulting from fractures and open joints in the presence of sufficient hydrostatic head can contribute to premature pipe fail-ures. The types of supporting material that pose the greatest threat are silts and sands (rating of 3), while medium to high plasticity clays have the lowest degree of impact (rating of 1). Soil support affects the likelihood of failure.
• The magnitude of repair work and the selec-tion of rehabilitaselec-tion methods are dependent on pipe size. If a failure occurs the size of the pipe will have an impact on the amount of contamination to the surrounding environ-ment. As a result, a pipe with a diameter (or Inspection Condition assessment Impact assessment Decision-making on rehabilitation actions Frequency of next inspection Rehabilitation Prioritization Inventorydatabase
vertical size) of less than 900 mm is given a low rating (1) while those with diameters greater than 1800 mm are given a high rating (3). The pipe size affects the severity of fail-ure consequence.
• The deeper a pipe is buried the greater the de-gree of difficulty in accessing it for repair and inspection. The burial depth rating will be low (1) for pipe buried less than 3 m and high (3) for a burial depth greater than 10 m. The bur-ial depth affects both the likelihood of failure and the severity of failure consequence.
• The function of the sewer includes both the types of waste carried and the location of the segment of the system. For example, the envi-ronmental consequences will be more severe for a sanitary sewer failure than a storm sewer failure. Also, the failure of a pipe segment en-tering the treatment plant will be more severe than that of a collector pipe. The rating for a high degree of impact is 3 (pipe enter-ing/exiting a treatment plant) and 1 for a low degree of impact (collector pipe). The sewer function affects both the likelihood of failure and the severity of failure consequence.
• Areas prone to seismic activity based on in-formation from the National Building Code (1995) are assigned a rating of 1 for a low seismic (zonal velocity or acceleration be-tween 0 and 2), and 3 for a high seismic zone (zonal velocity or acceleration between 5 and 6). The seismic factor is generally the same for one region and its inclusion facilitates the comparison of condition assessments from different regions of the country. The seismic zone affects the likelihood of failure.
For all of the factors listed above, the medium de-gree of impact falls between the high and low ex-tremes and is assigned a value of 1.5. A weighted impact rating formula is used to combine the influ-ence of each of the six factors described above for each pipe segment within the system (Eq. 1)
(1)
where fl = location factor, fs = embedment soil
fac-tor, fz = size factor, fd = burial depth factor, ff =
sewer function factor and fq = seismic factor.
Although these factors do not change dramatically from year to year, periodic updating may be neces-sary.
2.3 Prioritization
Once the weighted impact rating is completed for individual pipe segments, a citywide color-coded
impact map can be produced highlighting areas where the impact rating is high. This impact assess-ment can then be used in a number of ways in the decision-making process. First, it can be used to pri-oritize inspection tasks. The areas to investigate first, if no other information is available, will be those showing a high impact rating. Secondly, the impact ratings can be used in combination with the physical condition rating of a pipe to prioritize reha-bilitation work and the future inspection frequencies. For instance, of the pipe segments with the same physical condition rating, those with higher impact ratings would be considered first for rehabilitation.
In addition, those pipe segments in the vicinity of a watermain burst, locations with chemicals of above-normal concentrations, locations with ground settlements, and those pipe segments with known problems (e.g., inflow and infiltration I/I) should be given special attention. Other considerations include coordinating pipe inspection with road refurbish-ment or watermain replacerefurbish-ment efforts. Finally, in high seismic areas, those pipe segments surrounded by soils with high liquefaction potentials should be identified.
It should be pointed out that the approach for im-pact assessment could be adopted for smaller sewers (< 900 mm), or for watermains.
2.4 Inspection
Once the pipe segments have been prioritized, the inspection of those segments can take place. The methods used for inspection include, but are not lim-ited to, closed circuit television (CCTV), combined Sonar/CCTV, person-entry, and stationary camera.
Some of the inspection methods are more suited for partial pipe lengths (special purpose) or in con-junction with other methods (in-line) while others can be used to inspect from access hole to access hole (full-line). Depending on the budget and if ad-ditional information is known about the pipe seg-ments, the choice of inspection technique may be obvious. For instance, person-entry may be the most effective and economical method for inspecting large storm sewers and culverts.
The most widely used method for sewer inspec-tion is CCTV which is an example of a full-line in-spection method. Defects present above the flow surface can be located, identified and ranked by a trained operator. The operators, as well as the crew who will carry out a person-entry inspection, should be trained in order to ensure consistency and uni-formity of the inspection results. Other examples of full-line inspection methods are combined so-nar/CCTV, person entry and stationary cameras. The combined sonar/CCTV is beneficial to inspect the pipe surface below the flow surface. Person-entry
q f d z s l w f f f f f f I ) 16 . 0 ( ) 16 . 0 ( ) 16 . 0 ( ) 16 . 0 ( ) 16 . 0 ( ) 2 . 0 ( + + + + + =
inspections allow the gathering of first-hand and de-tailed information about the defects in the pipe.
If a CCTV inspection has flagged a particular pipe segment with numerous defects, further inves-tigation may be required to assess the extent of the damage. If that is the case, one of the special pur-pose inspection techniques might be used. For ex-ample, where an open joint exists, it might be a good idea to investigate whether or not voids are present behind the pipe walls. Ground penetrating radar and infrared thermography are available methods for de-tecting voids around the pipe (EPA 1999). If the full-line inspection is completed by person entry, there are in-line testing techniques that could be used to further assess the integrity of the pipe wall and surrounding soil support. Examples of in-line testing techniques include impact echo, coring and in-situ strength testing.
Sewer defects are commonly grouped into two categories – service and structural, and each defect has a unique defect name and definition. The types of service defects are infiltration (I), root intrusion (R), encrustation (E), debris (DE) and protruding service connection (P). Examples of structural de-fects include fractures (F), cracks (C), deformed pipes (D), collapsed pipes (X), broken pipes (B), joint displacements (JD), joint openings (JO), sur-face damage (H) and sags (S). The letters in brackets indicates the abbreviation used to identify the defect. The defects identified are coded based on clear defi-nitions of each type of defect and its severity.
When appropriate the degrees of severity are clearly defined giving dimensions to help quantify the differences between a defect that would be con-sidered light (L), moderate (M) or severe (S). An example is presented (infiltration) to illustrate the in-formation that is provided for each defect. The final letter in the defect code symbol indicates the level of severity of that defect.
Infiltration – the ingress of groundwater through a defect or defective joints or connections
Defect codes – Light (IL) – seeping or dripping,
Moderate (IM) – running or trickling, Severe (IS) – gushing or spurting.
Rationale – severe infiltration poses a high pos-sibility of loss of soil fines which leads to loss of soil support, as well as increased sewer volume to be treated (e.g., more load on the treatment facil-ity).
This system defect coding is similar to those of WRc (1993) and Edmonton (1996a and 1996b). But unlike those methods the proposed system is not limited to camera inspections. With proper training, defect coding can be carried out by person-entry in-spection crews, or by certified divers for inundated siphon sections.
2.5 Condition Assessment
After the inspectors carry out the preliminary as-sessment of the pipe by coding the defects using a set of defined defect codes, a more rigorous condi-tion assessment can be carried out. The assessment can be based on the per-metre length, or the access-hole to access-access-hole length (MH-MH length, for ab-breviation), depending on the level of decision-making. If the decision-making is on the global level of a system to determine which areas are worse, the MH-MH length is appropriate to use. On the other hand, if the decision-making is on the macro level to determine what defects exist and what rehabilitation methods are most appropriate, the per-metre unit length is then the more appropriate length to use. With the help of an electronic database, data that are input on the per-metre assessment length can also be queried to give information globally.
The structural and service condition ratings are established directly from the inspection data. Weights are assigned based on the defect type and the severity.
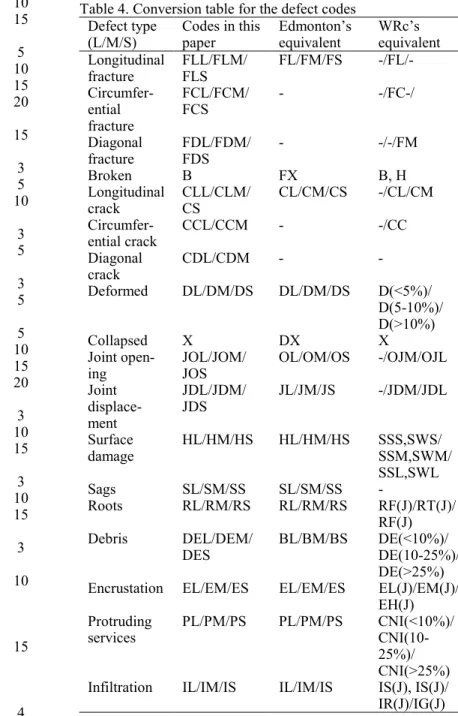
Tables 2 and 3 show the service and structural de-fect codes and their weights, respectively. If the user currently uses another method to code defects, a conversion table like Table 4 can be set up to con-vert those codes to the ones presented here.
Table 2. Service defect codes and weights
Defect type Code Weight
Roots
fine roots, restricting flow <10% RL 2
10% to 25% diameter loss RM 8
> 25% diameter loss RS 10
Debris
< 10% flow restriction DEL 5
10% - 25% diameter loss DEM 8
> 25% diameter loss DES 10
Encrustation
< 10% flow restriction EL 2
10% - 25% diameter loss EM 8
> 25% diameter loss ES 10
Protruding service connection
< 10% flow restriction PL 2 10% - 25% diameter loss PM 8 > 25% diameter loss PS 10 Infiltration Seeping, dripping IL 2 Running, trickling IM 5 Gushing, spurting IS 10
Table 3. Structural defect types, codes and weights
Defect type Code Weight
Longitudinal fracture < 10 mm wide FLL 5 10 mm – 25 mm wide, or 2 – 3 frac-tures FLM 10 > 25 mm wide, > 3 fractures FLS 15 Circumferential fracture < 10 mm wide FCL 5 10 mm – 25 mm wide FCM 10 > 25 mm wide FCS 15 Diagonal fracture < 10 mm wide FDL 5 10 mm – 25 mm wide FDL 10 > 25 mm wide, multi-occurrence FDS 15 Multiple fractures FM 20 Broken pipe > 100 diameter or 100 square B 15 Longitudinal crack No leakage CLL 3 With leakage CLM 5
With leakage, multiple CLS 10
Circumferential crack No leakage CCL 3 With leakage CCM 5 Diagonal crack No leakage CDL 3 With leakage CDM 5 Deformed pipe < 5% diameter change DL 5 5% - 10% diameter change DM 10 > 10% diameter change DS 15 Collapsed X 20 Joint opening < 10 mm JOL 3
10 mm – 50 x wall thickness JOM 10
> 50 x wall thickness JOS 15
Joint displacement
< ¼ pipe wall thickness JDL 3
¼ - ½ pipe wall thickness JDM 10
> ½ pipe wall thickness JDS 15
Surface damage
< 5 mm pipe wall thickness spalled or worn out, pitting on metal pipe
HL 3 5 mm – 10 mm pipe wall thickness
lost, exposed reinforcement or ag-gregates, extended corrosion in metal pipe
HM 10
More than 10 mm pipe wall thick-ness lost, corroded reinforcement, corroded through metal pipe
HS 15
Sags
< 50 mm SL 4
50 mm – 100 mm SM 10
> 100 mm SS 15
A spreadsheet template or database can be easily created to organize the inspection data and deter-mine the service and structural defect ratings. Ta-ble 5 shows an example of the database fields for evaluating the service and structural ratings of a sewer pipe. The analysis recognizes the importance to distinguish between a pipe with lots of light de-fects and one with a severe defect. The analysis looks at both the peak score (the worst defect within the assessment length) and the total score. The total score is the sum of all defect weights within an
as-sessment length. The structural and service condi-tion ratings are determined based on the peak score of the defect. The ratings from 0 to 5 are assigned according to Tables 6 and 7. The structural and ser-vice ratings will be combined with the impact factor as part of the decision making process for rehabilita-tion.
Table 4. Conversion table for the defect codes Defect type (L/M/S) Codes in this paper Edmonton’s equivalent WRc’s equivalent Longitudinal fracture FLL/FLM/ FLS FL/FM/FS -/FL/- Circumfer-ential fracture FCL/FCM/ FCS - -/FC-/ Diagonal fracture FDL/FDM/ FDS - -/-/FM Broken B FX B, H Longitudinal crack CLL/CLM/ CS CL/CM/CS -/CL/CM Circumfer-ential crack CCL/CCM - -/CC Diagonal crack CDL/CDM - - Deformed DL/DM/DS DL/DM/DS D(<5%)/ D(5-10%)/ D(>10%) Collapsed X DX X Joint open-ing JOL/JOM/ JOS OL/OM/OS -/OJM/OJL Joint displace-ment JDL/JDM/ JDS JL/JM/JS -/JDM/JDL Surface damage HL/HM/HS HL/HM/HS SSS,SWS/ SSM,SWM/ SSL,SWL Sags SL/SM/SS SL/SM/SS - Roots RL/RM/RS RL/RM/RS RF(J)/RT(J)/ RF(J) Debris DEL/DEM/ DES BL/BM/BS DE(<10%)/ DE(10-25%)/ DE(>25%)
Encrustation EL/EM/ES EL/EM/ES EL(J)/EM(J)/
EH(J) Protruding services PL/PM/PS PL/PM/PS CNI(<10%)/ CNI(10-25%)/ CNI(>25%)
Infiltration IL/IM/IS IL/IM/IS IS(J), IS(J)/
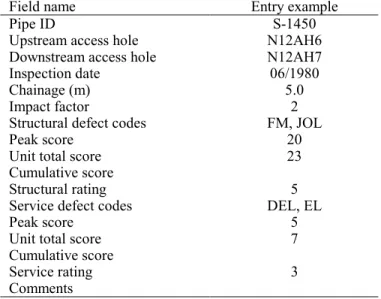
Table 5. Template for structural and service condition ratings based on inspection results
Field name Entry example
Pipe ID S-1450
Upstream access hole N12AH6
Downstream access hole N12AH7
Inspection date 06/1980
Chainage (m) 5.0
Impact factor 2
Structural defect codes FM, JOL
Peak score 20
Unit total score 23
Cumulative score
Structural rating 5
Service defect codes DEL, EL
Peak score 5
Unit total score 7
Cumulative score
Service rating 3
Comments
Table 6. Structural condition rating threshold
Peak score threshold Structural condition state
0 0 1 – 4 1 5 – 9 2 10 – 14 3 15 – 19 4 20 5
Table 7. Service condition rating threshold
Peak score threshold Service condition state
0 0 1 – 2 1 3 – 4 2 5 – 6 3 7 – 8 4 9 – 10 5
2.6 Rehabilitation and future inspection frequency A rehabilitation action plan can be established based on the priority that is determined from the condition state and impact rating (Table 8). Recommended frequencies for future inspections are shown in Ta-ble 9. However, it is emphasized that such decision-making tools are by no means a substitute for engi-neering judgement.
The database should be re-examined to determine the prominent type and extent of the defects if reha-bilitation is warranted. This process will help reduce the rehabilitation choices (e.g., spot repair or con-tinuous repair) and determine the funding require-ment for rehabilitation.
A database that includes available rehabilitation methods, their characteristics and applications, their unit costs and expected service lives, as well as de-fects that each rehabilitation method is expected to remedy can be created to further assist in selecting the appropriate rehabilitation method. User-friendly defect-orientated rehabilitation data sheets can be
generated from the database based on the type of the prominent defect. For instance, if the predominate defect is circumferential cracking, a query on the de-fect-orientated database will list all applicable reha-bilitation methods designed to remedy circumferen-tial cracking.
Table 8. Condition state and rehabilitation priorities
Condi-tion state Implication
Impact rating Rehabilitation priority 5 Failed or imminent failure 1 to 5 Immediate 5 Immediate 4 In bad condition,
high structural risk 1 to 4 High
4 to 5 Medium 3 In poor condition, moderate structural risk 1 to 3 Low 5 Medium 2 In fair condition, minimal structural risk 1 to 4 Low 1 or 0 In good or excellent condition 1 to 5 Not required
The historical unit cost and expected service life will help select the preferred rehabilitation method for a particular pipe length. Municipalities may de-velop their own unit cost data based on their previ-ous projects. In some cases, the rehabilitation method providing the longest service life may not be the best choice. Depending on the future capital pro-jects, a short-term fix may be all that is required if a major reinvestment is planned in the near future. Other factors to consider when deciding the most appropriate rehabilitation technique include groundwater level, aggressiveness of soil and groundwater, life cycle costs, corrosion of pipe ma-terials and seismic zoning.
Table 9. Future inspection frequency Condition State Impact Rat-ing Inspection Frequency (years) 5 1 to 5 0† 5 0† 4 1 to 4 2 to 6 5 3 3 1 to 4 5 to 10 5 5 2 1 to 4 10 to 15 5 10 1 or 0 1 to 4 15 to 25
† Immediate rehabilitation required
3 PRACTICAL EXAMPLE
The approach presented above is illustrated by ap-plying it to a section of a collector sewer that was inspected in the City of Ottawa (formerly the Region of Ottawa-Carleton). The trunk sewer pipes, totaling
over 200 km within the city, range from 600 mm to 3 m in diameter. The inventory of these has been compiled using a commercial database program. The city conducts regular inspections of their sewer pipes and uses the WRc method to code the defects.
The pipe section selected for demonstration here was a section called “the Pinecrest Collector”. The collector sewer, constructed in 1975, consists of concrete pipes ranging from 750 to 900 mm in di-ameter.
Based on the sewer’s inventory information and alignment, an impact assessment was carried out considering all six major impact factors. The entire collector sewer was assigned a location factor of high impact because it passed under commer-cial/business areas and a primary highway. The de-grees of impact of other impact factors are shown in Table 10. When these factors were combined into the weighted formula, the impact threshold was 1.72. The corresponding impact rating is therefore 3, which means the impact of this collector sewer is moderate in terms of likelihood of failure and/or the severity of failure consequence.
The available CCTV inspection video from the city was used to identify defects. The quality of the video was good except for one length from MH PC03900 to PC03800 where the steam from the sewer flow worsened the picture quality, thus pre-venting an analysis of this MH-MH length.
Table 10. Impact factor determination for Pinecrest Collector
Factor Degree of
impact
Rationale
Location High (3) Commercial area, large
buildings, highway, re-stricted access for repair
Embedment soil Low (1) Medium to high plasticity
clays
Size Medium (1.5) Diameter 750 – 900 mm
Burial depth Medium (1.5) Ranges from 5.3 – 6.9 m
Sewer function Medium (1.5) Trunk sewer
Seismic zone Medium (1.5) Za = 4.0, Zv = 2.0
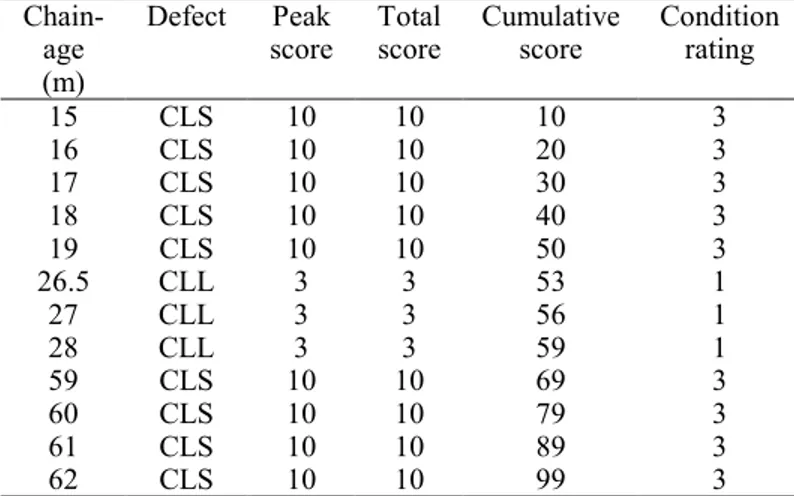
Table 11. Pinecrest Collector from PC03600 to PC03500, structural defect inspection results
Chain-age (m) Defect Peak score Total score Cumulative score Condition rating 15 CLS 10 10 10 3 16 CLS 10 10 20 3 17 CLS 10 10 30 3 18 CLS 10 10 40 3 19 CLS 10 10 50 3 26.5 CLL 3 3 53 1 27 CLL 3 3 56 1 28 CLL 3 3 59 1 59 CLS 10 10 69 3 60 CLS 10 10 79 3 61 CLS 10 10 89 3 62 CLS 10 10 99 3
The remaining 11 MH-MH lengths were evalu-ated using the defect coding systems presented in Tables 2 and 3. The condition assessment on the per-metre unit is demonstrated in Tables 11 and 12 where the non-defective chainages are omitted for brevity.
The structural condition of the collector sewer was therefore rated 3, meaning that it was in poor condition with a moderate structural risk. The longi-tudinal cracks formed a map or spider web pattern on the interior surface of the pipe. There was no evi-dence of leaks at the cracks but the quantity of cracks was a concern.
If the results of the previous inspection were available, they would be compared with the results of the current inspection to track the changes in the defects and their severity.
Table 12. Pinecrest Collector from PC03600 to PC03500, ser-vice defect inspection results
Chain-age (m) Defect Peak score Total score Cumulative score Condition rating 2.9 IL, EL 2 4 4 1 5.9 IL 2 2 6 1 9.1 IL, EL 2 4 10 1 11.2 IL, EL 2 4 14 1 15 EM 8 8 22 4 22.8 EL 2 2 24 1 32.4 IL 2 2 26 1 37.5 EL 2 2 28 1 49.1 IL 2 2 30 1 51.9 IL 2 2 32 1 57.7 IL 2 2 34 1 63.6 EL 2 2 36 1 71 EL 2 2 38 1 74.4 IL 2 2 40 1 77.8 EL 2 2 42 1 80.1 EL 2 2 44 1 86.3 EL 2 2 46 1 90.3 EL 2 2 48 1
Encrustation and infiltration at the joints were the major types of service defects in this section of the collector sewer. The overall service condition rating would be 1. All incidences of encrustation and infil-tration were light except at the 15 m location where the encrustation reduced the pipe diameter by 10% to 25%.
Table 13 shows a summary of the findings for all sections evaluated to illustrate the use of MH-MH assessment length. The condition rating presented in this table is the structural condition rating. The poorest condition occurred from MH PC03500 to MH PC03400, with a peak score of 10 and a total score of 323. Two other inspected sections with a peak score of 10 were PC04400 – PC04300 and PC03600 – PC03500.
Using the condition ratings arrived in this exam-ple the decision-making approach for determining rehabilitation priorities (Table 8) could be used. The worst section was from MH PC03500 to MH PC03400 but no immediate rehabilitation was
re-quired because the structural condition was 3 with an impact rating of 3. The condition assessment summary results are highlighted for this section. No rehabilitation was required because other sections of the collector sewer were in good or fair condition.
The condition ratings were used to determine when to carry out the next inspection/condition as-sessment of the collector sewer. For the sections with a condition rating of 3 and an impact rating of 3, the next inspection/condition assessment should be carried out between 5 to 10 years (using Table 9). For the sections with condition rating less than 3 and impact rating of 3, the time frame would be between 10 and 25 years.
Table 13. Pinecrest Collector condition assessment summary
Ups tream MH Do wn -st ream MH Lengt h (m) Impact rat-ing Peak s core To tal sco re C ondi ti on rat ing PC04600 PC04500 53.2 3 8 30 2 PC04500 PC04400 57.7 3 2 38 1 PC04400 PC04300 74.3 3 10 73 3 PC04300 PC04200 76 3 8 43 2 PC04200 PC04100 70.5 3 8 29 2 PC04100 PC04000 77.5 3 3 47 1 PC04000 PC03900 99.1 3 3 117 1 PC03800 PC03700 112 3 3 65 1 PC03700 PC03600 46.8 3 8 60 1 PC03600 PC03500 95 3 10 147 3 PC03500 PC03400 99.4 3 10 323 3
Other factors that need to be considered in deter-mining rehabilitation actions and techniques include service defects, sewer hydraulics, rehabilitation of other adjacent utilities (watermain and road), experi-ence with previous rehabilitation methods, existing pipe materials, funding availability and life cycle costs.
4 SUMMARY
The current state of practice in managing sewer sys-tems varies from city to city, resulting in inconsis-tencies in use of terminology, inspection, condition assessment, selection of rehabilitation methods, and record keeping. With the support from 10 munici-palities and two consulting companies, the NRC’s Urban Infrastructure Rehabilitation Program has completed a set of guidelines for the condition as-sessment and rehabilitation of large diameter sewers (> 900 mm) and access structures to assist municipal engineers manage buried sewers more effectively and consistently.
The approach provides a consistent and user-friendly method for data management, impact as-sessment, inspection, condition asas-sessment, and re-habilitation of the large sewers and the associated access holes. The use of unified definitions of
termi-nology and a consistent defect coding system per-mits sharing of information between utilities. Pool-ing scarce sewer condition data from various municipalities across Canada will enable the devel-opment and verification of statistical models for as-sessing sewer deterioration and predicting its re-maining service life.
The step-by-step approach starts with the man-agement of sewer inventory data. The ever-growing sewer systems warrant the use of electronic data-base. The impact assessment is an important step for prioritization. It considers the factors that either af-fect the likelihood of failure or the severity of the consequence of failure. The assessment rating is based on a scale from 1 – 5 with 5 being the highest impact. Impact assessment can be carried out prior to any physical inspections.
Inspections provide valuable information about the condition of the sewer pipes. A list of the types of defects and their definitions is provided to clarify the ambiguity or subjectivity that could interfere with the coding of the defects. The defects are sepa-rated into either service or structural defects. Defects are coded according to their severity and weights are assigned and combined to determine the condition of each pipe segment. Rating of both service and struc-tural condition is carried out on a scale from 0 to 5 with 5 indicating the worst condition.
The decision on whether to rehabilitate or not is based on the impact, the structural and service con-dition rating values. Although the decision-making approach does not take the place of engineering judgment, it can be used as a guide to assist in the decision-making process. The condition ratings of each pipe segment are used again to determine when to carry out the next inspection/condition assess-ment.
The concept and the user-friendly approach was demonstrated through a practical example of a col-lector sewer in the City of Ottawa. Although the guidelines for access holes are not included in this paper, the approach is similar. The impact assess-ment approach presented could also be applied, with some modifications, to other buried utilities such as watermains.
ACKNOWLEDGEMENTS
The work presented in this paper was part of a joint research project by NRC in partnership with the members of the project’s steering committee, Reg Andres, P.Eng. (R.V. Anderson Associates Limited), Mark Andrews, P. Eng. (M.E. Andrews & Associ-ates Limited), Russ Black, P. Eng. (Greater Vancou-ver Regional District), Terry Fedick, P.Eng. (City of Calgary), Wayne Green, P.Eng. (City of Toronto), John Hodgson, Ph.D., P.Eng. (City of Edmonton),
Betty Matthews-Malone, P.Eng. (Region of Hamil-ton-Wentworth), Seamus McDonnell, P.Eng. (Capi-tal Regional District), Ross Newman, P.Eng. (City of Waterloo), Gary Nieminen, P.Eng. (City of Re-gina), Balvant Rajani, Ph.D., P.Eng. (IRC/NRC), Cal Sexsmith, P.Eng., (City of Saskatoon) and Gerry Taylor, P.Eng. (City of Ottawa). The project was jointly funded by NRC, the municipalities and pri-vate firms that are associated with the steering committee members. Gerry Taylor of Ottawa pro-vided the sewer inspection video and data used in the example.
REFERENCES
ASCE. 1994. Existing Sewer Evaluation and Rehabilitation, ASCE Manuals and Reports on Engineering Practice No. 62. American Society of Civil Engineers.
Brown and Caldwell. 1998. Unlined Concrete Sewer
Assess-ment Condition AssessAssess-ment Manual, Submitted to the City
of Phoenix. (with permission).
City of Edmonton 1996a. Sewer Physical Condition Classifica-tion Manual, City of Edmonton TransportaClassifica-tion Department, Edmonton, AB., Canada.
City of Edmonton. 1996b. Standard Sewer Condition Rating
System Report, City of Edmonton Transportation
Depart-ment, Edmonton, AB., Canada.
EPA. 1999. Technical Approaches to Characterizing and
Cleaning Up Automotive Repair Sites Under the Brown-fields Initiative. United States Environmental Protection
Agency.
NASSCO. 1995. Manual of Practice - Wastewater Collection
Systems. The National Association of Sewer Service
Com-panies, Orlando, U.S.A.
NBC. 1995. The National Building Code of Canada, National Research Council of Canada.
WRc.1993. Manual of Sewer Condition Classification, Third Edition. Water Research Centre, UK.
WRc.1994. Sewerage Rehabilitation Manual. Third Edition. Water Research Centre, UK.
Zhao, J.Q. 1998. Trunk Sewers in Canada. 1998 APWA Int'l Public Works Congress Seminar Series, American Public Works Association. Las Vegas, Sept. 14-17.