CENTRIFUGE MODELING OF IMMISCIBLE FINGERING
IN POROUS MEDIA
by
Katsunori Banno
B.Eng., Nuclear Engineering (1987) Kyoto University, Japan M.Eng., Nuclear Engineering (1989) Kyoto University, Japan Submitted to the Department of Civil and Environmental Engineering
in Partial Fulfillment of the Requirements for the Degree of
MASTER OF SCIENCE OF CIVIL AND ENVIRONMENTAL ENGINEERING at the
MASSACHUSETTS INSTITUTE OF TECHNOLOGY September, 1996
©1996 Katsunori Banno. All rights reserved.
The author hereby grants to MIT permission to reproduce and to distribute publicly paper and electronic copies of this thesis document in whole or in part. Signature of Author-_
Department of Civil and Environmental Engineering August 9, 1996 Certified by
-Patricia J. Culligan-Hensley Assistant Professor, Department of Civil and Environmental Engineering
Accepted by
• -.... .... ... ...-...,m ~ , • 0O F T
A;IEHSC IN1L0OF TECC!O.HO'OC'
Joseph M. Sussman Chairman, Departmental Committee on Graduate Studies
OCT
1
5 1996
Centrifuge Modeling of Immiscible Fingering in Porous Media
by
Katsunori Banno
Submitted to the Department of Civil and Environmental Engineering on August 9, 1996 in Partial Fulfillment of the Requirements
for the Degree of Master of Science in Civil and Environmental Engineering
Abstract
Below the surface of the earth, where soil and water play major roles in regulating the transport of materials, various kinds of contaminants from industrial facilities, including light nonaqueous phase liquids (LNAPLs), have been spreading, and, as a result, deteriorating the quality of groundwater resources. Light nonaquaous phase liquids normally infiltrate downward through the vadose zone, driven by gravitational forces, until they reach the groundwater table or its capillary fringe. The remediation of soils in the vadose zone contaminated by LNAPLs has, to date, been performed by vapor extraction or bioremediation. To achieve an effective remediation result, delineation of the contaminated zone must be conducted as precisely as possible. However, the profile of infiltrating NAPLs in a porous medium is seldom uniform in the vadose zone, and instead often exhibits a preferential flow pattern called fingering.
The objectives of the study presented in this thesis are (1) to investigate the feasibility of scaling the phenomenon of fingered flow using the geotechnical centrifuge, and (2) to investigate predictions of the finger width based on soil parameters that are obtained by infiltration tests.
A two-layered system, in which the upper soil layer had a finer texture than the lower layer, was adopted for the centrifuge finger tests. For most of the finger tests, SOLTROL 220 (an LNAPL) infiltrated into a dry sand medium. However, one preliminary test was conducted using a partially saturated sand medium. For the prediction of finger width, the sorptivity and hydraulic conductivity of the sand medium were obtained both by direct measurement, and by curve-fitting to the cumulative infiltration data. The resultant parameters were compared with each other, and with the measured finger properties.
From the results of this study, it is concluded that scaling of finger properties using the geotechnical centrifuge is feasible. However, further investigation of the soil parameters
governing predictions of the finger width is required, before the finger properties measured in this study can be favorably estimated.
Thesis Supervisor: Patricia J. Culligan-Hensley
Title: Assistant Professor
Acknowledgments
I would like to express my deepest gratitude to Professor Patricia J. Culligan-Hensley for her advice, encouragement, and patience during the course of this research. It has been a great experience working with her; especially, through the thesis polishing process using email and fax, in which I could receive her clear-cut explanations to my questions.
I wish to express my gratitude to Mr. Stephen Rudolf for his craftsmanship. His skills were essential to complete this research, from the very beginning (the design of the equipment) to the very last (the operation of the centrifuge). I am also grateful to Mr. Sangkaran Ratnam, one of my friends, for revitalizing the long dormant centrifuge machine.
I gratefully acknowledge the people in KAJIMA Corporation for giving me not only this opportunity to study geoenvironmental engineering, but also the financial support during my two-year stay. I have received a lot of encouragement from colleagues in the company. Among these colleagues, I am especially grateful to Mr. Mitsuhiko Honda and Mr. Kakuyuki Takatsu for providing me with invaluable information on the centrifuge equipment.
I would like to thank my beloved wife, Chikako, for her constant encouragement and dedication to make our family happy. I will never forget the days in Boston we have shared. Finally, I would like to thank my children, Atsumasa and Kana. They are always cheerful and make my time enjoyable and tough times more bearable.
Table of Contents
A bstract ... 3
A cknow ledgm ent ... 5
Table of C ontents ... 7 L ist of Tables ... 9 L ist of F igures ... 11 C hapter 1 Introduction ... 13 1.1 B ackground ... 13 1.2 O bjectives ... 15 1.3 O utline of Study ... 16 C hapter 2 B ackground ... 17 2.1 Introduction ... 17
2.2 W etting Front Instability: Fingered Flow ... 17
2.2.1 C riteria on W etting Front Instability ... 18
2.2.2 Fingering in a Two-Layered System ... 20
2.2.3 C haracterization of Fingered Flow ... 2 1 2.2.4 A nalysis of Fingered Flow ... 24
2.3 C entrifuge M odeling ... ... 25
2.3.1 Principle of C entrifuge M odeling ... 26
2.3.2 Scaling L aw s for C ontam ination T ransport ... 26
2.3.3 A pplication to G eoenvironm ental Problem s ... 28
Chapter 3 Experimental M aterial and Test Equipment ... 31
3.1 Introduction ... 3 1 3.2 E xperim ental M aterial ... 32
3.2.1 Silica sands ... 32
3.2.2 SO L T R O L 220 ... 34
3.3 T he M IT G eotechnical C entrifuge ... 34
3.4 C entrifuge Strongbox ... 35
3.5 The M IT Diffusive Rainer and W indow Chimney ... 36
3.6 Peripheral A pparatus ... 37
3.6.1 C C D C am era ... 37
C hapter 4 T est P rocedure ... 39
4.1 Introduction ... 39
4.2 Infiltration T ests ... 39
4.3 Finger tests ... 4 1 4.3.1 Sam ple Preparation ... 4 1 4.3.2 Finger T est Preparation ... 44
4.3.3 C entrifuge T esting ... 45
4.3.4 Post T est M easurem ents ... 46
C hapter 5 T est R esults and D ata ... 47
5.1 Introduction ... 47
5.2 E stim ation of Sorptivity ... 48
5.2.1 M ethods to Fit the D ata ... 48
5.2.2 Results of the Infiltration Tests and Fitting ... 50
5.2.3 Prediction of Finger W idth ... 5 1 5.3 Finger Tests ... 52
5.3.1 Finger W idth and Separation ... 54
5.3.2 Finger V elocity ... 55
C hapter 6 D ata Interpreta tions and C onclusions ... 57
6.1 Introduction ... 57
6.2 Infiltration T ests and Sorptivity Estim ation ... 57
6.2.1 C om parison of D ata ... 58
6.2.2 Estimation of Sorptivity and Hydraulic Conductivity ... 60
6.3 Finger W idth Prediction ... 63
6.4 Scaling of Finger Properties ... 66
6.4.1 Finger Separation ... 66 6.4.2 Finger V elocity ... 67 6.4.3 Fingers in w et Sand ... 68 6.5 C onclusions ... 68 6.6 R ecom m endations ... 69 R ef e r e n c e s ... 7 1 T a b le s ... 7 5 F ig u r e s ... ... 9 7
List of Tables
Chapter 2 Table 2.1 Table 2.2 Chapter 3 Table 3.1 Table 3.2 Table 3.3 Table 3.4 Table 3.5 Chapter 5 Table 5.1 Table 5.2 Table 5.3 Table 5.4 Table 5.5(1) Table 5.5(2) Table 5.5(3) Table 5.5(4) Table 5.5(5) Table 5.5(6) Table 5.5(7) Table 5.5(8) Table 5.5(9) Table 5.5(10) Table 5.5(11)Stability of displacement for downward fluid flow ... Scaling relationships for centrifuge modeling ...
Fundamental properties of the original sands and the processed sands ... The methods used to measure the properties or the pertinent ASTM
c o d e s ...
The properties of SOLTROL 220 and water ... The MIT geotechnical centrifuge ... Specifications of the peripheral apparatus ...
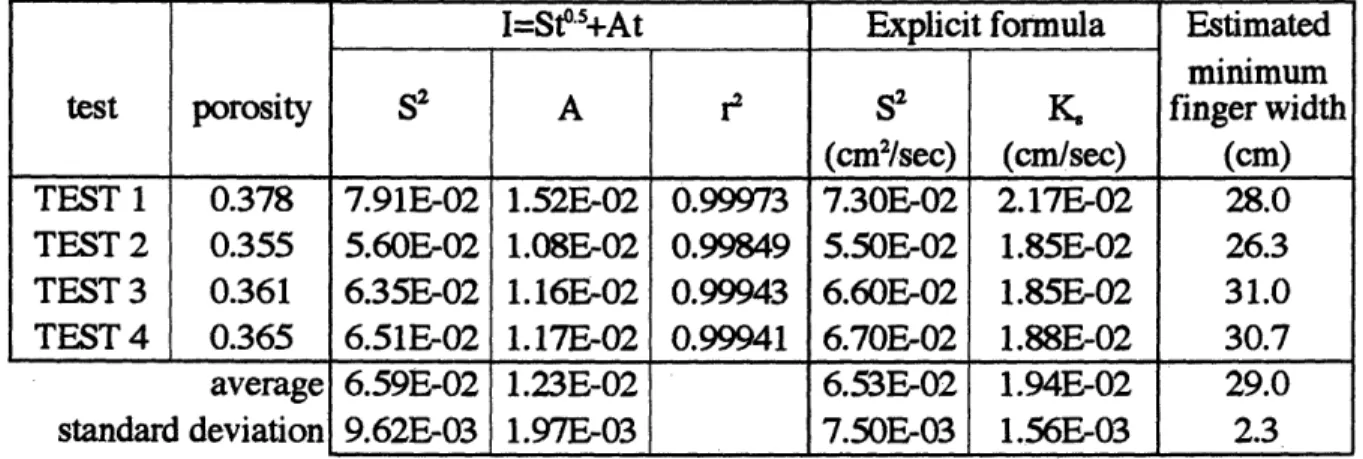
Set param eters for the infiltration tests ... Results of the parameter-fitting and the prediction of (minimum) fin g e r w id th ... M easured data of the infiltration tests ... Sum m ary of the finger tests ... Data sheet Data sheet Data sheet Data sheet Data sheet Data sheet Data sheet Data sheet Data sheet Data sheet Data sheet
for finger test for finger test for finger test for finger test for finger test for finger test for finger test for finger test for finger test for finger test for finger test
(katsu 1) ... (katsu 2) ... (katsu 3) ... (katsu (katsu (katsu (katsu (katsu (katsu (katsu (katsu 4 ) ... ... 5 ) ... 6 ) ... 7 ) ... 8 ) ... 9 ) ... 1 0 ) ... 1 1 ) ...
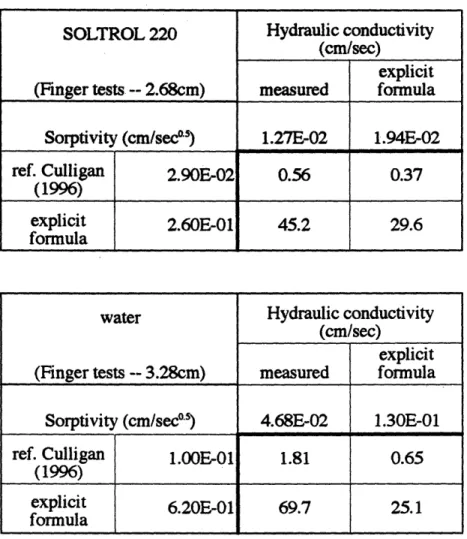
A summary of the properties to describe the infiltration for
S O L T R O L 220 and w ater ... Prediction of the minimum finger width with different parameter e s tim a tio n s ... Prediction of the finger width with different parameter estimations after taking into account the effect of the ratio of finger width to s e p a ra tio n ... Chapter 6
Table 6.1 Table 6.2 Table 6.3
List of Figures
Chapter 1 Figure 1.1 Chapter 2 Figure 2.1 Figure 2.2 Chapter 3 Figure 3.1 Figure 3.2 Figure 3.3(a) Figure 3.3(b) Figure 3.4 Figure 3.5 Figure 3.6(a) Figure 3.6(b) Figure 3.7 Chapter 4 Figure 4.1 Figure 4.2 Figure 4.3 Figure 4.4 Figure 4.5 Figure 4.6 Chapter 5 Figure 5.1(a) Figure 5.1(b)Figure 5.2(a)
Figure 5.2(b) Figure 5.3(a) Figure 5.3(b) Figure 5.4 Figure 5.5(1) Figure 5.5(2)Schematic diagram of LNAPL behavior in the subsurface environment ... 97
A conceptual finger moving downward through a porous medium ... Gravity effects in the model and the prototype ... Grain size distribution of the original sands and the sieved-out sands ... The platform of the centrifuge machine with the strong box and the CCD camera installed ... T he dim ensions of the strongbox ... P ictu res o f th e stron gbo x ... Diagram of the oil flow in the strongbox ... Installations of the strongbox and the CCD camera on the base plate ... T h e M IT d iffu siv e rain er ... T h e w in d o w ch im n ey ... Illustration of the raining process ... The apparatus for the infiltration tests ... The device to make flat the surface of the samples ... Cross-section through the soil model ... Grid attached to the lexan window ... Correction of the scale on the grid ... Diagram of G-level versus time for a typical centrifuge test ... 99 100 101 102 103 104 105 105 106 107 107 108 108 109 109 D iagram to explain the index 1 ... 110
D iagram to explain the index 2 ... 110
E xam ple of the curve fitting ... 111
Example of the curve fitting ... ... ... 111
Results of the infiltration tests and fitting curves by I=St-S+At ... .. 112
Fitting curves by the explicit infiltration formula ... 113
Typical profile of the fingers developed under 5.2G conditions (k a tsu 1 0 ) ... 1 14 Developing profile of the fingers: interval=3 minutes (katsu 1) ... 115
Developing profile of the fingers: interval=20 seconds (katsu 4) ... 115
Figure 5.5(3) Figure 5.5(4) Figure 5.5(5) Figure 5.5(6) Figure 5.5(7) Figure 5.5(8) Figure 5.6 Figure 5.7 Figure 5.8 Figure 5.9 Figure 5.10 Figure 5.11 Chapter 6 Figure 6.1 Figure 6.2
Developing profile of the fingers: interval=30 seconds (katsu 5) ... Developing profile of the fingers: interval=30 seconds (katsu 6) ... Developing profile of the fingers: interval=3 minutes (katsu 7) ... Developing profile of the fingers: interval=30 seconds (katsu 8) ... Developing profile of the fingers: interval=30 seconds (katsu 10) ... Developing profile of the fingers: interval=15 seconds (katsu 11) ... Grid pattern and the definitions of finger width and finger separation ... Assumed distribution of the degree of saturation in the sample ... Finger w idth under varying G -levels ... Finger separation under varying G-levels ... Profile of the fingers developed in wet sand (katsu 9) ... The finger velocity in the dry sand medium with varying G-levels ...
Two fitting curves for the grain size distributions ... The ratio of finger width to the finger separation at varying G-levels ...
116 116 117 117 118 118 119 120 121 122 123 124 125 126
Chapter 1
Introduction
1.1 Background
Below the surface of the earth, where soil and water play major roles in regulating the transport of materials, various kinds of contaminants from industrial facilities have been spreading, and as a result deteriorating the quality of our groundwater resources. Among these contaminants, nonaquaous phase liquids (NAPLs) have been attracting much attention, not only from technical experts, but also from the general public, because they are a ubiquitous cause of contamination that is difficult to remove from the subsurface environment.
Light nonaquaous phase liquids (LNAPLs) form one of two subgroups of NAPLs (the other subgroup containing dense nonaquaous phase liquids (DNAPLs)), whose density is lower than that of water. Many hydrocarbon products are categorized as LNAPLs, and gasoline spills from underground tanks are one of the most frequently encountered causes of underground contamination. If such spills move into a vadose zone, where the pore spaces in the soil are not saturated with water, the LNAPL will be driven
downward by gravitational forces, until it reaches the groundwater table or capillary fringe. After reaching the capillary fringe, the front of the LNAPL flow will basically move and extend itself laterally on the fringe (see Figure 1.1 for a schematic diagram of this behavior).
The remediation of soils contaminated by LNAPLs is a two-fold process. The LNAPLs, which are dissolved or trapped in the water-saturated zone below the water table, are first either pumped out with groundwater (called the "pump-and-treat" technique) or purged out to the vadose zone by injecting air. Next, the LNAPLs in the vadose zone are either extracted by vacuum, especially if they are volatile, or decomposed by microorganisms (so-called bioremediation) [Mercer and Cohen, 1990].
The remediation targeting the vadose zone is important because it reduces the amount of contamination that will reach the groundwater and hence pose a direct hazard to humans in the future. However, to achieve an effective remediation result, the delineation and prediction, if the contaminants are mobile, of the contaminated zone must be conducted as precisely as possible. Unfortunately, profiles of infiltrating NAPLs are seldom uniform and constant in the vadose zone, due to heterogeneity in the soil, animal burrows, and biological interventions, such as tree roots. Furthermore, it has been reported that unstable flow patterns of NAPLs are often observed, even in homogeneous geological media
[Kueper and Frind, 1988].
Fingering phenomenon, which can originate from unstable wetting front infiltration, was first observed by Hill [1952]. Since then, this topic has been investigated by researchers in chemical engineering, fluid mechanics, and soil science [Lu et al., 1994]. This phenomenon has recently gained much attention from contaminant hydrogeologists, because many of the contaminants found in the subsurface environment are immiscible to water and prone to form unstable flow patterns [Kueper and Frind, 1988]. The significance of this phenomenon is that, by bypassing most of the unsaturated zone, an unstable infiltrating fluid can reach the water table much faster than a fluid moving under the
uniform downward flow. In addition, the persistence of fingers from one infiltration cycle to the next has been observed [Glass et al., 1989a]. Therefore, finger pathways can act not only as the facilitating flow path during the first infiltration, i.e., in the event of spill, but also as persistent pathways through which subsequent spills can quickly travel.
To understand fingered flow, it is clear that systematic quantitative laboratory experimentation and field experimentation, together with theoretical analyses, are needed [Glass et al., 1988]. For laboratory scale experiments on fingering, extensive efforts are made to form homogenous samples, as reported by Glass et al. [1989c], in order to eliminate the effects of macropores and heterogeneities. However, in the field, it is virtually impossible to remove these factors.
The geotechnical centrifuge has been used to simulate stress conditions or deformations in a prototype that has larger dimensions than the model. The proportion of scale reduction from the prototype to the model is a linear function of the G-level that is applied to the model. Hence, if centrifugal scaling of immiscible fingering proves to be feasible, finger characteristics at a large scale can be modeled on the centrifuge with the minimized heterogeneity, often encountered in the field. The geotechnical centrifuge also can provide a deeper understanding of the phenomena, and furthermore it is cost effective [Knight and Mitchell, 1995].
1.2 Objectives
The objectives of the study presented in this thesis are:
1. to investigate the scaling of finger properties using the geotechnical centrifuge, and 2. to predict the finger width based on soil parameters independently obtained by
1.3 Outline of Study
This study is comprised of two types of tests: the infiltration tests and the finger tests. Six infiltration tests were conducted to obtain various soil parameters, and eleven finger tests were conducted to obtain finger properties under G-levels varying from 1G up to 11G, using the geotechnical centrifuge machine located in the geotechnical engineering laboratory in Massachusetts Institute of Technology.
A two-layered system, in which the upper soil layer had a finer texture than the lower layer, was adopted for the finger tests. The material used for the tests was sand. In the upper layer, the mean grain diameter of the sand was 0.6 mm. The sand in the lower layer had a mean grain diameter of 0.12 mm. The infiltrating fluid, SOLTROL 220 or water, was introduced to on top of the sand model, whose pores were filled with either air (dry) or water (wet). The majority of the finger tests concerned SOLTROL 220 infiltrating into a dry sand medium.
For the prediction of finger width, it is necessary to estimate the sorptivity and the hydraulic conductivity of the sand medium. These parameters were obtained both by direct measurement and by curve-fitting to the cumulative infiltration data. The resultant parameters were compared with each other, and with the measured finger properties.
Chapter 2
Background
2.1 Introduction
In this chapter, first, instability of flow in a porous medium is addressed, with a focus on fingered flow. Next, centrifuge modeling is discussed, starting with its general concept and moving into its application in the field of geoenvironmental engineering.
2.2
Wetting Front Instability: Fingered Flow
When a wetting fluid seeps downward through a porous medium, its front can form either a uniform edge or a wavy unstable edge. When the porous medium is homogeneous, the criteria that determine which type of wetting front displacement takes place are a function of the density and viscosity contrast between two fluids, the base flow rate, and the curvature of the initial perturbation [Hensley, 1995]. It is noted that even flow in an isotropic homogeneous geological medium, which is often regarded as a "homogeneous" medium, can encounter microscopic heterogeneities that cause perturbations.
Another perspective needs to be introduced to discuss flow instability. Philip [1975a,b] concluded that a wetting front will be unstable if there is a pressure gradient opposing the direction of flow behind the front. According to Glass et al. [1988], such situations can be simulated in systems where (1) a fine-textured layer overlies a coarse-textured layer (two-layered system), (2) the hydraulic conductivity increases with depth, (3) the initial moisture content increases with depth, and (4) infiltration occurs without ponding on the surface.
In this section, the criteria for wetting front instability are first described, and previous research on fingering in two-layered system is then briefly reviewed. Next, previous work that has intended to characterize and analyze the phenomenon of wetting front instability, which generally leads to the development of finger flow [Selker et al.,
1992b], is discussed.
2.2.1 Criteria on Wetting Front Instability
During infiltration of a fluid into a porous medium, it is possible that a part of its wetting front encounters inherent microscopic heterogeneity and receives a small perturbation. If destabilizing forces dominate over stabilizing forces, then a finger will develop from this perturbation [Kueper and Frind, 1988]. To explain this phenomenon, Hill [1952] derives a critical velocity, vc, beyond which a finger will develop from a perturbation. This velocity
is given by
kg(p1 -p )
vc Eq.(2.1)
k: the intrinsic permeability of the porous medium p : the density of the fluid, and
g : the dynamic viscosity of the fluid.
The subscripts, 1 and 2, denote the displaced fluid and displacing (or infiltrating) fluid, respectively. When the Darcy velocity, which is a product of the hydraulic conductivity and hydraulic gradient, exceeds the critical velocity, the wetting front becomes unstable.
Adopting this equation to downward fluid displacement in a porous medium whose pores are filled with another fluid, four situations are to be considered, depending on the combination of viscosity and density differences between the two fluids. Table 2.1 summarizes the four situations and a resultant condition of wetting front stability. Since there are various types of NAPLs, in terms of viscosity and density, every property of the involved fluids should be taken into account to decide which situation is dominant in a given system. For example, when LNAPL is infiltrating downward into a dry porous medium (g: positive, pl<p2 and Fl9<t), the density contrast has a destabilizing effect and
the viscosity contrast has a stabilizing effect. Hence, if the displacement velocity of the infiltrating fluid, v, is greater than the critical velocity, flow instability occurs.
Chouke et al. [1959] derived a critical wavelength (finger separation), .c, based on Eq.(2. 1), which is given as
AC - 2ar Y Eq.(2.2)
where o* is an effective surface tension. Effective surface tension in a porous medium is not a constant, but depends on microscopic conditions [Chang et al., 1994]; therefore, indirect approaches to determine the value have been pursued. One approach is made by the empirical equation given by Homsy [1987],
oL
* - Eq.(2.3)
where a is the molecular surface tension, and L is a macroscopic, horizontal dimension of
the problem. Another approach is made by fractal analysis, as reported by Chang et al.
[1994] (see Section 2.2.3).
2.2.2 Fingering in a Two-layered System
Hill and Parlange [1972] conducted an extensive study on fingered flow that developed in a two-layered system, in which the top layer had a finer texture than the bottom layer. The authors carried out ponded infiltration experiments in a clear acrylic chamber, whose width was 25mm, and examined the phenomena under a varied ponded depth and top layer thickness. Among the experimented observations that were made, the following points are noteworthy;
1. The fingers were seen to move downward at a velocity equal to the saturated hydraulic conductivity divided by the volumetric water content of the soil.
2. The fingers consisted of a saturated core surrounded by an unsaturated outer layer. 3. The width of the fingers was independent of the flow rate. (Glass et al.[1989b]
reported that the higher the flow rate, the wider and faster the fingers.)
4. The velocity and width of the fingers were affected by the initial soil water content. 5. There is a shallow "induction" zone developed at the boundary between the two layers.
Fingers developed below the induction zone.
These observations have since been verified by numerous researchers, including Glass et al. [1989c] for point 1 mentioned above, Glass et al. [1989a] for point 2, and Diment and Watson [1985] and Liu et al. [1994] for point 4. Chang et al. [1994] also report observing a zone whose characteristics are the same as the "induction" zone: they
postulate that it was caused by fine sand particles intruding from the overlying fine-texture layer.
It should be noted that the two-layered system was adopted for the experiments in this study.
2.2.3 Characterization of Fingered Flow
Observable variables that may be used to characterize the behavior of the unstable flow field include (1) the number of fingers, (2) the finger width, (3) the average moisture content in the fingers, (4) the finger separation, (5) the finger velocity, and (6) the magnitude of flow [Glass et al., 1989b]. Except for the magnitude of flow that percolates through a given finger, all variables listed above need to be directly measured, either by visual observation or by sensors installed in the medium [Selker et al., 1992b]. However, since visualization of flow in an opaque porous medium is difficult to perform, various kinds of techniques have been applied to achieve this purpose. These techniques, or experimental features, are reviewed for 2-D and 3-D cases as follows.
2-D
Most research work on fingered flow has been performed using a thin chamber, where two-dimensional fingered flow is forced to develop [e.g., Hill and Parlange, 1972; Glass et al., 1989 a,b,c]. Normally, one side of this form of chamber is transparent, so that data on the width, separation, and velocity of fingers can be obtained visually.
Two-dimensional chambers can also be used to investigate the mechanism that regulates the fingered flow, and to elucidate a moisture distribution in fingers. The former is represented by the research reported by Lu et al. [1994], and the latter is represented by the research conducted by Glass et al. [1989a]. Lu et al. [1994] used glass beads and water as a porous medium and an infiltrating fluid, respectively, and investigated fingered flow
infiltrating into dry or wet media at a microscopic level. Their study demonstrated that the wetting front is water saturated when the medium is initially dry, while the front is unsaturated when the medium is initially wet. Glass et al. [1989a] developed an experimental technique to obtain a relative moisture content in a given finger. Applying this technique, which uses high-output fluorescent light bulbs and a light-sensitive photoresistor, they verified empirically that there is a moisture content distribution in each finger as shown in Figure 2.1.
3-D
As noted above, two-dimensional chambers are useful to quantitatively investigate characteristics of fingered flow. However, there is uncertainty in deciding whether 2-D finger properties can be used to predict three-dimensional finger patterns, which are those most often encountered in a real geological media. This concern is also expressed by Held and Illangasekare [1995], who state that "Any experiments conducted in one- or two-dimensional setups impose restrictions on the free fluid movement and thus on the generality of use of the results."
Held and Illangasekare [1995] studied the displacement of water by DNAPL (dense nonaqueous phase liquid) in a homogeneous porous medium. The tank used in their study had dimensions of 120cm in height and 45cm x 45cm in cross-section, and consisted of 16 individual segments, each of which was assembled vertically together. The DNAPLs used were dyed with an organic red dye and fluorescence to contrast the fluids under ultraviolet light. This visualization technique was applied to each cross-sectional area, after disassembling each segment, to obtain 3-D finger patterns. In their work, these authors found that the experimental data agreed well with theoretical predictions by Chouke et al. [1959], which define the viscosity and density conditions where fingered flow can be observed.
Another experimental study on 3-D fingering is reported by Selker et al. [1992a] and Glass et al. [1991]. These researchers used a 40cm-high and 29.7cm-i.d. column that was formed with four 10cm-height rings. For each test, dry sand and distilled water were used for the porous medium and the infiltrating fluid, respectively. Before ending each test, dyed water, instead of distilled water, was applied to delineate the fingered flow pathways. These dyed pathways were then visualized both by tracing the cross-section of the column, which could be separated at the ring connections by the insertion of a steel plate, and by freezing the pore water and removing the surrounding loose dry sand. Selker et al. [1992a] demonstrated that the measured finger diameter was within 10% range of the predicted value that is calculated by multiplying the 2-D finger width by 4.8/n.
New approaches for visualization
Several approaches to visualize fingered flow in a porous medium, other than the techniques mentioned above, have been implemented to date. Posadas et al. [1996] studied infiltration of water through a cubic column of two-layered soil using images obtained by magnetic resonance tomography. As another approach, Liu et al. [1993] applied high-intensity synchrotron X-rays to measure water content in water fingers in soils whose pore spaces were filled with water and air. These techniques can be applied without disturbing the porous medium, in contrast to the verification method accompanied by soil excavation. Thus, they allow us to obtain information about developing fingers in real time. Furthermore, these nondestructive techniques can give data of high resolution depending on the method applied. Reviewing these visualization techniques, it can be noted that these methods are promising way to evaluate finger patterns in a more precise manner.
2.2.4 Analysis of Fingered Flow
To analyze the development of fingered flow in the vadose zone, both nonlinear characteristics of the flow in an unsaturated porous medium and microscopic heterogeneity should be considered. However, since neither of these topics is easily characterized either separately or together, no single approach that incorporates both has yet been made. Examples of approaches made to date include a linear stability analysis by Parlange and Hill [1976] and a dimensional analysis by Glass et al. [1989b]. A brief outline of the dimensional analysis and the fractal analysis approach to analyze finger properties, such as wavelength, are presented below.
Dimensional analysis
Glass et al. [1989c] applied dimensional analysis at the "finger scale" and the "chamber scale" to derive formulations for finger size (finger width or finger diameter in a 3-D system) and velocity as a function of porous media properties and initial/boundary conditions. Starting with the nondimensionalization of Richard's equation [Richards, 1931], the authors derived formulae to estimate the finger width, d, and the finger velocity, u, These formulae were further tested in subsequent studies [Liu et al., 1994; Selker et al., 1992a] and simplified to
da ,, and Eq.(2.4)
Kf
(Of
-o,.)
'
Uf
-[(
)(o.s
Eq.(2.5)
S
-0 1)(0.1+
0.9q
where 0, K, q are the moisture content, the hydraulic conductivity, and the flux, respectively. The subscripts, i, f, and s denote the initial conditions, the conditions at the
fingers, and the conditions at saturation, respectively. Sf is the sorptivity at the finger tip, which can be approximated by
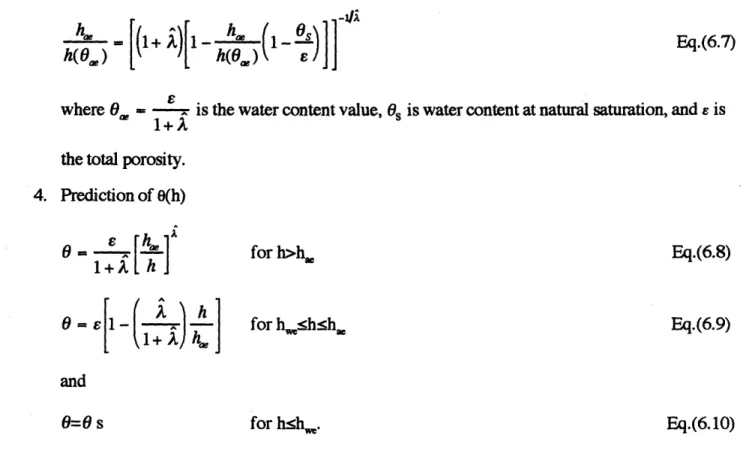
S2- P( + , - 20 DdO
Eq.(2.6)
where D is diffusivity [Parlange, 1975]. Eq.(2.6) is further explained in Section 6.2.2 of this thesis.
Fractal analysis
Chang et al. [1994] used fractals as a tool to estimate effective surface tension, a*, as it appeared in Eq.(2.2), and to describe fingering during infiltration of water into two-layered soils. They conducted seven infiltration tests, three of which used a homogeneous medium and the rest of which used a two-layered system. During each test, the wetting front profile was traced at a designated time interval, which enabled the length of the wetted perimeter to be measured afterwards. They considered this length, which takes a greater value as the front becomes more unstable, to be a function of the investigated scale length (or mean pore size in their research) and various fractal parameters. Using these fractal parameters, the effective surface tension can be estimated. Thus, the maximum wavelength, X. (--= hXc), can also be estimated.
2.3 Centrifuge Modeling
In this section, the principle of centrifuge modeling is first explained, and scaling laws for contaminant transport are presented. Next, some previous studies that relate to its application in environmental geotechnology are briefly summarized.
2.3.1 Principle of Centrifuge Modeling
The principle of geotechnical centrifuge modeling, which relates a small scale model to a corresponding prototype, is concisely explained by Hensley and Schofield [1991]. As shown by Figure 2.2, the mechanical behavior of a prototype soil mass under the earth's gravity g, can be replicated in a small scale model of 1/N experiencing a centrifugal force of N-g. Hence, if a model 1/N sized that of the prototype is accelerated to N-g, the stress distribution throughout the model will be identical with that throughout the prototype.
In addition to reproducing prototype stress levels, centrifuge modeling can offer an accelerated time scale for seepage phenomena as a result of the increase in self weight of the permeant and the decrease in size scale. If the model is accelerated to N times that of the Earth's gravitational acceleration, the seepage velocity is increased by a factor of N, while the length dimensions are reduced by a factor of 1/N. Therefore, the time required for prototype transport processes to occur is reduced by a factor of 1/N2 in the centrifuge model.
2.3.2 Scaling Laws for Contamination Transport
Centrifuge scaling laws for contamination transport in a porous medium were presented by Arulanandan et al. [1988] utilizing dimensional analysis. Table 2.2 summarizes some scaling relationships for basic properties describing flow. In this table, N is the gravity scaling factor, and two subscripts, m and p, refer to the "model" and "prototype," respectively. Furthermore, it is assumed that identical material is used in the model and in the prototype, which means that the intrinsic permeability of the porous medium, k, and the density and viscosity of the fluid, p and p, are identical for both systems.
In conducting their dimensional analysis, Arulanandan et al. [1988] introduced eight linearly independent dimensionless groups to discuss the scaling laws for solute
transport. Since the topic of this thesis is immiscible fingering, only two of these dimensionless groups (112 and rs) are mentioned below: the others being relevant to
miscible flow alone. (The readers are referred to Arulanandan et al. [1988] for a full discussion on all groups.)
* I, - pvd (Reynold's Number, Re)
n2 should be kept below the critical value (Re<1) for flow in porous media [Bear, 1972] to
ensure the validity of Darcy's Law. For the tests reported in this study, the Reynold's number was less than 0.3.
* I pgLd (Capillary effects number)
Using the relationships presented in Table 2.2, ns in the model is identical with that in the
prototype. For modeling problems involving the contamination of unsaturated soil, there is concern that where the gravitational gradient is small compared to the suction gradients, the use of a centrifuge for scaled model testing may be unnecessary, as noted by Arulanandan et al. [1988]. Because the topic of this thesis concerns contaminant transport in unsaturated soil, the usefulness of the centrifuge for investigating this problem needs to be verified through experiments.
One method to verifying the feasibility of centrifuge modeling is to perform "modeling of models" [Li et al., 1994]. This is standard centrifuge modeling practice, whereby a test is run at two or more different G-levels [Cooke, 1993]. If the scaled results of the tests at different G-levels are close together, it is assumed that centrifuge modeling of a given system is feasible.
2.3.3 Application to Geoenvironmental Problems
The main advantages of centrifuge models are the reproduction of prototype stress distributions and the acceleration of certain time effects [Cooke, 1993]. To illustrate the advantages of the centrifuge modeling in geoenvironmental engineering, several projects on contaminant transport have been performed, and in this subsection some of the projects are
reviewed.
Mitchell [1994] investigated the feasibility of using a "flexible, no lateral strain" centrifuge-test-cell to evaluate clay liner-permeant compatibility. The background for this project was that no laboratory permeability tests were available to reproduce a sample condition in which an actual field effective stress could be approximated, and which, at the same time, no lateral strain could take place. The authors concluded that centrifuge testing appears to be a viable alternative to laboratory bench testing for this problem, and that this testing method has the potential to be standardized in order to measure clay liner permeability.
Hensley and Schofield [1991] presented the results of centrifuge tests that aimed to study the long term transport of contaminants in the soil surrounding an engineered landfill site. In this study, prototype times of up to 30 years were modeled, and the test results illustrate the potential of the centrifuge in providing good-quality experimental data for the verification of existing mathematical transport codes.
There has been a lot of research conducted on the basic transport mechanisms under varying system settings: for example, uniform infiltration of immiscible liquid in homogeneous unsaturated porous medium [e.g., Reible, et al., 1990], nonsorbing, nonequilibrium solute transport in a locally inhomogeneous soil [Li et al., 1994]. However, the application of centrifuge modeling to realistic configurations, such as the landfill site problem reported by Hensley and Schofield [1991], is not yet extensive. Examples of where more project oriented work on the centrifuge could be extended include
investigations into remediation by soil flushing as initiated in the research work reported by Ratnam [1996] or by hydraulic fracturing as suggested by Mitchell [1991].
Chapter 3
Experimental Material and
Test Equipment
3.1 Introduction
In this chapter, the materials and the equipment that were used for the tests are explained. The selected porous medium was a sand with an appropriate grain size distribution. The infiltrating fluid was an aliphatic oil, SOLTROL 220. Most of the apparatus that were used to control the G-levels, and to measure or record the results of the tests, were already installed in the MIT geotechnical engineering laboratory: these included the MIT geotechnical centrifuge, the MIT diffusive rainer and a monitor with a videocassette recorder. Equipment newly manufactured for the project included the strongbox and the window chimney. The strongbox was the main apparatus for the tests: it contained the sample box and the oil circulation system. The window chimney was used for the sample preparation. The CCD (Charge-Coupled Device) camera was purchased for the project, and installed for use on the centrifuge machine.
3.2 Experimental Material
To conduct a series of tests to investigate fingered flow, two types of materials were considered as candidates for the porous medium. One was silica sand, and the other was glass beads. Though the glass beads are excellent for flow visualization if accompanied by a suitable lighting, silica sand
was thought to be more appropriate for this study because of the following reasons:
* Silica sands are readily available in the MIT geotechnical engineering laboratory in large
quantities.
* Ratnam [1996], for his study on oil behavior in soil, obtained different results when he used
glass beads for the porous material instead of sands.
* Most of the research on the finger flow [e.g., Glass et al., 1989a,b,c; Selker et al., 1992a,b]
have been conducted using sand as a material for the porous medium.
The infiltrating fluid used in this research was SOLTROL 220 (hereafter simply called "the
oil"). This oil was selected because it has a very low volatility at room temperature, which is
considered important in terms of safety. In addition, several studies [e.g., Illangasekare et al.,
1991] have used this material to investigate LNAPL flow in porous media at a laboratory scale.
3.2.1 Silica sands
Two kinds of sand, each with different grain size distributions, were necessary to prepare the
two-layer system. The sands used were two New Jersey sands, namely the 40P sand and the 100P
sand. These numbers indicate the grain size of the sand: for example, the average grain size of the
40P sand is close to the mesh size of the No. 40 sieve (0.42 mm), although there is a certain
distribution of grain sizes around the average.
The fundamental properties of each sand, such as chemical composition, grain size
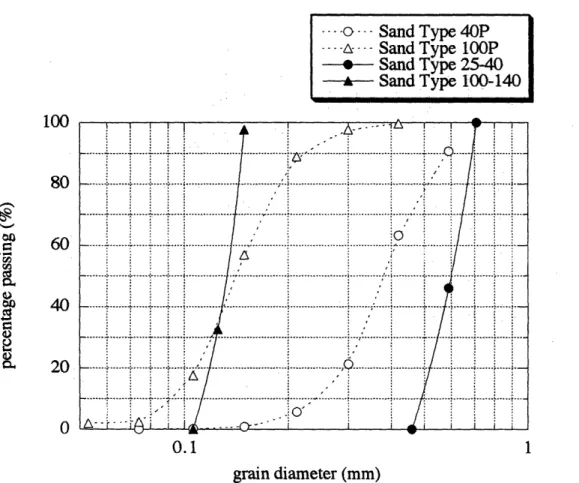
distribution, and maximum and minimum densities, are reported by Ratnam [1996]. Figure 3.1
shows the grain size distributions of both sands. The sands have a fraction in common whose grain size falls between 0.15 mm and 0.4 mm. In preliminary tests that used water as the infiltrating fluid, fingering was not developed at the boundary between the top sand layer and the main sand layer. Because it was considered that there might not be a distinctive enough contrast in seepage characteristics, such as permeability and sorptivity, between the sands, it was decided to sieve out certain fractions of each sand. Out of the 40P sand, the portion which passed through the #25 sieve (0.71 mm), but was left on the #40 sieve (0.42 mm), was removed. Out of the 100P sand, the portion passing through the #100 sieve (0.149 mm), but was left on the #140 sieve (0.106 mm), was removed. Hereafter, the former sand is called the 25-40 sand, and the latter the 100-140 sand. The resultant grain size distributions following sorting are also presented in Figure 3.1. It should be noted that finger flow was observed in the sample using these processed sands and water as the infiltrating fluid.
In addition to sorting, the sands were washed with tap water and a window cleaner, because very small clay particles or oil fractions that were stuck to the sands' surface might affect flow in each medium. The sands, at volumes of 400 to 500cm3, were first poured into a 1000 cm3 cylinder and washed with tap water. After draining the water, a small amount of detergent (spray a few times) was added, and more water was then poured into the cylinder. Dozens of sets of rinsing and draining were repeated until no foam was seen on the water surface. The washed sands were dried at room temperature over a few days. It is noted that one of the infiltration tests reported later in this document used sand that was not washed with the detergent, instead, it was washed only with water.
The specific gravity, maximum/minimum void ratios and hydraulic conductivity for each sand are summarized in Table 3.1. For comparison, the properties that were obtained by Ratnam [1996] for the original sands are also presented in the same Table. The methods used to obtain these properties or the pertinent ASTM codes are summarized in Table 3.2.
3.2.2 SOLTROL 220
The properties of the oil are summarized in Table 3.3, together with the properties of water. The viscosity of the oil is 4.12 times greater than that of water, and the density of the oil is 0.79 times lower than that of water. Since the hydraulic conductivity, K, is related to the density of the fluid, p, the dynamic viscosity of the fluid, It, and the intrinsic permeability of the porous medium, k, through the equation, K = Pgk, the hydraulic conductivity of the oil in a given porous medium is
computed to be about one fifth of the hydraulic conductivity of water in the same medium.
Sorptivity, another parameter that regulates flow in porous media, is also expressed in a similar way. Philip [1957] first proposed the term "sorptivity, S," and reported that the parameter can be described by the following formula:
S - s Eq.(3.1)
where a and R are the surface tension and viscosity of the fluid, respectively, and H is a contact angle at the liquid-solid-air line of contact. The last parameter in Eq.(3.1), s, which is called "intrinsic sorptivity", depends on the geometry of the porous medium. Using the properties presented in Table 3.3, the sorptivity of the water is calculated to be 3.4 times larger than that of SOLTROL 220 in an equivalent medium. Here, it is assumed that the contact angle for both cases is the same.
3.3 The MIT Geotechnical Centrifuge
Table 3.4 summarizes the specifications of the MIT geotechnical centrifuge machine and Figure 3.2 gives a picture taken of the platform of the centrifuge machine. The machine is a balance-beam type
centrifuge and it has two swinging platforms at both ends. The maximum G-level that the machine is capable of is 200 G, and its load capacity is 13,620 G-kg. Therefore, one can test a sample box whose weight is up to 68.1 kg under maximum G conditions.
3.4 Centrifuge Strongbox
A new strongbox was made for this study. Figure 3.3(a) shows the dimensions of the strongbox, and Figure 3.3(b) presents some pictures of the strongbox. The strongbox is made of T6061 aluminum plates and a polycarbonate resin, lexan, for the transparent window through which one can monitor and record images of the flow patterns. The strongbox plates and the window were assembled with stainless screws and sealed with an application of silicone rubber so that there would be no leakage during the tests.
The strongbox assembly consists of three parts; the sample box, the pump box, and the oil storage box. The sample box has dimensions of 30.5(cm) x 22.9(cm) x 2.3(cm). The width, 2.3(cm), can be reduced to 1.1(cm) or 0.8(cm) using spacers that are made of PlexiglasTM. The
pump box stores the peristaltic pump, which delivers the oil in the oil storage box to the sample box. The pump box can be connected to the sample box via three 5 mm diameter holes, which are located 1.5cm above the base of the box. During testing, these holes served as drainage holes for the oil that had infiltrated through the sand medium. The oil storage box can hold 10,000cm3 of
oil, though normally one test consumed only 500 cm' of oil.
To maintain a fixed depth of ponded liquid, a small slot was cut in the top edge of the aluminum plate that divides the sample box and the oil storage box. During each test, the flow, supplied by the shower device, could either seep downward into the porous medium or return to the oil storage box through the slot. The shower device is made out of an aluminum tube whose diameter is 2.54cm. Both ends of the tube were sealed, and seven small holes (eachi 1 mm in diameter) were opened at equal intervals along the tube. Figure 3.4 shows a diagram describing the oil flow in the strongbox.
During a centrifuge test, the strongbox was mounted on the system base plate, which was firmly screwed to the platform of the centrifuge machine. The base plate is made of the T6061 aluminum plate, and its weight is about 10 kg. The CCD camera was also installed on the base plate. Figure 3.5 shows the setup of the strongbox and the CCD camera on the base plate. To improve the monitoring image taken by the camera, a black foam board was also attached to the wall of the platform as seen in Figure 3.2.
3.5 The MIT Diffusive Rainer and Window Chimney
The MIT diffusive rainer and the window chimney were used to prepare the samples in the sample box. The rainer consists of a sand storage box at the top of a chimney that encloses the falling sands. In the chimney, there are slots to hold several wire meshes that contribute to make a uniform plane distribution of falling sand. For this study, two wire meshes were installed at levels of 20cm and 30cm, respectively, from the top edge of the strongbox. The sands in the storage box were regulated to fall by sliding two plates, each with 24 holes that were aligned in a grid pattern of 4 x 6, relative to each other. Figure 3.6(a) shows a picture of the MIT diffusive rainer and the window chimney.
In order to prepare each sample effectively, a new window chimney was specially manufactured for this study. Because the rainer was originally intended to prepare samples with a wider area [e.g., Nai, 1993; Ratnam, 1996], it was not suitable for use with the thin sample box without modification. The new window chimney consists of a small chimney whose cross-section has the same dimensions as that of the sample box. The height of the window chimney is 10.5 cm, which is high enough to prevent any sand falling outside the sample box from re-entering the box. A picture of the window chimney can be found in Figure 3.6(b). During sample preparation, three out of the four lines of holes in the sliding plates of the sand storage box, were sealed with tape to reduce the amount of sand falling onto the outside of the window chimney (see Figure 3.7). Initially, it was a concern that static electricity might be built up during sample preparation as a
result of friction between the falling sand and the window chimney; however, no significant effect was noted when a comparison was made between data collected with the chimney electrically grounded, and data collected with the chimney ungrounded. The relative density of the samples prepared by this method was never less than 95%.
3.6
Peripheral Apparatus
The specifications of the peripheral apparatus are summarized in Table 3.5. Except the CCD camera and its control box, all the peripherals used in the study were already available in the MIT geotechnical engineering laboratory. The following subsections are intended to briefly comment on the two peripheral apparatus that were actually mounted on the centrifuge machine.
3.6.1 CCD Camera
The Panasonic CCD camera unit, GP-KS 162, was selected for the monitoring camera installed in front of the lexan window of the strongbox (refer to Figure 3.5) for the following reasons:
* The camera is small enough that is can be mounted on the system base plate, where there is a tight restriction for space. In addition, the basic CCD camera head can be fitted with a wide angle lens or a super wide angle lens that helps reduce the distance to the object. For this work, the super wide angle lens was selected. For this reason, the image recorded by the camera was distorted toward the periphery of the monitor. Calibration of the effects of this distortion is explained in Section 4.3.2 of this thesis.
* The camera has a reasonable weight and could function under 100G conditions, or over.
Signals from the CCD camera unit can be retrieved either by normal video signal (2 cables) or by S-VHS signal. The S-VHS signal produces better image data than the former; however, this method of signal retrieval requires 5 cables to hook onto the slip rings. For the finger tests, the
normal video signal was used. The retrieved cables were connected to the monitor, AIWA VX-T1400KE2, through the videocassette recorder, Panasonic AG-6720A-P. These two apparatus were used not only for monitoring during the tests, but also for replaying the recorded data to obtain the required measurements of finger velocity.
3.6.2 Peristaltic Pump
A peristaltic pump was selected to control fluid delivery during the centrifuge tests because this form of pump can be operated normally under the higher G conditions. The pump was placed in the pump box without any screws to fix it to the box, because the accelerated gravitational force always acted to push the pump onto the base of the box. The flow rate of the pump under different conditions was determined by preliminary tests. The flow rate always had to be adjusted to the width of the sample box; i.e., if the flow rate was more than the sum of the infiltrating oil and the returning oil, the oil would overflow the strongbox. A detailed description of the specific pump used in this test series is given by Ratnam [1996].
Chapter 4
Test Procedure
4.1 Introduction
This chapter describes the procedure of the sorptivity measurement tests and the finger tests in detail. The sorptivity was estimated from data given by ponded infiltration tests; and the test setup is explained below, together with the properties of packed sand. The finger tests were conducted under varying G-levels, from 1G up to 11G. Three tests were conducted under 1G conditions and eight tests were conducted under an increased G-level using the geotechnical centrifuge. The following subsections describe the sample preparation procedure, which applied to every test, and the centrifuge testing procedure. The 1G tests followed the same step as the centrifuge tests, but were not performed on the centrifuge.
4.2 Infiltration Tests
Sorptivity is an important parameter used to describe cumulative infiltration [Marshall and Holmes, 19881, as well as to predict a finger width at 1G conditions. In this section, the experimental
procedure for infiltration tests is explained. Two methods to estimate sorptivity, both of which utilize the data obtained by the infiltration tests, are explained in Section 5.2.
Four tests, TEST 1 through TEST 4, were conducted using the oil as the infiltrating fluid, and two tests, TESTs 5 and 6, were conducted using water as the infiltrating fluid. TESTs 1, 5 and 6 used a slim and long transparent cylinder, whose internal diameter was 2.54 cm and whose length was 25 cm. TESTs 2 through 4 used a cylinder that was 5.6 cm in internal diameter and 9 cm in length. Though all the finger tests made use of the detergent-washed sand, the infiltration tests were done additionally for both water-washed sand and unwashed sand. Figure 4.1 shows the schematic layout of the infiltration tests. The procedure of the test is explained below:
1. Plug one end of the cylinder using a rubber plug with a 5 mm hole at its center. This hole works as an air release.
2. Pour a small amount of sand into the narrow space between the cylinder and the rubber plug. Since the plug has a conical shape, there is a small gap to be filled. If this space is left open, it may cause a disturbance in the packed sand.
3. Place a circle of filter paper, whose diameter is a little less than the inner diameter of the cylinder, above the rubber plug. The filter paper assures an undisturbed packed sand column. 4. Weigh the apparatus before packing the sand. For this test series, the bulk density of the
packed sand was computed by dividing the apparatus weight difference before and after packing, by the volume of the packed sand.
5. Pack the sand using the MIT diffusive rainer. This ensures that the packed sand is as dense and as uniform as possible. The weight of the sand-packed cylinder must be measured in order to calculate the sand's bulk density.
6. Place a small circular paper filter at the center of the sand surface. This is to prevent erosion on the surface of the sand.
7. Pour the oil onto the sand surface so that a constant head is imposed by a constant ponded depth of oil. The ponded depth for each test reported here was between 6 mm and 11 mm.
8. Record the movement of the infiltrating front with a camcorder. Because the seepage is relatively fast, a visual reading may be subject to a serious error.
9. Prepare a cumulative infiltration curve by replaying the infiltration experiment on the viewer of the camcorder.
4.3 Finger tests
To obtain a series of data that could be used to investigate unstable infiltration under varying G-levels, eleven fingering tests were conducted: three tests under 1G conditions and eight tests under higher G-levels using the geotechnical centrifuge. It took a day to complete one test from the preparation of the sample to the finger test itself. The following subsections describe the sample preparation, which applied to every test, and the centrifuge test procedure. 1G tests followed the same steps as the centrifuge tests, but were not performed on the centrifuge.
4.3.1 Sample Preparation
Because flow in a porous medium is affected by macroscopic/microscopic heterogeneity, it was imperative to prepare a well-conditioned, very homogeneous sand model for these tests. To fulfill this end, the sands supplied by the manufacturer were sieved out and washed thoroughly using the detergent described in Chapter 3, and the MIT diffusive rainer was used for sample preparation. It is noted that the sand for the top layer was not washed, because the finger properties are controlled only by the properties of the main layer [Culligan et al., 1996]. The sample was prepared in the sample box by enacting the following steps:
1. Preparation for the drainage holes: The three holes that connect the sample box and the pump box were covered with a small piece of paper to prevent erosion of sands through the holes.
The papers had several pinholes that were used to release the air in the sample during the finger tests.
2. Installation of the spacer: Two spacers were used to reduce the width of the sample.
3. Preparation of the bottom drainage layer. This layer consisted of sand left on the #25 sieve originating from the 40P sand. 125 g of this coarse sand fraction was rained evenly into the sample box using a funnel. The final height of the bottom layer was 2.3 cm. No filter was placed on top of this layer.
4. Measurement of the weight of the box, m1
5. Preparation of the main layer.
(1) The window chimney and the MIT diffusive rainer were placed on top of the strongbox. (2) One wire mesh was set in the rainer at a height of 20 cm from the top edge of the strongbox. (It was confirmed that one mesh was sufficient to diffuse the falling sands to a uniform state.)
(3) The 25-40 sand was poured into the sand storage box of the rainer and leveled by an aluminum plate.
(4) The sand was rained into the sample box. The level of the accumulated sand was monitored through the lexan window. This process normally took about one minute before the height of the sand layer exceeded, by one centimeter, the designated sand level, which was 13.2 cm from the box base or 5.0 cm from the ultimate top level. It is noted that the amount of sand that can be contained in the sand storage box is normally sufficient to form the main layer in one raining process. However, in cases where it was not sufficient, the front cover of the rainer was removed, and the sand that had not gone into the sample box was taken out to fill the storage box again. There was concern that this procedure might induce a discontinuity in the sand medium, but no obvious effect on the finger profiles was observed.
(5) To make the sand layer as dense as possible, the window side of the box was evenly tapped on the lexan window with a plastic hammer. The tapping was continued until no more subsidence of the sand surface occurred. Usually the subsidence was a few millimeters.
(6) Since the surface of the sand right after the raining was irregular, and since there was an excess amount of sand to be removed, a special device was used in order to form a flat surface. The device (see Figure 4.2) was made of a thin aluminum plate whose width was less than each sample width to allow a few sand grains to go around while raking and sweeping. The length of the device that goes into the sample box was adjusted by two paper clips. Due to static-electricity, the inner side of the window was covered with sand particles. It was anticipated that if these sand grains left unremoved, the window area might serve as a preferred flow path in the top layer. Therefore, the sand particles were wiped with a paint brush moistened with water.
(7) The surface of the main sand was covered by a strip of tissue paper to prevent fine sand particles from the top layer being transported into the main layer during the finger tests.
6. Measurement of the weight of the box, m2: The bulk density, y, dry density, y d, void ratio, e,
and relative density, D, of the main layer were computed using the following equations:
mn - m (g)
S30.5(sample length)sample length)13.2(smple height). (sample width
X
an 3)Yd Vt
1+ 0.0017(- wN,the natural water content of the sand) e 2.64(- G,)1
Yd
0.85(- e.) - e
D,-0.85 - 0.59(- ei )
7. Preparation of the top layer. The same procedure when making the main layer was adopted, except that two wire meshes were installed in the rainer. The surface of the top layer was protected by a strip of paper filter whose thickness was about 0.4 mm. When applying the oil through the shower device, this paper protected the top fine sand layer against erosion.
Figure 4.3 shows the dimensions of each layer. The height of the main layer was 13.2 cm and that of the top layer was 5.0 cm; therefore, the total height of the three layers was 20.5 cm. Since the slot for the oil return was cut 1.5 cm from the top edge of the box, the ponded depth of oil on top of the sand sample was 0.9 cm. As it was observed that there was a 1 mm rise of the oil surface due to capillarity, the actual pond depth was regarded as 1.0 cm.
While the sand used in most of the experiment was initially dry (w,-0.17%), the sand media for the test, katsu 9, had a moisture profile in it. For this test, the sample box was saturated by water, which was fed through the drainage holes that were used to connect the sample box and the pump box. After the pump box was filled with water, the sample was left to saturate overnight. The following day, it was drained under a centrifugal acceleration equivalent to 4.2 G for 20 minutes.
4.3.2 Finger Test Preparation
Before the strongbox was mounted on the platform of the centrifuge machine, a 1cm x 1cm reference grid was attached to the outside of the lexan window, and the connection to the oil delivery system was made. The oil was poured into the oil storage box after the strongbox was mounted on the platform, and just before the finger test commenced.
The reference grid used in the experiments covered 25cm in the horizontal direction and 18cm in the vertical direction, as shown in Figure 4.4: the upper right corner of the grid was assigned as the origin, (x,y)=(0,O). Because the CCD camera with the super wide angle lens was placed very close to the window, a point on the grid shown in the monitor does not correspond exactly to the same point on the sample. (For example, in Figure 4.5, the point A on the grid reads somehow upper point on the sample, A'.) This trend is significant toward the periphery. To correct this difference, a calibration diagram that correlates the points on the sample to the points on the grid was prepared. First, a pattern of 1cm x lcm squares was placed inside the lexan window so that the pattern matched exactly to the grid pattern that was attached to the outside of the


![Figure 1.1 Schematic diagram of LNAPL behavior in the subsurface environment [from Mecer and Cohen, 1990]](https://thumb-eu.123doks.com/thumbv2/123doknet/14217511.483019/97.918.207.664.350.809/figure-schematic-diagram-lnapl-behavior-subsurface-environment-mecer.webp)
![Figure 2.1 A conceptual finger moving downward through a porous medium [from Glass et al., 1989a] (Oc,t, and eo are the moisure content at the finger core, at the finger tip, and in the porous medium initially, respectively.)](https://thumb-eu.123doks.com/thumbv2/123doknet/14217511.483019/98.918.328.644.112.530/figure-conceptual-finger-downward-moisure-content-initially-respectively.webp)