Publisher’s version / Version de l'éditeur:
Polymer Composites, 25, 4, pp. 433-441, 2004-08-01
READ THESE TERMS AND CONDITIONS CAREFULLY BEFORE USING THIS WEBSITE. https://nrc-publications.canada.ca/eng/copyright
Vous avez des questions? Nous pouvons vous aider. Pour communiquer directement avec un auteur, consultez la première page de la revue dans laquelle son article a été publié afin de trouver ses coordonnées. Si vous n’arrivez pas à les repérer, communiquez avec nous à PublicationsArchive-ArchivesPublications@nrc-cnrc.gc.ca.
Questions? Contact the NRC Publications Archive team at
PublicationsArchive-ArchivesPublications@nrc-cnrc.gc.ca. If you wish to email the authors directly, please see the first page of the publication for their contact information.
NRC Publications Archive
Archives des publications du CNRC
This publication could be one of several versions: author’s original, accepted manuscript or the publisher’s version. / La version de cette publication peut être l’une des suivantes : la version prépublication de l’auteur, la version acceptée du manuscrit ou la version de l’éditeur.
For the publisher’s version, please access the DOI link below./ Pour consulter la version de l’éditeur, utilisez le lien DOI ci-dessous.
https://doi.org/10.1002/pc.20036
Access and use of this website and the material on it are subject to the Terms and Conditions set forth at
Fatigue Crack Initiation and Propagation in Polyamide-6 and in
Polyamide-6 Nanocomposites
Bellemare, Simon C.; Bureau, Martin N.; Denault, Johanne; Dickson, J. Ivan
https://publications-cnrc.canada.ca/fra/droits
L’accès à ce site Web et l’utilisation de son contenu sont assujettis aux conditions présentées dans le site LISEZ CES CONDITIONS ATTENTIVEMENT AVANT D’UTILISER CE SITE WEB.
NRC Publications Record / Notice d'Archives des publications de CNRC:
https://nrc-publications.canada.ca/eng/view/object/?id=5d53f332-783d-4d18-ba93-cf7e8e10dc08
https://publications-cnrc.canada.ca/fra/voir/objet/?id=5d53f332-783d-4d18-ba93-cf7e8e10dc08
INTRODUCTION
I
norganic microparticles and microfibers are often added to semicrystalline polymers employed for structural applications. These particles increase the stiffness, and, when the cohesion between them and the matrix is maintained up to high stresses, they also increase the strength (1). However, since particle-rein-forced polymers are frequently used in applicationswhere constant or cyclic stresses are applied, the effect of particles on the creep and fatigue properties has to be considered in estimations of the overall mechanical performance. The fatigue performance of polymers can be quantified by two conventional methods: character-ization of the fatigue crack initiation resistance on smooth specimens and characterization of the fatigue crack propagation (FCP) resistance employing pre-cracked specimens (2).
During fatigue crack initiation in reinforced semi-crystalline polymers, cyclic loading generates strain mismatches at particle-matrix interfaces, which gener-ally results in local debonding. This debonding induces a zone of stress concentration in the matrix, which can
in Polyamide-6 and in Polyamide-6 Nanocomposites
SIMON C. BELLEMARE
1, MARTIN N. BUREAU
2*,
JOHANNE DENAULT
2, and J. IVAN DICKSON
3 1Dept. of Mater. Sci. and Eng.
Massachusetts Institute of Technology
77 Mass. Ave., Cambridge, MA 02139
2
Industrial Materials Institute National Research Council Canada
75 de Mortagne
Boucherville, QC J4B 6Y4, Canada
3
Programme de Génie des Matériaux
École Polytechnique
C.P. 6079, Succ. Centre-Ville
Montréal, QC H3C 3A7, Canada
Recent developments in polymer nanocomposites have led to improvements in con-ventional short-term, but the long-term mechanical properties have received little at-tention. The objective of the present study was to characterize the effect of nanopar-ticles on the fatigue crack initiation and propagation mechanisms and on the fatigue properties of polyamide-6 (PA6) nanocomposite (PA6NC) prepared by in situ polymer-ization with montmorillonite clay. Two approaches were employed: fatigue life meas-urements and crack growth monitoring. Compared with non-filled PA6 at the same stress amplitude, the number of cycles to fracture was higher for the nanocompos-ite, which suggests an increase in the intrinsic resistance of the material to crack ini-tiation. However, the crack growth rate results indicated that nanoparticles de-creased the resistance to crack propagation. Post-fatigue fractographic observations indicated a change in the fatigue crack propagation mechanism resulting from the addition of nanoparticles, primarily attributed to the increase in yield stress, which favors the development of a fibrillated deformation zone. The fibrillation process in the relatively high crack propagation rate regime appeared to be preceded by plastic deformation at approximately constant volume. Most of the effect of nanoparticles on the fatigue behavior and properties results probably from the mechanical reinforce-ment on the microstructure and its effect on the yield stress and Young’s modulus rather than from the effect of the inorganic filler to act as a stress concentrator. Polym. Compos. 25:433–441, 2004. © 2004 Society of Plastics Engineers.
* To whom correspondence should be addressed. E-mail: martin.bureau@cnrc-nrc.ca
© 2004 Society of Plastics Engineers
Published online in Wiley InterScience (www.interscience.wiley.com). DOI: 10.1002/pc.20036
lead to fatigue crack initiation. When mineral mi-croparticles are added at low concentrations for which the stiffness of polypropylene or polyamide 6 (PA6) is not significantly affected, the resistance to fatigue crack initiation is found to decrease, and this effect be-comes more important as the maximum dimensions of the particles increase (3⫺5). By adding glass fibers at concentrations that significantly increase the stiffness of PA6, the number of cycles to fracture is found to in-crease at a given stress amplitude and to dein-crease at a given initial strain amplitude (6⫺8). The overall effect of inorganic fillers on fatigue crack initiation can be ratio-nalized by a weakening effect attributed to local stress concentrations at particles and by a strengthening ef-fect attributed to an increased stiffness.
Industrial processes have been developed to obtain good dispersion of sheet-like inorganic nanoparticles, approximately 1 nm in thickness and 0.1⫺1.0 m in lateral dimensions, within a limited number of semi-crystalline polymers (9). Unlike their micro-sized coun-terparts, these nanoparticles can largely improve the tensile modulus and ultimately the tensile strength without significantly changing the density. The im-provements in stiffness can be related to the high as-pect ratio of the fully exfoliated nanoparticles and to the level of exfoliation. In addition, the significant increases in tensile strength seen in polyamide-based systems are usually explained by strong particle-matrix interac-tions (9). These strong interacinterac-tions can have direct ef-fects on the interface strength, the level of exfoliation, the chain mobility and the supermolecular structure. A decrease in chain mobility by adsorption at the surface of the nanoparticles has been proposed to explain the decrease in free volume fractions (10). Calculations have suggested that crystallization in the presence of nanoparticles becomes a bi-dimensional rather than a tri-dimensional process (11). TEM observations have indicated that nanoparticles tend to orient themselves parallel to the shear flow plane (12, 13) and that crys-tallites in polyamide-12 become preferentially oriented perpendicularly to that plane (13). These orientation effects can explain the higher increases in tensile prop-erties measured when an in situ polymerized PA6-based nanocomposite is injection molded instead of compres-sion molded (14).
While the effects of clay nanoparticles on the tensile properties of semicrystalline polymers have been well characterized, only few studies have been reported on the effect of nanoparticles on the fatigue performance of nanocomposites. Strain monitoring during fatigue of a PA6-based nanocomposite has previously been re-ported (15, 16); however, attention was drawn primar-ily to the thermal instability phenomenon. This phe-nomenon results from cycling a large volume of material above a critical stress amplitude or loading frequency leading to hysteretic heating (17, 18). In a previous paper (19), the effect of nanoparticles on the evolution of bulk fatigue damage has been reported. It was found that the macroscopic stress-strain-time response evolved in a succession of three regimes associated with
different viscoelastic deformation processes. Nanopar-ticles were found to reduce the deformation rate in the first, but this effect was not sustained in the following regimes. It was proposed that axial fatigue loading in the last regime of viscoelastic deformation resulted in the nucleation and growth of microvoids.
The present paper discusses the effect of clay nanoparticles on the mechanisms of fatigue fracture and on the fatigue performance of a PA6. The fatigue performance was evaluated by generating curves of the stress versus the number of cycles to fracture (S-N curves) on non-notched axial specimens as well as curves of the fatigue crack propagation rate (da/dN ) versus the stress intensity factor (⌬K) on pre-cracked specimens. The mechanisms of fatigue fracture were characterized by fractographic observations as well as by post-fatigue observations on a transverse cross sec-tion near the FCP plane.
EXPERIMENTAL METHOD
The polymer nanocomposite employed in the present study was obtained from UBE Industries as commercial grade 1015C2. As described elsewhere (15), this grade is produced by in situ polymerization. Montmorillonite, a natural layered crystal member of the 2:1 phyllosilicate family, is first hydrated in the presence of hydrochloric and aminolauric acids in order to replace the sodium cations present in the interlayers by acid functions. Two weight-percent (2 wt%) of this surface-modified product is subsequently mixed with -caprolactam monomers before polymerization. The resulting PA6-based nano-composite (PA6NC) contains exfoliated nanoparticles with approximate thickness and lateral dimensions of 1 nm and 100 nm, respectively (12). The non-filled PA6 employed in the present study, obtained from UBE In-dustries as commercial grade 1015B, had the same mo-lecular weight (M⫺n⫽22,200 g/mol) as the PA6NC (20).
All specimens were prepared following the same pro-cedure. Pellets of PA6NC and PA6 were dried for 2 days at 80°C under vacuum. Each material was then injec-tion molded with an increasing melt profile temperature ranging from 230°C to 250°C and a mold temperature of 80°C. Prior to mechanical testing, all specimens were further dried for two weeks at 80°C under vacuum in order to remove any trace of humidity that can result from processing because of the hygroscopic nature of PA6. The glass transition temperature, Tg, was then
de-termined from loss shear modulus vs. temperature curves, obtained employing a rheometric mechanical spectrometer at a frequency of 1 Hz and at a constant rate of temperature increase of 2°C/min. A similar Tgof approximately 65°C was obtained for both materials. Tensile test results reported elsewhere (21), on speci-mens processed and conditioned following the proce-dure presently described, indicated room temperature values of Young’s modulus, ultimate tensile strength (UTS), and strain at fracture respectively of 4.1 GPa, 100 MPa, and less than 10% for PA6NC and respectively of 2.7 GPa, 74 MPa and 175% for PA6.
The non-notched axial fatigue specimens were molded directly to their final dimensions. Following the general recommendations of ASTM E606, these speci-mens had a nominal thickness of 3.1 mm and a gauge section width and length of 10 mm and 14 mm, re-spectively. The radius of curvature at the shoulders was 15 mm. Load-controlled axial fatigue tests were carried out in tension-tension using servo-hydraulic testing machines (Instron 8511 and MTS 415). For all tests, the load or R-ratio (R ⫽ min/max) was main-tained constant at 0.1, the cyclic waveform was sinu-soidal and the cycling frequency was 5 Hz. During a few experiments, the specimen temperature was monitored using a K-type thermocouple attached to the surface. All axial fatigue and fatigue crack propagation tests were carried out at room temperature.
The fatigue crack propagation tests were done follow-ing the ASTM E-647 test method. Compact tension specimens were machined from injection-molded plates to a width (W) of 50 mm, a notch depth of 11 mm and a notch opening width of 2 mm. The specimen thickness was kept equal to the plate thickness of 5 mm; the notch and cracking plane was perpendicular to the direction of injection flow. Tests were performed employing an Instron 8511 servo-hydraulic testing ma-chine at an R-ratio of 0.1 and with a sinusoidal wave-form. A razor-blade cut was introduced manually at the notch tip to produce a starter crack just before fatigue pre-cracking, which was carried out at a frequency of 20 Hz and over a distance of 2 mm. The crack length was monitored online using the compliance measured from a clip-on COD gauge. From this crack length and from the imposed load, the amplitude of the variation in the stress intensity factor (⌬K ) was computed. The initial ⌬K value was set equal to or slightly higher than the ⌬K applied during pre-cracking; the ⌬K gradient ranged from 0.04 to 0.14 MPa.m1/2/mm but was
con-stant during all tests. Each crack growth rate meas-urement was obtained over a propagation distance of 0.15 mm. In all tests, final fracture occurred before the crack length reached 30 mm, thus ensuring the appli-cability of linear elastic fracture mechanics.
The fracture surfaces of several specimens were served after the fatigue tests. These fractographic ob-servations were carried out with a JEOL JSM-6100 scanning electron microscope (SEM), after depositing a palladium-gold layer on the fracture surfaces by ion sputtering. Also, a section perpendicular to the crack plane was prepared by ultra-cryomicrotomy, coated with palladium and observed with an Hitachi S4700 field emission gun scanning electron microscope (FEGSEM).
RESULTS AND DISCUSSION Axial Fatigue
Quantitative results from the axial fatigue tests are presented in Fig. 1, where the fatigue life (N ) measured is plotted as a function of the imposed constant maxi-mum cyclic stress (max). For PA6NC, the response can
be divided into two regimes. In the high-stress regime, approximately above 78 MPa or 78% of the UTS, frac-ture occurred in a macroscopically ductile manner by necking. Just below this high-stress regime, at a max-imum cyclic stress of 75 MPa, the average initial strain amplitude was measured to be 0.98%. For this maxi-mum cyclic stress of 75 MPa, the specimens failed without any necking. Figure 1 shows that the depend-ence of N on maxis more important in the higher stress
regime. The macroscopic fracture process for PA6 also changed from macroscopically ductile to macroscopi-cally brittle at a given critical max, which was found to
be approximately 60 MPa or 81% of the UTS. The initial strain amplitude at a slightly lower maxof 57 MPa, was
0.93%. This critical maxvalue was employed to divide
the response of PA6 into low-stress and high-stress regimes, as this has been previously reported for sev-eral other similar material systems (2, 18, 22). Al-though the critical max is higher for PA6NC than for
PA6, the relative stress value with respect to the UTS and also the initial strain amplitude at which this tran-sition occurs are very similar.
In the high-stress regime, the temperature rose just before necking, suggesting the occurrence of the well-known thermal instability phenomenon (2, 18), caused by poor dissipation of the heat generated by viscoelas-tic damping. However, experiments employing a trape-zoidal cyclic waveform with varying hold times at max-imum and minmax-imum stresses showed that the thermal instability was controlled by a threshold value of the accumulated strain in the specimen rather than by the testing frequency (23). Therefore, necking could also be caused by a mechanical instability resulting from a com-petition between strain hardening and geometrical soft-ening, which is the general origin of necking during ten-sile elongation tests (24). Independently of its thermal or
Fig. 1. Maximum cyclic stress versus fatigue life: ( ■) PA6NC, thermal regime; (■■) PA6NC, mechanical regime; ( ●) PA6, ther-mal regime; (●●) PA6, mechanical regime.
mechanical origin, the instability leading to necking must be regarded as an artifact of the loading mode.
In the lower stress regime, detailed fractographic ob-servations (see the Fatigue Damage Characterization section) provided evidence that sub-critical fatigue crack propagation occurred before the final macroscopically brittle fracture. The fatigue life in that regime is thus more representative of the overall resistance of the specimens to the initiation and propagation of fatigue cracks. From the results presented in Fig. 1, this over-all mechanical fatigue resistance of PA6NC and PA6 can be compared by employing the results obtained for each of the three following conditions: PA6NC at 57 MPa, PA6NC at 75 MPa, and PA6 at 57 MPa. As shown in Table 1, the average values of the initial strain am-plitudes for PA6NC at 75 MPa and PA6 at 57 MPa are similar. Table 1 presents the average fatigue life for each of the three conditions. When compared to PA6, the average fatigue life of the non-notched PA6NC specimens is more than twice as high at the same maxvalue of 57 MPa, but more than three times lower at a similar ini-tial strain amplitude of approximately 0.9⫺1.0%. Since the curves in Fig. 1 reflect the initiation and propagation of fatigue cracks, analysis of the causes of these differ-ences requires consideration of the fatigue crack propa-gation tests and of the fractographic observations.
Fatigue Crack Propagation
The macroscopic fatigue crack propagation rate (da/dN ) was monitored as a function of the range of stress intensity factor (⌬K) on pre-cracked specimens.
Of the eight fatigue crack propagation tests per-formed, two were deemed to be invalid. Both tests were on PA6NC with an initial ⌬K of 0.8 MPa.m1/2and a ⌬K
gradient of 0.04 MPa.m1/2/mm⫺1and both presented a
long plateau, where da/dN remained constant as the macroscopic ⌬K increased. This occurred for crack lengths where the fracture surfaces presented several curved crack propagation lines oriented at high angles to the macroscopic crack growth direction (23). Long crack arrest lines approximately perpendicular to the curved crack propagation lines were also observed for these two tests. These observations indicated an im-portant curvature of the crack front. The occurrence of a long propagation plateau in these two tests was con-sidered to result from the increase in the effective
length of the crack front artificially increasing the re-sistance to fatigue crack growth by increasing the amount of deformed material available to sustain the applied load. One or two smaller plateaus were ob-served during each of the two other fatigue crack prop-agation tests performed on PA6NC with an initial ⌬K of 0.45 MPa.m1/2.
The results considered to be valid obtained from the crack propagation tests are plotted on a log-log scale in Fig. 2. The crack growth rate at any given ⌬K is com-paratively higher in PA6NC than in PA6. As shown in Fig. 2, a linear log-log relationship between da/dN and ⌬Kwas observed during the test on PA6NC at an initial ⌬Kof 0.8 MPa.m1/2as well as during all three tests on
PA6. This linearity is also generally found in a large va-riety of polymeric systems (2, 25, 26), including glass-fiber reinforced PA 6 (27, 28).
Any deviation from linearity can be attributed to ex-perimental artifacts. For the two tests on PA6NC at an initial ⌬K of 0.45 MPa.m1/2and a ⌬K gradient of 0.14
mm⫺1, the small plateaus can be attributed to crack
curvature effects, considerably less important than but of the same nature as those which caused two tests to be classified as invalid. The high susceptibility for crack curvature effects during the present tests on PA6NC can be rationalized from microstructural gradients and from the high sensitivity of the cracking mechanism to hydrostatic stresses (see the General Discussion sec-tion). This crack curvature leads to an overestimation of the intrinsic FCP resistance. Since the intrinsic resist-ance of the materials to fatigue crack propagation should be represented by the linear portions (neglecting any plateaus) of the log-log plots, Fig. 2 indicates that this resistance is significantly lower in PA6NC than in PA6.
Table 1. Average Fatigue Life (Average Made on the Logarithm of the Fatigue Life) for PA6NC and PA6
Tested at the Same Maximum Stress and at a Similar Initial Strain Amplitude.
Material PA6NC PA6
Maximum cyclic stress (max)
57 MPa 75 MPa 57 MPa
Average initial
strain amplitude (%) 0.69 0.98 0.93
Average fatigue life
(kilocycles) 5300 600 2300
Fig. 2. Macroscopic fatigue crack propagation rate versus range of stress intensity factor: (▼▼,●●) PA6NC, initial ⌬K ⫽ 0.45 MPa.m1/2, ⌬K gradient ⫽ 0.14 MPa.m1/2/mm; (■■) PA6NC,
ini-tial ⌬K ⫽ 0.8 MPa.m1/2, ⌬K gradient ⫽ 0.04 MPa.m1/2/mm;
( ■)PA6, initial ⌬K ⫽ 0.6 MPa.m1/2, ⌬K gradient ⫽ 0.04
MPa.m1/2/mm; ( ▼,●) PA6, initial ⌬K ⫽ 0.9 MPa.m1/2, ⌬K
Fatigue Damage Characterization
The fracture surfaces were observed by SEM. Figure 3 presents a typical example of the fracture surfaces from the axial tests, which surfaces all contained two distinct regions: a relatively small flat central region ap-proximately perpendicular to the load axis and a sur-rounding region inclined very approximately at 45° to this axis. The inclined fracture surface presented nu-merous quite large crack propagation or ridge lines but otherwise was microscopically featureless. In the flat central region, small crack propagation lines radiated away from the crack initiation site (such as at I in Fig. 3). These fractographic features indicate that the flat central region corresponds to the fracture surface pro-duced by fatigue cracking and that the inclined region corresponds to that of final fracture.
A typical fatigue crack initiation site in a PA6NC specimen tested at maxof 57 MPa is shown in Fig. 4. For all tested specimens, several crack propagation lines emerge from the periphery of what appears to be a micro-heterogeneity. The number of distinct propa-gation lines indicates that several microscopic cracks initiated simultaneously, which suggests a relatively long crack initiation period from the interface of this heterogeneity. X-ray energy dispersive spectroscopy in-dicated that the micro-heterogeneities contained varia-ble proportions of silicon, magnesium, calcium and/or aluminum, which suggests that these heterogeneities are inherent clay by-products present in the nanocom-posite. Since such a micro-particle was observed at the fatigue initiation site in all PA6NC axial specimens, the presence of such particles clearly promotes fatigue ini-tiation. It thus appears that the axial fatigue test re-sults are inherently affected by the limited level of pu-rity of commercial nanocomposites produced from natural clay minerals.
The evolution of the fractographic details, in moving away from the fatigue initiation site in a PA6NC speci-men tested at maxof 75 MPa, is shown in Figs. 5, 6 and
7. Very close to the crack initiation site (Fig. 5), the frac-ture surface contains an array of small voids, which are separated by thin polymer ligaments or fibrils. The presence of these fibrils or ligaments indicates that voids formed a fibrillated deformation zone in the ma-terial well before complete surface separation. The term “fibrillated deformation zone” is employed to emphasize that the nucleation and growth mechanism of this voided structure is different from that prevailing during crazing in amorphous polymers as well as during the formation of low temperature crazes in semicrystalline polymers (29⫺32).
As the distance from the crack initiation site in-creased, the size and length of the fibrils became pro-gressively larger. A typical fibril structure observed at approximately half the distance between the crack ini-tiation site and the end of the flat central region of Fig. 3 (site A) is shown in Fig. 6. As shown in Fig. 7, the length of the fibrils starts to progressively decrease near the end of the flat central region (site B). The sur-face features observed near the middle of Fig. 7 also show the characteristic structure generally referred to as “island type.” It has been proposed (33, 34) that this island type structure results from the crack growing al-ternatively along the upper and lower interfaces be-tween the fibrillated deformation zone and the sur-rounding bulk material. This structure is observed in polymers at the end of large planar voided region close to the transition with the final fracture zone.
The fracture surfaces generated during the fatigue propagation tests in PA6NC were also observed. A lamellar fibril structure, observed in the center of the FCP surfaces at a crack length for which the macroscopic
Fig. 3. Typical fracture surface of an axial fatigue specimen of PA6NC (max⫽75 MPa), with a macroscopically flat central re-gion and a surrounding fast fracture rere-gion. The tails of the ar-rows begin on the start of the zone of fast fracture. The site la-beled I indicates the fatigue crack initiation region. The sites A and B are references for Figs. 6 and 7.
Fig. 4. Crack propagation lines emerging from the periphery of an heterogeneity at a typical fatigue crack initiation site lo-cated in the flat central region of the fracture surface of a PA6NC axial fatigue specimen (max⫽57 MPa, fatigue life ⫽ 3197 kilocycles).
da/dN was approximately 10⫺4mm/cycle, is shown in
Fig. 8. The morphology of these fibrils is almost identi-cal to that presented in Fig. 6 and observed on the flat central region of the fracture surface of the axial fatigue specimens. This similarity confirms that fatigue crack propagation and not simply a monotonic fracture after an incubation period occurred in the flat central region of the axial specimens. Large lamellar fibrils such as those observed in Figs. 6 and 8 appeared to be prefer-entially oriented perpendicularly to the specimen thick-ness direction rather than to the macroscopic crack propagation direction.
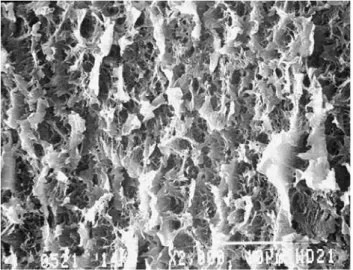
To further characterize this fatigue crack propaga-tion process, Fig. 9 presents observapropaga-tions made on a
transverse cross section taken below the fracture sur-face in the area where Fig. 8 was taken. A layer of “tex-tured” material having an approximately constant thickness of 3 m over a distance of at least 0.2 mm is present just below the fracture surface. The term tex-tured is employed here to account for the presence of small lines (which are vertical in Fig. 9) preferentially oriented parallel to the fracture plane. The interface be-tween this textured layer and the bulk material, and the bulk material itself, both contain microvoids, which are clearly opened. The proportion of the surface that corresponds to microvoids is large near the interface and progressively decreases within the first 5⫺10 m
Fig. 5. Array of small voids or dimples separated by thin liga-ments in the flat central region and near the fatigue crack initia-tion site I (Fig. 3) of a PA6NC axial fatigue specimen (max⫽75 MPa).
Fig. 6. Larger ligaments at site A (Fig. 3) between the crack ini-tiation site and the end of flat central region. The crack propaga-tion direcpropaga-tion is approximately from the lower left to the top right corner. The direction normal to the injection plane is horizontal.
Fig. 7. Decrease in the length of the ligaments near the end of the flat central region at site B (Fig. 3). The crack propagation direction is approximately from left to right. The structure near the middle of this fractograph is referred to as “island type.”
Fig. 8. Lamellar ligaments observed on the fracture surface of a fatigue crack propagation specimen of PA6NC at a macro-scopic da/dN ⬇ 10⫺4mm/cycle. These ligaments are similar
to those presented in Fig. 6. The macroscopically imposed crack propagation direction is from bottom to top. The direction normal to the injection plane is horizontal.
of bulk material. In contrast, the surface density of sim-ilar microvoids appears relatively low in the textured layer. Neither microvoids nor textured layers were ob-served at edges not corresponding to a fracture surface. Based on the assumption that the narrow preferen-tially oriented lines seen in the textured layer corre-spond to elongated microvoids almost completely closed during deformation ahead of the crack tip, this textured layer appears to consist of material, which has been stretched along the crack propagation direction. Stretching along this direction has been previously re-ported for monotonic loading (35) of rubber-toughened polyamide 66, with the deformation estimated from the change in the aspect ratio of the pores generated at the rubber microparticles. Although some observations
suggest that stretching within the textured layer may be higher near the crack plane, no clear change in the mor-phology of the stretched polymer within this layer was observed as a function of the distance from this plane.
To rationalize the observations reported here, it is proposed that crack growth was preceded by the ad-vance of an interface, between a highly deformed zone and the bulk material. This process would present sim-ilarities with the known mechanism of growth of shear bands in amorphous polymers (36). The presence of a gradient of surface density of microvoids within the bulk material suggest an early stage of localized void formation, which can be expected to promote the initi-ation and growth of a fibrillated deforminiti-ation zone near the mid-plane of the highly deformed zone.
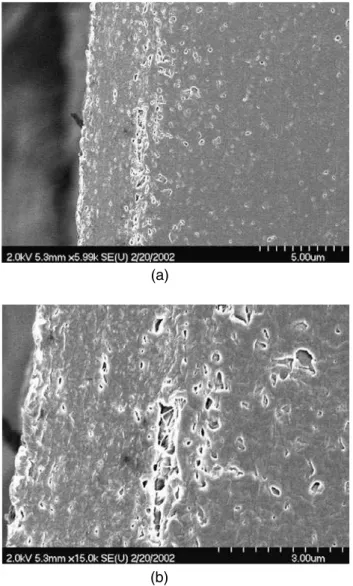
To compare the crack propagation mechanisms in PA6NC to that of the non-filled matrix, the fracture sur-faces of the axial fatigue PA6 specimens were also ob-served. These specimens also presented a flat central region, within which the fatigue crack initiated at erogeneities. The fractographic features of these het-erogeneities, however, were different from those ob-served for PA6NC. A typical crack initiation site in a PA6 specimen tested at maxof 57 MPa is shown in Fig. 10a, with part of the heterogeneity at which the crack initiated being visible. The heterogeneities found at the crack initiation site in the PA6 specimens presented a relatively smooth morphology. X-ray microanalyses never revealed the presence of inorganic elements in these heterogeneities. A few spherulites (approximately 10 m in size) are also seen in Fig. 10a, with a typical transspherulitic fracture aspect (37). At an increasing distance from the crack initiation site, the plastic zone size and the crack tip blunting increased as a result of the increase in ⌬K and in the crack opening displace-ment, which led to smoother fractographic features. Figure 10bpresents a transitory aspect where the sur-face is smooth but where the effect of the spherulites in reinitiating the crack can still be resolved clearly. Both near the fatigue initiation site and in an intermediate portion of the fatigue crack propagation zone, the frac-ture surfaces of the PA6 specimens did not present fib-rils similar to those observed in PA6NC, indicating a lower tendency of the material to form microvoids ahead of the fatigue crack tip for these loading conditions.
GENERAL DISCUSSION
Microvoid formation in polymers is time-dependent and stress-dependent and is particularly affected by the hydrostatic component of stress (33, 38). Because of the difference in yield stress, significantly higher stresses ahead of the crack tip are expected in PA6NC than in PA6, which could be the primary reason for the differences in the fatigue cracking mechanisms indi-cated in these two materials by the fractographic ob-servations. The importance of microvoid formation in the cracking mechanism of PA6NC can explain its higher tendency to undergo crack curvature during the fatigue crack propagation tests. During these tests, the hydrostatic component of the stress in the zone ahead
Fig. 9. Transverse cross-section showing the structure of a PA6NC FCP specimen just below the crack plane (macroscopic da/dN ⬇ 10⫺4mm/cycle). The normal to the crack propagation
plane is horizontal and the crack propagation direction is verti-cal. (a) From left to right: trace of the fracture surface, layer of textured material, interface and bulk material. (b) Higher mag-nification view centered on the interface.
(a)
of the crack tip is higher near the specimen mid-thick-ness than near the lateral surfaces. Therefore, voids will nucleate more easily near the mid-thickness, de-creasing the local resistance to fatigue propagation.
The different morphology of the fibril arrays observed on the fracture surfaces of PA6NC suggests an effect of the nanoparticles on the cracking mechanism. At low propagation rates (Fig. 5), the size of the micro-voids between fibrils is of the order of 1 m, which is comparable to the maximum expected length of the nanoparticles. However, very similar fracture surface morphologies have been reported for fatigue of non-filled semicrystalline polymers (39, 40). Thus, while the presence of the nanoparticles may well facilitate the
initiation of microvoids especially in the presence of the higher local cyclic stresses expected, the fractographic observations do not allow us to identify this unam-biguously.
At higher propagation rates, the lamellar fibrils ori-ented preferentially perpendicularly to the injection plane could result from preferential orientation of the nanoparticles or of the polymer chains, but similar walled structures have been observed in compression-molded specimens of non-filled polyethylene (41, 42).
Surface separation leading to crack advance in PA6NC occurs by the breakdown of a fibrillated defor-mation zone. The fibrillation process requires the nucle-ation of microvoids in the material, which is easily acti-vated because of the high stresses as well as, possibly, the presence of stress concentrators in this material. Pexisting voids, crystallite ends and amorphous re-gions and exfoliated nanoparticles are all possible stress concentrators. It has not been established clearly that the nanoparticles contribute directly to the decrease of the resistance of the PA6 matrix to fatigue crack propa-gation; however, the indirect effect of the nanoparticles to increase the yield stress, thus facilitating the forma-tion of microvoids ahead of the crack tip, is expected to be an important factor contributing to this decrease in fatigue propagation resistance.
Although the resistance to fatigue crack propagation of PA6 is decreased by the addition of nanoparticles, the fatigue life of axial specimens was increased when the comparison was made for the same stress ampli-tude. The fatigue life represents the sum of the time spent in initiating the crack and in propagating it to a critical length, which depends on the fracture tough-ness of the material. Since the fatigue crack propaga-tion resistance and the fracture toughness (21) for PA6NC are lower than for PA6, this increase in fatigue life due to the addition of nanoparticles can be inter-preted as an increase in the resistance of the speci-mens to the initiation of a fatigue crack.
Since all specimens were processed and tested ac-cording to the same procedure, this increase in the fa-tigue resistance of the axial specimens is expected to originate from an actual increase in the fatigue initia-tion resistance of the material. The decrease in strain amplitude, which results from the increased yield stress, should be a factor contributing to the increase in fatigue resistance of the axial specimens. In a related study (19), nanoparticles were found to decrease the rate of accumulation of viscoelastic deformation in the specimens during the initial stages of the axial fatigue tests, which may also contribute to this increase in fa-tigue resistance.
CONCLUSIONS
From this study, it can be concluded that:
1. Dispersing sheet-like inorganic nanoparticles in a PA6 matrix increases the fatigue life of axial fatigue specimens subjected to a given tension-tension stress amplitude, but decreases the fatigue life at given strain amplitude. Therefore, the effect of
Fig. 10. Fracture surfaces of axial fatigue specimens of PA6 (max⫽57 MPa). (a) Interface (oriented horizontally) with the heterogeneity (bottom) that caused crack initiation and a few spherulites (approximately 10 m in size) with typical trans-spherulitic fracture aspect. (b) Large half dimples at approxi-mately half the distance between the crack initiation site and the end of the flat central region. The crack propagation direc-tion is approximately from bottom to top.
(a)
nanoparticles on the fatigue life appears to be anal-ogous to the one reported for inorganic fillers hav-ing dimensions in the microscale.
2. The increase in fatigue life at given stress ampli-tude is expected to be a consequence of an in-crease in the intrinsic material resistance to crack initiation, which is favored by the effect of nano-particles to increase Young’s modulus and accord-ingly to decrease the displacement amplitude of the macromolecules during cycling.
3. Although the addition of nanoparticles results in a change in the cracking mechanism, observations strongly suggested that the development of a fib-rillated deformation zone in PA6NC is preceded by the permanent deformation of a relatively thick layer of material.
4. The resistance to fatigue crack propagation resist-ance decreases, which is probably attributed to an indirect effect of the nanoparticles to increase the yield stress that favors the formation of microvoids ahead of the crack tip.
5. Most of the effect of nanoparticles on the fatigue behavior and properties results probably from the mechanical reinforcement of the microstructure and from the increase in yield stress and Young’s modulus rather than from the effect of the inor-ganic filler to provide stress concentrators.
ACKNOWLEDGMENTS
Financial support from NSERC research-support programs and collaboration of UBE Industries for pro-viding the material are gratefully acknowledged. Spe-cial thanks are due to Florence Perrin-Sarazin from the National Research Council of Canada for contributing to the microscopic observations.
REFERENCES
1. K. K. Chawla, Composite Materials: Science and
Engi-neering, p. 303, Springer, New York (1998).
2. R. W. Hertzberg and J. A. Manson, Fatigue of Engineering
Plastics, p. 295, Academic Press, New York (1980). 3. J.-P. Trotignon, L. Demdoum, and J. Verdu, Composites,
23, 313 (1992).
4. J.-P. Trotignon, L. Demdoum, and J. Verdu, Composites, 23, 319 (1992).
5. J.-P. Trotignon, L. Demdoum, and J. Verdu, International
Conference on Advanced Composites Materials, Wollon-gong, p. 573, (February 1993).
6. J. J. Horst and J. L. Spoormaker, Polym. Eng. Sci., 36, 2718 (1996).
7. J. J. Horst and J. L. Spoormaker, J. Mater. Sci., 32, 3641 (1997).
8. J. C. Mandell, F. J. McGarry, and C. G. Li, Research
Re-port R83-1, Department of Materials Science and Engi-neering, MIT, Cambridge, Mass. (1983).
9. M. Alexandre and P. Dubois, Mater. Sci. Eng. R-Rep., 28, 1 (2000).
10. R. Simha, L. A. Utracki, and A. Garcia-Rejon, Compos.
In-terfaces, 8, 345 (2001).
11. J. A. Lee, T. G. Gopakumar, M. Kontopoulou, and J. S. Parent, SPE ANTEC Papers, p. 2230 (2002).
12. Y. Kojima, A. Usuki, M. Kawasumi, A. Okada, Y. Fukushima, T. Kurauchi, and O. Kamigaito, J. Mater.
Res., 8, 1185 (1993).
13. G. M. Kim, D. H. Lee, B. Hoffmann, J. Kressler, and G. Stoppelmann, Polymer, 42, 1095 (2001).
14. M. N. Bureau, J. Denault, K. C. Cole, and G. D. Enright,
Polym. Eng. Sci., 42, 1897 (2002).
15. A. Yamashita, S. Higashi, S. T. Komatsu, A. Takahara, and T. Kajiyama, Key Engineering Materials, 137, 147 (1998).
16. A. Yamashita, A. Takahara, and T. Kajiyama, Compos.
In-terfaces, 6, 247 (1999).
17. R. J. Crawford and P. P. Benham, J. Mater. Sci., 9, 18 (1974).
18. R. J. Crawford and P. P. Benham, Polymer, 16, 908 (1975).
19. S. C. Bellemare, M. N. Bureau, J. Denault, and J. I. Dick-son, Polym. Compos., submitted.
20. A. Usuki, personal communication (2000).
21. M. N. Bureau, J. Denault, and F. Glowacz, SPE ANTEC
Papers, p. 2125 (2001).
22. A. J. Lesser, J. Appl. Polym. Sci., 58, 869 (1995). 23. S. C. Bellemare, M.A.Sc., École Polytechnique de Montréal
(2002).
24. I. M. Ward and D. W. Hadley, An Introduction to the
Me-chanical Properties of Solid Polymers, Wiley (1993). 25. M. N. Bureau, J. I. Dickson, and J. Denault, J. Mater.
Sci., 33, 1405 (1998).
26. E. A. Showaib and M. G. Wyzgoski, J. Mater. Sci., 37, 1895 (2002).
27. M. G. Wyzgoski and G. E. Novak, J. Mater. Sci., 26, 6314 (1991).
28. M. G. Wyzgoski, G. E. Novak, and D. L. Simon, J. Mater.
Sci., 25, 4501 (1990).
29. K. Friedrich, Advances in Polymer Science, 52 – 3, 225 (1983).
30. I. Narisawa and M. Ishikawa, Advances in Polymer
Sci-ence, 91– 92, 353 (1990).
31. A. P. More and A. M. Donald, Polymer, 33, 4081 (1992). 32. C. J. G. Plummer and H. H. Kausch, Macromol. Chem.
Phys., 197, 2047 (1996).
33. H. H. Kausch, Polymer Fracture, p. 456, Springer-Verlag, (1987).
34. D. Hull, Polymeric Materials, p. 487, ASM, Materials Park, Ohio (1975).
35. O. K. Muratoglu, A. S. Argon, R. E. Cohen, and M. Wein-berg, Polymer, 36, 4771 (1995).
36. E. J. Kramer, J. Polym. Sci. Pt. B-Polym. Phys., 13, 509 (1975).
37. K. Friedrich, Fracture 1977, p. 1119 Waterloo, Ontario (June 1977).
38. E. J. Kramer, Advances in Polymer Science, 52–3, 1 (1983).
39. R. W. Hertzberg, ASTM STP (fractography of modern
engi-neering materials), 958, 5 (1987).
40. J. Runt and K. P. Gallagher, J. Mater. Sci., 26, 792 (1991).
41. V. Favier, T. Giroud, E. Strijko, J. M. Hiver, C. G’sell, S. Hellinckx, and A. Goldberg, Polymer, 43, 1375 (2002). 42. M. Parsons, E. V. Stepanov, A. Hiltner, and E. Baer, J.