Building a Diverse Modal Portfolio:
Adding High-Speed Rail to the Mix
by
Gail C. Payne
B.A. International Relations
B.A. French
University of California at Davis, 1991
Submitted to the Department of Urban Studies and Planning
in
Partial
Fulfillment of the Requirements for the Degree of
Master of City Planning
at the
Massachusetts Institute of Technology
September 1996
@1996 Gail C. Payne. All rights reserved.
The author hereby grants to MIT permission to reproduce and to distribute publicly
paper and electronic copies of this thesis document in whole or in part.
Signature of Author:
Certified by:
Accepted by:
DelfAment of Urban Studies and Planning
June 12, 1996
Joseph Sussman
JR East Professor
Profess6r of Civil and
fyvi/nmental
Engineering
Thesis Supervisor
Mark Schuster
Professor of Urban Studies and Planning
Head of the MCP Program
F E
B 1 997
uBAP1ESBuilding a Diverse Modal Portfolio:
Adding High-Speed Rail to the Mix
by
Gail C. Payne
Submitted to the Department of Urban Studies and Planning on June 12, 1996 in
Partial Fulfillment of the Requirement for the Degree of Master of City Planning
Abstract
With some exceptions, intercity travelers in the United States have only two viable
choices for transportation: air and automobile. This bi-modal system exposes the
transportation sector to service interruptions such as earthquakes, oil embargoes and
terrorist attacks. Due to the economic and social impacts associated with service
disruptions, the position taken in this thesis is that interruptions to intercity travel are
too frequent and the consequences are too great. Since each mode of transportation is
affected differently by these disruptions, a more diverse intercity transportation system
would be less vulnerable. Thus, modal diversification in certain corridors allows for a
more flexible system that is better able to accommodate transportation system supply
and demand fluctuations.
The outcome of this strategy is a higher level of service and system capacity during
disruptions that affect one or more modes of travel; the main benefit is that it reduces
the economic losses and social dislocations caused by service interruptions. These
diversification benefits are in addition to "conventional" benefits obtained from
increased capacity. Concerning high-speed rail, advocates include as "conventional"
benefits: enhanced mobility, greater energy efficiency, less dependence on foreign oil,
improved air quality, lower greenhouse emissions, and fewer injuries and deaths.
In order to illustrate the benefits of modal diversification, this thesis focuses on a
proposed high-speed rail service in California. Since rail can withstand most major
transportation disruptions, and can accommodate a substantial number of passengers,
it is an effective way to achieve transportation diversification. A scenario-based
analysis identifies several service interruptions that have the potential to cause severe
economic losses, and estimates the ability of modal diversification to alleviate the
impacts of these interruptions.
Thesis Supervisor: Joseph Sussman
Title: JR East Professor
Acknowledgments
I would like to acknowledge the following individuals for their assistance: Professor Joseph Sussman, my advisor, for his ideas and patience; Professor Ralph Gakenheimer, my reader, for his candor; Erin Vaca of Cambridge Systematics, Inc. for information on the proposed California High-Speed Rail Corridor project; Kevin Tierney of Cambridge Systematics, Inc. for conceptual advice; and my parents for their support. I dedicate this thesis to my parents, Ms. Mary Payne Norcross and Dr. William A. Payne.
Table of Contents
CHAPTERL INTRODUCTION...-.----.6
MAIN PREMISE DESCRI ION...6
SERVICE INTERUP ON DESCRIPTION...7
MODAL D siCATION BENEFIT DESCRIPTION...9
RAILANDHSR BENEFIT DESCRIPTION...11
SCENARIO-BASED ANAL SIS DESCRIPTION...14
INTRODUCION SUMMARY...15
CHAPTERI TRANSPORTATIONVULNERABILITIES.---...---..17
INT O DUCT O N ... 1 7 TRA PO RArO N-REACYC. ANGE...19
N A R TD T RH...41
HUMAN-CAUSED INTERRUPTIONS... 59
TRANSPORTATION VULNERABILTYSU MARY...69
CHAPTER III: DIVERSIFICATION AS ARISKREDUCTION STRATEGY..---...---..72
IN T O DUCT O N ... 72
RODCAL NEPEC . OFDCATN...72
DIV miFICATION BENEFT AND COSTS...74
RAIL AS AN E ECIVE MODE FOR D E m CATION...79
CHAPTER IV: CALIFORNIAHIGH-SPEED RAIL SERVICE SCENARIO-BASEDANALYSIS---..85
INTRO DUCTION ... 85
PROJEcTDESCR IION...86
SCENARIO DESCRIPTIONS OF SERVICE INTERRUPTIONS...92
IMPACTS OF SERVICE INTERRUPTIONS W iTH AND WITHOUT A HSR SERVICE...108
CALIFORNIA HIGH-SPEED RAILSUMMARY...118
CHAPTERV: CONCLUSION _.. ... ... 119
MAINPREMISE SUMMARY...119
FU URE RESEARCH ... 122
APPENDICES. . .. .... 124
APPENDI .A: SCENARIO-BASED ANALSIS CALCULATIONS... ... ... 126
APPENDIXB: INTERCITY HIGHWAY TRAVEL ALONG THE CORRIDOR...127
BIBLIOGRAPHY-... .----.. 129
GENERAL REFERENCES...129
AIR QUAL TYREFERENCES...129
DIVERSIFICATION REFERENCES...129
EARTHQUAKE REFERENCES ... 130
ENERGY REFERENCES...132
GLOBAL WARMING REFERENCES...133
LA BO R STRIKES...134
RAIL REFERENCES...134
RISK R EFERENCES...136
SEVERE WEATHER REFERENCES...136
Figures
FIGuRE1: BENEFI'S OF A N Ew M ODE ... 7
FIGURE 2: COMPARISON OF MODAL DIVERSIFICATION AND INCREMENTAL IMPROVEMENTS... 11
FIGURE 3: DISRUPrIONS TO THE INTERCrrY TRANSPORTATION SYSTEM...18
FIGURE 4: PRECURSOR-PRODUCT RELATIONSHIP OF ATMOSPHERIC CHEMICAL REACTIONS...22
FIGURE 5: UNITED STATES PETROLEUM CONSUMPTION ... ...27
FIGURE 6: US CRUDE O IL STATISTICS, 1993...33
FIGURE 7: WORLD CRUDE OIL RESERVES, 1987...33
FIGURE 8: CONCENTRATIONS OF ATMOSPHERIc CO2 AT M AUNA LOA ... 36
FIGURE 9: ANTHROPOGENIC SOURCES OF GLOBAL WARMING, 1990... 36
FIGURE 10: SoIL LIQUEFACTION IN MEXICO CTY AFTER THE 1985 EARTHQUAKE...44
FIGURE11: RAILROAD FAILURE AFTERTHE1964 ALASKA EARTHQUAKE...44
FIGURE12: FAULTING INSAN FERNANDO AFTER THE 1971 EARTHQUAKE...45
FIGURE13: VIBRATION DAMAGE DURING THE LOMA PRIETA EARTHQUAKE ... 45
FIGURE14: DISTRIBUTION OF M AJOR EARTHQUAKES IN THE UNITED STATES ... 50
FIGURE15: MAJOR HISTORIC EARTHQUAKES IN CALIFORNIA...53
FIGURE16: WEATHERING INDICES BASED ON FREEZING CYCLE AND WINTER RAIN... 55
FIGURE17: ANT-US ATTACKs1987-94, CASUALTIES... ... ... 63
FIGURE18: ANT-US ATTACKS1994, BY TYPE OF EVENT ... ... ... 64
FIGURE19: Awn-US ATTACKS 1994, BY REGION...65
FIGURE 20: DIVERSIFICATION BENEFrS AND COSTS...76
FIGURE 21: CALIFORNIA CORRIDOR M AP ... 81
FIGURE 22: ELIMINATED AND DIvERTED TRIPS DURING SERVICE INTERRUPTIONS ... 95
FIGURE23: ELIMINATEDANDDIVERTED HIGHWAY TRIPS: AIR QUALITY ANDGLOBAL WARMING...102
FIGURE 24: ELIMINATED AND DIVERTED IGHWAY TRIPS: ENERGY CONSTRAINTS...105
FIGURE 25: ELIMINATED AND DIVERTED HIGHWAY TRIPS: EARTHQUAKES...107
FIGURE 26: ELIMINATED AND DIVERTED HIGHWAY TRIPS: LABOR STRIKS...108
FIGURE 27: ELIMINATED AND DIVERTED HIGHWAY TRIPS: TERRORISM...109
Tables
TABLE1: MAXIMUM IMPACT OF SERVICE INTERRUPTIONS ON THE INTERCITY MODES...12TABLE2: CRUDE O IL PRICE INCREASES...29
TABLE3: ECONOMIC PERFORMANCE SURROUNDING THREE ENERGY PRICE SHOCKS...30
TABLE4: LOMA PRIETA AND NORTHRIDGE DAMAGE TO TRANSPORTATION SYSTEMS...47
TABLE5: LOMA PRIETA AND NORTHRIDGE DAMAGE COSTS... ... 48
TABLE6: NUMBER OF EARTHQUAKES IN THE UNITEDSTATESSINCE 1900...50
TABLE7: PROBABILITY OF LARGE EARTHQUAKES ON THE SAN ANDREAS SYSTEM... 51
TABLE8: SIGNIFICANT SAN FRANCISCO BAY AREA EARTHQUAKES, 1836-1994...52
TABLE9: USE OF THE S AN FRANCISCO BAY TRANSPORTATION LINKS: THE LOMA PRIETAEARTHQUAKE ... 77
TABLE10: MAXIMUM IMPACT OF SERVICE INTERRUPTIONS ON THE INTERCITY MODES...84
TABLE11: SUMMARY OF SCENARIO DESCRIPTIONS...93
TABLE12: ASSUMED HSR CONTRIBUTIONS: AR QUALITY ANDGLOBAL WARMING REGULATIONS...110
TABLE13: ASSUMED HSR CONTRIBUTIONS: ENERGY-RELATEDREGULATIONS...111
TABLE14: ASSUMED HSR CONTRIBUTIONS: EARTHQUAKES... ... ... 113
TABLE15: ASSUMED HSR CONTRIBUTIONS: LABOR STRIKES... ... 115
Chapter
I:
Introduction
Main Premise Description
With some exceptions, intercity travelers in the United States have only two viable
choices for transportation: air and automobile. This bi-modal system exposes the
transportation sector to service interruptions such as earthquakes, oil embargoes and
terrorist attacks. A more diverse transportation system (i.e., one with more viable
modes) would be less exposed to these disruptions because different modes exhibit
different vulnerabilities. A system that offers a multitude of transportation options is
more flexible, and better able to accommodate transportation system supply and
demand fluctuations. The main benefit of modal diversification is that it reduces
economic losses and social dislocations caused by service interruptions.
The benefits gained from modal diversification are in addition to "conventional"
benefits obtained from increased capacity. Concerning high-speed rail (HSR), for
instance, advocates include as "conventional" benefits: enhanced mobility, greater
energy efficiency, less dependence on foreign oil, improved air quality, lower greenhouse
gas emissions, and fewer injuries and deaths. The diversification benefits of a new
high-speed rail service consist of its ability to reduce the transportation system's
exposure to service disruptions such as oil shocks, thereby decreasing economic and
social disruptions. Thus, when considering transportation capacity expansions,
transportation experts should address not only the "conventional" benefits of a mode
during regular operating conditions (i.e., without service interruptions), but also the
FIGURE 1
Benefits of a New Mode
"Conventional" Benefits + Modal Diversification Benefits
= Benefits of a New Mode
The main premise of the following thesis is to explore the benefits of modal diversity for intercity transportation because a multimodal system helps reduce the negative
impacts caused by service disruptions. This thesis does not concentrate on the financial feasibility of diversifying the transportation system. Further analysis is needed to consider the cost side of the problem. Other limitations of the thesis pertain to the service interruptions; the thesis computes benefits based on the assumption that disruptions occur meaning that a probability analysis was not performed.
Furthermore, the analysis does not cover discounting of cash flow to reflect the time at which modal diversification benefits occur.
Service Interruption Description
The following transportation-related service interruptions are considered in this thesis:
1) Policy changes relating to air quality, energy constraints, and global warming;
2) Natural disasters such as earthquakes, tornadoes, snow storms and floods; and 3) Human-caused disruptions such as terrorist attacks and labor strikes.
These interruptions vary in their impact on the economy, and in their likelihood of
occurrence. When calculating the impact of a transportation-related disruption (i.e., its duration and cost), planners should pay close attention to the following potential losses: social dislocations such as increased stress on travelers, and economic
disruptions such as the opportunity costs of missed appointments and lost revenues to the restaurant and hotel industries.1
The economic impacts of oil shocks and labor strikes are two examples of potential disruptions that negatively affect the transportation system and the economy. For
instance, during the 1973/74 oil shock, the growth rate of the real gross national product (GNP) dropped from 5.8 percent in 1973 to -0.6 percent in 1974 and then another - 1.1 percent in 1975. During the 1979 oil shock, the growth rate of the real GNP dropped from 3.2 percent in 1979 to - 0.2 percent in 1980.2 Concerning labor
strikes, the 1981 Professional Air Traffic Controller Strike caused the air industry to lose an estimated $35 million per day during the first days of the strike while the
economic costs to members of the American Hotel and Motel Association were estimated to be between $10 and $15 million per day.3
Due to the economic and social impacts associated with oil shocks, labor strikes and
other service interruptions, the position taken in this thesis is that disruptions to intercity travel are too frequent and the consequences are too great. The degree of risk
associated with transportation service interruptions should be reduced in order to decrease negative social and economic impacts. Modal diversification in intercity
1 Joseph G. Morone and Edward J. Woodhouse, Averting Catastrophe: Strategies for Regulating Risky Technologies, University of California Press: Berkeley, Los Angeles, London, 1986, p. 148.
2 John A Tatum, "The 1990 Oil Price Hike in Perspective," Federal Reserve Bank of St. Louis, November/December 1991, p. 12.
corridors is a viable way to reduce the risks caused by service interruptions because a more diverse system is better able to respond to demand and supply fluctuations of the transportation system.
Modal Diversification Benefit Description
The overall outcome of modal diversification is a higher level of service and system capacity during disruptions that affect one or more modes of travel. If transportation alternatives already are operational when a system interruption occurs, then a service expansion on such a mode would not take as long compared to developing an entirely new transportation service. Transportation construction projects take many years to design and build so transportation professionals must plan in advance to ensure that appropriate transportation options are available during emergency situations. Thus, modal diversification helps to reduce the time delay to when a system is able to
accommodate supply and demand fluctuations.
One example of a recently diversified transportation system that responded well to a highway service interruption is Los Angeles after the 1993 Northridge earthquake. The Metropolitan Transportation Authority was able to expand capacity on its new
commuter rail service in a matter of days, and observed an increase in ridership from 1,000 to 20,000 passengers per day.4 If the line had not existed, as many as 19,000 travelers would have used their automobiles only to have further exacerbated the post-earthquake congestion problems. This example illustrates that for most types of
3 Bert A. Spector, Air Traffic Controllers, Harvard Business School, Boston, MA, 1982.
4 Northridge Earthquake: Lifeline Performance and Post-Earthquake Response, Technical Council on Lifeline Earthquake
Engineering, Monograph No. 8, edited by Anshel J. Schiff, published by the American Society of Civil Engineers, New York, August 1995, p. 2 1 2.
service interruptions, there is an economic value of having a multimodal transportation
system already in place, though the benefit varies depending on the service disruption.
A useful time to consider modal diversification occurs when a congested intercity
transportation corridor needs additional capacity. In principle, transportation experts
may choose between expanding an existing mode or developing a new one. Figure 2
describes a scenario in which transportation planners can expand an eight-unit
transportation system to ten units by adding capacity to existing modes or by adding
capacity to a new mode valued at two units. Modal diversification may be a superior
option to incrementally improving existing modes because this strategy allows the
transportation system to respond better to demand and supply fluctuations. The
benefits of diversification come with a cost in that the development of a new mode may
be more expensive than adding incremental capacity to existing modes.
When deciding whether to add capacity to existing systems or to new modes,
transportation planners should consider the "conventional" benefits obtained from
increased capacity such as improved mobility as well as benefits gained from modal
diversification such as enhanced system flexibility. In order to help justify the need for
a new mode, the "conventional" and diversification benefits of an additional mode
must outweigh the "conventional" benefits of improving existing modes. If
diversification benefits are overlooked, then the development of an additional mode
may rank lower than the expansion of existing modes because of higher start-up costs.
Since transportation planners are often concerned with reducing short-term costs,
FIGURE 2
Comparison of Modal Diversification and Incremental Improvements
Additional Capacity to Existing Modes
Rail and HSR Benefit Description
Since rail can withstand many major transportation disruptions, and can accommodate a substantial number of passengers, we argue that it is an effective way to achieve
transportation diversification. The position taken in this thesis is that rail is less exposed than air and highway travel to most service interruptions. (Table 1)
Nevertheless, the benefits of rail depend on the type and severity of the disruption.
When considering the three categories of potential transportation vulnerabilities
interruptions), rail can provide the most relief during policy changes relating to air quality, energy constraints, and global warming. Rail is an energy-efficient and low-emitting mode which can easily be expanded if politicians deem that transportation emissions are too high or when an oil shock occurs. For example, the Worldwatch
Institute states that, rail "is three times as energy-efficient as commercial air and six times as efficient as a car with one occupant." (The measurement considers the energy needed to move one traveler one kilometer in the United States.)5 Concerning natural disasters and human-caused interruptions, rail is able to compensate for excess
demand only if it withstands damage from an incident. Even though rail is vulnerable to these interruptions, the recovery tends to be quicker because rail relies on simple technology and sparse infrastructure.
TABLE 1
Maximum Impact of Service Interruptions on
the Primary Intercity Modes of Travel
Rail Travel
Air Travel
Highway Travel
Transportation Policy Changes
Air Quality X XXX XXX Energy Constraints X XXX XXX Global Warming X XXX XXX
Natural Disasters
Earthquakes XX XX XXX Floods XX X XXX Snow Storms X XXX XXXHuman-Caused Interruptions
Labor Strikes XXX XXX X Terrorism XXX XXX XX Minimally Vulnerable XX Vulnerable XXX Extremely Vulnerable
In order to raise the probability that rail transportation is competitive with air and auto
travel in terms of travel time and traveler cost, high-speed rail (HSR) service would be required in most corridors. The development of conventional rail is difficult to justify
economically because, in most corridors, it is not viable during regular operating conditions. HSR does not exist in the United States except for the Northeast Corridor (NEC) so passengers transferring to rail during air or highway disruptions would have
to expect slow and somewhat unreliable service. Some travelers would opt to avoid trips while others would waste valuable time on trains that run at slow speeds. If the disruption was a prolonged one, the overall effect would be an economic slowdown. To prevent such a severe impact, HSR could provide efficient and reliable service that competes with air and automobile travel in both cost and travel time.
Other than providing diversification benefits, rail, and especially high-speed rail, add numerous "conventional" benefits to the mix. Rail's high carrying capacity combined with other "conventional" benefits such as employment opportunities, congestion relief, and accident reductions make it a reasonable intercity mode not only as a type of capacity reserve for service interruptions, but also as a legitimate means of
transportation during regular conditions. Some "conventional" benefits of rail, and high-speed rail, are highlighted below:
- Concerning accident reductions, for the Las Vegas -Southern California proposed high-speed rail line, "In the first year of the system, the big switch to trains is
expected to prevent more than 270 accidents, 140 injuries and 15 fatalities on or
near I-15."6
- The carrying capacity of a heavy-rail system under heavy demand conditions, "is almost unequaled by any other mode of travel. Existing rapid transit systems can carry comfortably between 20,000 and 34,000 passengers per track per direction each hour. For projected light rail systems, that number is approximately 10,000."7
Scenario-Based Analysis Description
In order to illustrate the benefits of modal diversification, this thesis focuses on a proposed high-speed rail service for California between Los Angeles and the San Francisco Bay Area, with possible extensions north to Sacramento, southeast to San Bernardino and Riverside, and south to San Diego. A scenario-based analysis considers several service interruptions that have the potential to cause severe economic losses. The benefits of the HSR service are illustrated in a sensitivity analysis that uses first-order estimates. First-first-order estimates are necessary because of the inability to predict the exact impact of service disruptions on the transportation system. In general, the benefits of HSR during service interruptions, if they occur, are expected to range from
several million dollars (i.e., labor strikes, terrorism, and earthquakes) to several billion dollars (i.e., policy changes relating to air quality, energy constraints and global warming).
7 US. Committee on Banking, Finance and Urban Affairs, New Urban Rail Transit: How Can its Development and Growth-Shaping Potential be Realized?, 96th Congress, 1st Session, U.S. Government Printing Office, December 1979, p.207.
Other congested corridors that have established political and financial support for proposed HSR projects through the 1991 Intermodal Surface Transportation Efficiency Act (ISTEA) are as follows:
- Buffalo-Albany-New York;
e Chicago Hub (Chicago-Milwaukee, Chicago-Detroit, Chicago-St. Louis); - Eugene-Portland-Seattle-Vancouver;
e Tampa-Orlando-Miami; and " Washington-Charlotte.
These corridors, along with the California corridor, are in need of additional capacity because of chronic air and highway congestion. In order to justify the need for high-speed rail, rail advocates should highlight the economic and social benefits obtained from modal diversity during service disruptions. These diversification benefits along with the "conventional" benefits of rail such as improved mobility and reduced accidents may help to push these high-speed rail projects to the top of transportation funding lists.
Introduction Summary
In conclusion, the following thesis will explore the hypothesis that, in specific corridors, the "conventional' and diversification benefits of an additional mode outweigh the
benefits of increasing capacity to existing modes, and that diversification benefits could outweigh the additional costs of a new mode. While many studies consider the
diversification are most often ignored. These benefits are measured in terms of reduced
response time needed for a transportation system to recover from a service interruption.
When a system responds well to service disruptions, then the economic and social
losses are minimized.
The thesis will discuss three different categories of service interruptions, and will show
how modal diversification could help to alleviate their impacts. Chapter II focuses on
the myriad of service interruptions that can disrupt transportation systems in the
United States. Chapter III highlights the benefits of diversification. Chapter IV
illustrates through various scenarios how modal diversification, using high-speed rail,
would benefit an intercity corridor in California. Chapter V summarizes the
vulnerabilities of the transportation system, the ability of modal diversification to
alleviate the impacts of service interruptions, the benefits of diversification as it relates
to the proposed high-speed rail project in California, and topics for future research.
Appendix A covers in more depth the scenario-based calculations in Chapter IV
pertaining to the California high-speed rail project; Appendix B makes available the
intercity highway volume data used in the scenario-based analysis calculations for
highway service interruptions.
Chapter II:
Transportation Vulnerabilities
Introduction
The transportation system is vulnerable to the following service interruptions:
1) Policy changes relating to air quality, energy constraints, and global warming;
2) Natural disasters such as earthquakes, floods, snow storms and tornadoes; and 3) Human-caused disruptions such as terrorism and labor strikes.
The causes of these disruptions range from infrastructure failures (i.e., earthquakes and terrorism) to travel restrictions (i.e., air pollution policy measures and snow
emergencies). (Figure 3) For example, the main reasons for earthquake-related service interruptions are infrastructure failures caused by faulting, vibration, tsunamis, and
ground failures. The three types of service disruptions are described in more detail
below; we discuss the likelihood of their occurrence, their potential impacts on the transportation system (i.e., duration and cost of incident), and the role that
FIGURE 3
Disruptions to the Intercity Transportation System
Transportation-Related Policy Changes
Natural
isasters
Human-Caused
Interruptions
Air Pollution
- Travel restrictions caused by direct policies such as driving quotas or indirect policies such as gasoline taxes.
- Energy Constraints
- Travel restrictions caused by gasoline shortages..
- Global Warming
- Travel restrictions caused by direct policies such as driving quotas or indirect policies such as gasoline taxes.
Earthquakes
- Infrastructure failures caused by faulting, vibrations, ground failures and tsunamis.
- Floods
- Travel restrictions caused by water, mud and debris on infrastructure - Snow Storms
- Travel restrictions caused by excess snow on infrastructure - Tornadoes
- Infrastructure failures - Travel restrictions caused by water and debris
- Labor Strikes
- Infrastructure failures or travel restrictions caused by transportation sector strikers
such as bus employees, air traffic controllers, and train employees. - Terrorism - Infrastructure failures caused by bombings or derailments. - Travel restrictions caused by airplane hijackings
D
Transportation-Related Policy Changes
Introduction
Transportation-related policy changes for air quality, energy constraints and global
warming may occur when the cost to society becomes unbearable. The likelihood and impact of these demand-side policies depends on the extent of the problems, and on the political will to solve them. Air pollution, global warming and oil dependency are protracted problems that need long-term and possibly draconian measures to reverse.
Since highway and air travel are energy-inefficient modes, and are large contributors to air pollution and greenhouse gas emissions, major mode shifts are needed in order for the transportation system to contribute less to these negative externalities. To enforce such a change in behavior, decision makers would have to implement policies that directly affect highway and air travel such as driving restrictions, or policies that indirectly affect transportation systems such as gasoline tax increases or other pricing measures. Since high-speed rail consumes only about one-third of the oil equivalent per unit of traffic as passenger cars and one-quarter for aircraft, this mode would be an integral component of any diversification strategy that is used to minimize the impacts of air quality, energy constraint and global warming regulations.8
Modal diversification helps to ease the transition towards a more energy-efficient transportation system. When intercity traveling options are expanded beyond driving
and air travel, travelers will not have as much need for their highway vehicles. As their
8
Michael Walrave, "High-Speed Rail: An Important Asset Reconciling Mobility, Energy Saving and Environmental Requirements," In: Reconciling Transportation, Energy and Environmental Issues: The Role of Public Transport, Conference Proceedings, European Conference of Ministers of Transport, European Commission. May -June, 1994, p. 82.reliance on highway vehicles decreases, fuel consumption and emission rates also decrease, alleviating the need for expensive pollution reduction policies. Modal diversification can be considered as a "carrot" or incentive approach to reducing gasoline consumption since the goal of this strategy is to make it easier for travelers to
change their behavior without causing economic hardships. For example, since HSR can be competitive with air and highway travel in terms of both time and cost, a
transition to this more energy-efficient mode would not involve major additional economic costs to travelers. Thus, if a transportation-related policy was implemented and a diverse intercity transportation system existed, then the system would be better able to respond to modal shifts towards more energy-efficient, low-emitting travel. Furthermore, with the presence of a multimodal intercity system, transportation-related policy changes may become more politically feasible to deploy because the economic disruptions would be minimized.
Transportation-Related Policy Changes: Air Quality
Air Pollution Problem Description
The population living in areas that exceed National Ambient Air Quality Standards (NAAQS) ranges from 112 million individuals in 101 urban areas in 1988 to 67 million
individuals in 96 areas in 1989. Air pollution levels vary in part because of transitory changes in weather; the summer of 1988 was hot while the summer of 1989 was cool.9 California experiences some of the worst air pollution in the nation if not the world.
Highway vehicles are one of the primary sources of emitters. In the South Coast Basin,
the region's eight million highway vehicles cause over 50 percent of the pollution. In
order to meet national ambient air quality standards by the year 2010, highway vehicle miles traveled (VMT) need to be reduced by 60 percent in this region.10
Other examples of non-attainment areas in the United States include the following:
e Extreme Exceedance Level: Denver, and Los Angeles;
e Severe: Baltimore, Chicago, Houston, Milwaukee, San Diego, and Ventura County; e Serious: Atlanta, Boston, Sacramento Valley, and San Joaquin Valley; and
- Moderate: Charlotte, Phoenix, Salt Lake City, and the San Francisco Bay Area.
In general, exposure to air pollution exacerbates preexisting respiratory, circulatory and olfactory system conditions, and decreases crop productivity. Olfactory system
problems are difficult to evaluate, yet doctors have received reports of vomiting, coughing, nausea, shallow breathing, changes in respiratory and cardiovascular
systems and depression. 1 1 Individuals who are particularly vulnerable to air pollution include the elderly, young children, and persons with asthma, emphysema and heart disease. The effects of exposure range from minor eye irritation to death. Concerning
reductions in crop productivity, air pollution causes the United States to lose a total of several billion dollars in crops annually.2
Causes ofAir Pollution
Air pollution occurs when primary emissions such as nitric oxide (NO) and sulfur dioxide (SO2) react with sunlight in the troposphere (i.e., the lower atmosphere about
10 Michael Cameron, Transportation Efficiency: Tackling Southern California's Air Pollution and Congestion, Environmental Defense Fund, Regional Institute of Southern California, March 1991, p. 5.
11
Richard W. Boubel, Donald L. Fox, D. Bruce Turner, and Arthur C. Stern, Fundamentals of Air Pollution, Third Edition, Academic Press, New York, 1994, p. 107.
six to 12 miles from the earth) to form secondary products such as nitrogen dioxide (NO2) and sulfuric acid (H2SO4), respectively. (Figure 4) Natural and anthropogenic (human-made) sources are responsible for discharging primary emissions. Natural
sources consist of volcanoes that emit particulate matter, fires that emit carbon dioxide and hydrocarbons, and even oceans that emit salt forming aerosols. Anthropogenic
sources include stationary emissions such as industries and utilities, and mobile emissions such as automobiles. When natural and anthropogenic sources are combined, emissions exceed healthy levels in many urban areas throughout the nation.13
FIGURE 4
Precursor-Product Relationship of Atmospheric Chemical Reactions
Oxygenated
Hydrocarbons
Hydrocarbons
+
Sunlight
4
NO /0 H2SO4 N0NO2
NO2
S02
03
Precursor Gases
Products of Atmospheric
Reactions
Note: NO = nitric oxide; SO2= sulfur dioxide; NO2 = nitrous oxide; H2SO4= sulfuric acid; 03= ozone.
Source: Richard W. Boubel, Donald L. Fox, D. Bruce Turner, and Arthur C. Stern, Fundamentals of Air Pollution, Third Edition, Academic Press, New York, 1994.
12 James J. MacKenzie, Michael P. Walsh, Driving Forces: Motor Vehicle Trends and their Implications for Global Warming,
Energy Strategies, and Transportation Planning, World Resources Institute, Washington, D.C., December 1990, p. 8. 13 Richard W. Boubel, Donald L. Fox, D. Bruce Turner, and Arthur C. Stem, Fundamentals of Air Pollution, Third Edition, Academic Press, New York, 1994, pp. 72-78.
Highway vehicles contribute the largest share of air pollution emissions despite cleaner tailpipes because more individuals own automobiles and drive them farther
distances.14 In the United States, 54 percent of the carbon monoxide (CO) emissions,
and 30 percent of the nitrogen oxides (NOx) emissions originate from highway vehicles. Concerning volatile organic compounds (VOCs), the contribution from highway
vehicles is estimated to range from 28 percent to 45 percent in "ozone non-attainment areas" in 1985. The road vehicle share for CO has reached 90 percent in urban areas while VOCs have been recorded as high as 66 percent in Los Angeles.15 16 These estimates may be low because highway travel and, hence, emissions occur primarily
during daylight hours when ozone is created from reactions with the sun.
Economic Impacts of Air Pollution Regulations
The economic impacts of air pollution regulations vary depending on the abatement policy. Although there is no single solution to decreasing highway vehicular emissions, some of the more cost effective approaches include targeting high emitters through early retirement programs, and policies that reduce driving through gasoline taxes. Other more stringent policies that restrict demand such as "no drive days" also are possible in the more severe non-attainment areas. These more severe regulations would
probably be the most successful at reducing highway vehicle emissions yet also would cause the greatest negative economic impacts.
Regarding the economic costs of these regulations, early retirement programs, for example, are shown to cost an average of $700 per high-emitting highway vehicle
14 Ibid, p. 399.
meaning that the total cost of the program for the United States is estimated to equal
about $12.6 billion. Since about ten percent of the road vehicle pool is expected to
cause about 50 percent of the pollution problems, early retirement programs would
target about ten percent of the road vehicles in the United States or approximately 18
million road vehicles. The cost estimate for the program is derived by multiplying the
number of high-emitting highway vehicles (18 million) by $700 per vehicle.
17 18Probability of Transportation Service Interrptions due to Air Quality Regulations
The United States Clean Air Act Amendments (CAAA) of 1990 include emission
reduction provisions for attainment of national ambient air quality standards. These
non-attainment requirements exist for carbon monoxide (CO), particulate matter
(PMo) and ozone (03). State Implementation Plans (SIP) set pollution reduction levels
and timelines depending on the severity of the problem in the air quality control region.
The United States Environmental Protection Agency is supposed to implement
transportation-related sanctions such as "no-drive days" if non-attainment areas do
not succeed in implementing the air quality requirements in the SIP.19
Benefts ofModalDiversfcation
In order to reduce the negative effects of transportation on air quality, policy makers
should promote low-emitting means of travel such as high-speed rail for intercity trips.
These modes do not emit as many precursor gases such as nitric oxide (NO) and sulfur
16 Richard W. Boubel, Donald L. Fox, D. Bruce Turner, and Arthur C. Stern, Fundamentals of Air Pollution, Third Edition, Academic Press, New York, 1994, p. 399.
17 The 18 million figure for road vehicles is derived by multiplying the number of vehicles per household in the United States (1.8 vehicles per household) by the estimated number of households (100 million households) in order to obtain the number of highway vehicles in the United States (180 million). The number of highway vehicles is then multiplied by 10 percent, the percentage of high emitters.
dioxide (SO2). Even though air pollution is considered an urban problem, emission reductions still can occur by decreasing the number of intercity trips because highway travelers destined for another urban area usually use their vehicles for intracity trips upon their arrival. Therefore, if less travelers were to use highway vehicles, then fewer intercity as well as intracity trips would be made.
When comparing the cost of modal diversification to other strategies, modal
diversification is a favorable option because this strategy reduces the need for punitive measures that have high economic and social costs. For example, an early retirement program for highway vehicles is estimated to cost approximately $12.6 billion to implement nationwide.20 If a few key intercity corridors throughout the nation
diversified using HSR, then it is assumed that the effect is to decrease the need for the early retirement program by ten percent, totaling $1.26 million nationwide. Moreover,
the early retirement program is not sufficient in alleviating air pollution emissions in
most non-attainment areas meaning that the costs of this program represent only a fraction of the investment needed to improve air quality. A wide array of punitive measures would be necessary in order to achieve emission reduction standards. Modal diversification can help offset the costs of these punitive measures.
19 Arnold M. Howitt, Joshua P. Anderson, Alan A. Altshuler, The New Politics of Clean Air and Transportation, A. Alfred Taubman Center for State and Local Government, John F. Kennedy School of Government, Harvard University, November 1994, pp. 204-214.
Transportation-Related Policy Changes: Energy Constraints
Energy Constraint Problem Description
The United States is vulnerable to energy constraints not only because of its dependence
on foreign oil, but also because of its unwillingness to recognize that current oil reserves
are expected to last another tens-of-years as opposed to thousands-of-years. The U.S.
imports more than half of the oil it consumes, exposing the country to world oil price
and supply fluctuations, and to an uneven balance of trade. The annual cost of
imports totaled more than $60 billion in
1992.21
This figure does not include the costs
of oil spill cleanups (i.e., the Exxon Valdez spill) nor does it consider the costs involved
in protecting the nation's oil import supply lines (i.e., the 1990 Gulf War). The United
States not only consumes more than it produces, it also uses much more than its
proportion of world crude oil (25 percent) compared to its world population (five
percent).
22The rate of consumption is expected to increase causing economists to
predict that imports will equal almost 60 percent by the year 2000.23
Causes ofEnergy Constraints
The United States' dependence on automobiles and air travel are major contributing
factors to this country's appetite for foreign oil. The transportation sector uses about
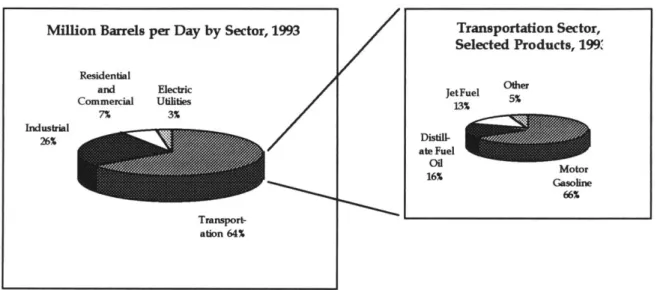
two-thirds (64.9 percent) of the petroleum consumed in the United States. Motor
gasoline represents the majority (68.9 percent) of the petroleum consumed by the
transportation sector. (Figure 5) Energy substitutes exist for the transportation sector,
21 Phillip S. Myers, "Reducing transportation fuel consumption: how far should we go?" Automotive Engineering, September 1992, p. 9 0
22 General Accounting Office, Other Nations' Policies to Reduce Oil and Coal Use in Transport and Industry, May 1993, p. 4 2 . 23
Energy Information Administration, Annual Energy Outlook, 1994 with Projection to 2010, Department of Energy, 1994, p. 68.
however, they tend to be more expensive and have their own set of negative
externalities. For example, an increase in the use of coal would decrease the reliance on imported fuels, and yet it contributes to global climate change, erosion and water quality problems. Nuclear energy is potentially hazardous as Chernobyl and Three
Mile Island accidents demonstrate, and has waste storage problems; methanol is expensive and uses valuable croplands; and electric vehicles are not yet cost effective because of inefficient batteries. 24
FIGURE 5: UNITED STATES PETROLEUM CONSUMPTION
Transportation Sector, Selected Products, 199. JetFuel O 13% 5% Distill-ate Fuel OilMor 16% Gahee 66%
Source: Energy Information Administration/Annual Energy Review, 1993
The transportation system is dependent on petroleum in the short run because the
primary means of intercity travel in the United States are via energy-inefficient modes such as air and highway travel. The automobile and the airplane represent two of the most energy-inefficient modes of travel. A single-occupancy automobile consumes 6,530 Btu per passenger mile, a single-occupancy truck/van uses 9,048 Btu per
passenger mile while
intercity
rail consumes only 2,537 Btu per passenger mile.
25In
other words, "for every passenger carried one kilometer, an intercity train uses one-third
the energy of a commercial airplane, and one-sixth the energy of an automobile with a
sole occupant."
26Economic Impacts of Energy Constraint Regulations
A lack of energy policy insight made the national economy vulnerable to oil shocks in
1973/74, 1979 and 1990 causing sharp recessions during and after their occurrences.
The economic impacts of these shocks had varying negative effects due to the length of
the crisis, the amount of oil supply reduction, the economy before the shock, and
monetary policies used to lessen the impact. Regarding the amount of gasoline
shortage, the 1973/74 and 1979 oil shocks experienced a maximum quarterly gasoline
shortfall of 13 percent and 11 percent, respectively.
27Concerning the length and size of
the crises, the 1973 oil embargo lasted for six months and saw oil prices increase from
$10.67 per barrel in 1973 to $21.28 in 1974; the 1979 oil shock persisted for nearly two
years with oil price increases from $22.35 per barrel in early 1979 to $50.75 per barrel in
early 1981; and the 1990 oil shock reversed itself after five months with oil prices
increasing to $33.18 per barrel in October, 1990 from $16.15 in July,
1990.28(Table 2)
2
s Phillip S. Myers, "Reducing Transportation Fuel Consumption: How Far Should We Go?, Automotive Engineering, September 1992, p. 90.
26 Marcia D. Lowe, Back on Track The Global Rail Revival, Worldwatch Paper 118, Worldwatch Institute, April 1994, p. 12. 27 David T. Hartgen, Joanna M. Brunso, and Alfred J. Neveu, "Initial and Subsequent Consumer Response to Gasoline Shortages," Special Report 203: Proceedings of the Conference on Energy Contingency Planning in Urban Areas, Transportation Research Board, National Research Council, Washington, D.C., 1983, p. 38.
28
John A. Tatom, "The 1990 Oil Price Hike in Perspective," Federal Reserve Bank of St. Louis, November/December 1991, p. 12.
TABLE 2
Crude Oil Price Increases
1973 1979 1990
Before Oil Shock $10.67 $22.35 $16.15
During Oil Shock (peak price) $21.28 $50.75 $33.18
Source: Federal Reserve Bank of St. Louis, November/December 1991.
Output and productivity declined shortly after oil prices skyrocketed while
employment and monetary growth rates had a delayed cyclical response. (Table 3) The productivity growth rate, which is used as an indicator for business sector output per hour, decreased earlier than real gross national product (GNP) during the 1973 and 1979 oil shocks (i.e., OPEC1 and OPEC2, respectively) and remained in a slump for the
1990 oil shock (i.e., IRAQ). The real GNP growth rate, which is used as an indicator for
economic output, slowed for all three oil shocks. Another source shows GNP figures that are consistent with Table 3 for OPEC1 and OPEC2. These figures reveal that
during the 1973/74 oil shock, the growth rate of the real GNP dropped from 5.8 percent in 1973 to -0.6 percent in 1974 and then another -1.1 percent in 1975. During the 1979 oil shock, the growth rate of the real GNP dropped from 3.2 percent in 1979 to -0.2 percent in 1980.29
Table 3
Economic Performance Surrounding Three Energy Price Shocks
Real GNP growth rate OPEC1
OPEC2 IRAQ
Productivity growth rate OPEC1
OPEC2 IRAQ
Civilian employment growth rate
OPEC1 OPEC2 IRAQ
Average unemployment rate OPEC1 OPEC2 IRAQ Period OPEC1 OPEC2 IRAQ Previous Year (%) 4.4% 5.3 1.0 1.5 0.6 -0.6 3.5 3.9 0.9 5.0 5.9 5.3
First Two- Second Two- Third Two- Fourth Two-Quarter Period (%) Quarter Period (%) Quarter Period (%) Quarter Period (0/)
0.7% 1.6 -0.1 -1.3 -2.6 -0.2 3.3 1.6 -1.1 5.0 5.8 5.7 111/1972 to 111/1973 IV/1973; 1/1974 1/1978 to 1/1979 II and 111/1979
II/1989 to 11/1990 III and IV/1990
-2.0% 1.6 -1.7 -2.1 0.4 0.2 0.9 1.7 -1.0 5.4 6.1 6.7 II and 111/1974 IV/1979; 1/1980 I and 11/1991 -5.6% -4.5 -0.4 -3.9 -1.9 IV/1974; 1/1975 II and III/1980 5.5% 6.6 1.8 2.7 8.7 7.4 II and 111/1975 IV/1980; 1/1981
Concerning employment changes, these figures did not peak until a year after the oil shocks for the 1973 and 1979 oil embargoes. An article in the European Economic Review, discussed employment figures that are consistent with Table 3 for OPEC1 and OPEC2. For the 1973 oil shock, the rate of unemployment increased from 4.9 (1973),
5.6 (1974) to 8.5 (1975); for the 1979 oil shock, the unemployment rate increased from
6.0 (1978), 5.8 (1979) to 7.2 (1980).30 For the 1990 oil shock, employment growth rates
declined at a much faster rate than the 1970s oil shocks because of the sluggish economy that existed before the oil price hikes.31
Probability of Transportation Servie Interruptions due to Energy Crises
Since the most recent oil shock in 1990, the United States is even more dependent on foreign oil, and the Clinton Administration has not made any substantial progress in countering the trend. The U.S. consumption of petroleum continues to rise past
domestic production causing a gap in 1993 of 6.73 million barrels per day of imported
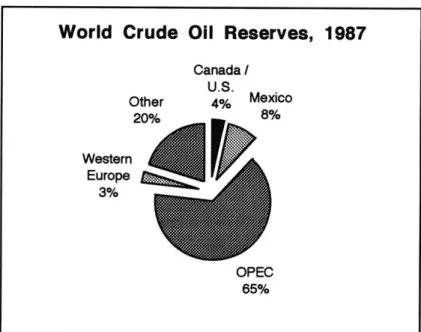
crude oil. (Figure 6) This increased need for imported oil makes the United States more dependent on foreign powers, and less self sufficient. Furthermore, experts predict that worldwide petroleum reserves will last for only another tens-of-years when considering the current level of reserves. As of 1987, about two-thirds of these reserves were concentrated in the hands of a few OPEC countries making the likelihood of price
increases almost certain during this time.3 2 (Figure 7) Recently, more world reserves have been located in Russia and the North Sea, which helps to decrease the power of
OPEC. Nevertheless, OPEC is expected to regain its power as the world appetite for oil
30 Jeffrey Sachs, "The Oil Shocks and Macroeconomic Adjustment in the United States," European Economic Review 18,
1982, p. 244. 3 1
John A. Tatom, "The 1990 Oil Price Hike in Perspective," Federal Reserve Bank of St. Louis, November/December 1991, pp. 14-16.
32 Energy Information Administration, Annual Energy Review 1993, United States Department of Energy, Washington, D.C., 1993.
increases. An Economist article helps to justify this argument by stating, "beyond the end of this decade OPEC could become powerful once again. World oil demand is likely to increase sharply. In developing countries, car ownership and electricity demand are growing rapidly. The International Energy Agency predicts that the demand for oil in China alone will rise by 5% a year until 2010."33
Benefts ofModalDiversifcation
In order to create a less energy dependent transportation system, national policies and programs should encourage diversification of the transportation system as a way to minimize use of energy-intensive automobiles and air travel, and to maximize the use
of more efficient modes such as buses and rail. Policy makers should establish more energy- efficient systems well before an energy crisis ensues since engineers need time to design and build public transportation infrastructure, and new technological solutions take time to implement.
33 -,"Energy: Pipe Dreams in Central Asia," The Economist, May 4,1996, p.3 7 .
FIGURE 6
U.S. Crude Oil Statistics, 1993
(Million Barrels per Day)
1963 1973 1983
I
-.
--Production
-A-ConsumptionSource: Energy Information Administration/Annual Energy Review 1993
FIGuRE 7
World Crude
Other 20% Western Europe 3%il Reserves, 1987
Canada / U.S. 4% Mexico 8% OPEC 65%Source: Energy Information Administration/Annual Energy Review 1993 I' 4
I
I
14 12 10 8 6 4 2 0 1953 1993Transportation-Related Policy Changes: Global Warming
Global Warming Problem Description
By the year 2030, atmospheric carbon dioxide is expected to double (2xCO
2) costing
between 1.0 and 2.5 percent of the United States' gross national product (GNP). The
cost estimate varies because of scientific uncertainties associated with the impacts of
global warming, and the differences in quantifying the costs of non-market items such
as mortality and discount rates.
mSome other predictions of the warming trend are as
follows:
-
By the year 2030, the average global temperature is expected to increase by 3.6
degrees Fahrenheit (with a confidence interval of 2.5' to 5' F) compared to
pre-industrial levels;
-
Polar ice caps are expected to melt making the sea level rise by an expected 6 to 20
inches above 1990 levels by 2050. Higher sea levels bring about coastal flooding,
erosion and wetland disturbances.
35One-fourth of Florida and Louisiana, and
one-tenth of New Jersey could be inundated.
36-
Droughts are predicted to occur in greater frequency and with more intensity,
especially in mid-continental areas; and
37-
Drier conditions are expected in the western two-thirds of the United States and
Canada.
3834 Ibid, p. 55.
35
Michael P. Walsh, "Motor Vehicle Trends and their Implications for Global Warming," Transport Policy and Global
Warming, European Conference of Ministers of Transport, 1992, pp. 73-74.
36
Joseph G. Morone and Edward J. Woodhouse, Averting Catastrophe Strategies for Regulating Risky Technologies, University of California Press, Los Angeles, 1986, p. 99.
37
Michael P. Walsh, "Motor Vehicle Trends and their Implications for Global Warming," Transport Policy and Global
Causes of Global Warming
Global warming is caused by an excess of greenhouse gases that have been released into the atmosphere. Greenhouse gases like carbon dioxide (CO2) allow sunlight to pass to the earth and then they trap radiated infrared heat causing the atmosphere to warm. This process occurs naturally, yet anthropogenic sources such as the burning of fossil
fuels for automobile use have accelerated the rate producing an imbalance in the system. (Figure 8) Carbon dioxide accounts for about 50 percent of global warming; chlorofluorocarbons (CFCs) make up approximately 20 percent; methane (CH4)
contributes between 13 and 18 percent; tropospheric (lower atmospheric) ozone accounts for about eight percent and nitrous oxide (N20) represents six percent.39 (Figure 9)
38 Joseph G. Morone and Edward J. Woodhouse, Averting Catastrophe: Strategies for Regulating Risky Technologies, University of California Press, Los Angeles, 1986, p. 99.
39 Michael P. Walsh, "Motor Vehicle Trends and their Implications for Global Warming," Transport Policy and Global
- UF m mm - - .U~
FIGURE 8
Mean Monthly Concentrations of Atmospheric C02 at Mauna Loa
350
340
-0 330-C 0 320- 310[-1960 1965 1970 1975 1980 1985Year
Source: Richard W. Boubel, Donald L. Fox, D. Bruce Turner, and Arthur C. Stern, Fundamentals of Air Pollution, Third Edition, Academic Press, San Diego, 1994.
FIGURE 9
Source: Michael P. Walsh, "Motor Vehicle Trends and their Implications for Global Warming," Transport Policy and Global Warming, European Conference of Ministers of
Transport, 1992.
Anthropogenic Sources
of Global Warming, 1990
50 40-- 30-- 20-- 10-0 C02 CFCs CH4 Ozone N20Concerning carbon dioxide, automobiles cause about 25 percent of the anthropogenic carbon dioxide emissions in the United States. The domestic breakdown is as follows: electric power plants (33 percent), motor vehicles, planes and ships (31 percent), industrial plants (24 percent), commercial and residential buildings (11 percent), and other (one percent). The primary global anthropogenic contributions include the burning of fossil fuels (85 percent) and deforestation (15 percent). These emissions have grown by about 25 percent since pre-industrial times and continue to increase by
about 0.5 percent per year. Worldwide motor vehicle contributions grow by about 2.4 percent per year, which represents an increase of two-thirds by the year 2030 compared
to 1990.40
Chlorofluorocarbons (CFCs) not only cause global warming, these gases also reduce the protective layer of stratospheric ozone causing an increase in ultraviolet radiation. According to the Environmental Protection Agency (EPA), vehicle air conditioning represents the primary CFC user in the United States, accounting for about 16 percent of total US CFC use in 1989. The Montreal Protocol mandates a phasing out of CFCs by the year 2000. Nevertheless, these gases will remain in the atmosphere for the next
two centuries.41
Ozone in the troposphere (i.e., the lower atmosphere about six to 12 miles from the earth) is created when sunlight reacts with nitrogen oxides (NOx). Nitrogen oxides are
formed by the burning of fossil fuels and biomass, and by volatile organic compounds. In the United States, motor vehicles are a major source of nitrogen oxides (31 percent)
40 Ibid, pp. 72-81. 41 Ibid, p. 76.
and of volatile organic compounds (44 percent). In the northern hemisphere, ozone
concentrations are increasing by about one percent per year.
42Motor vehicles contribute only slightly to the production of methane (CH
4) and nitrous
oxide (N
20). The main sources of methane include rice production, termites and
anaerobic decay from bogs, wetlands and landfills. Motor vehicle emissions contribute
indirectly to methane production because as ozone increases methane also is shown to
increase. The main sources of nitrous oxide are suspected to be agricultural fertilizers,
the burning of coal, and catalytic converters.
43Based on GM Research, motor vehicles
emit approximately two percent of anthropogenic N
20 emissions.
44Economic Impacts of Global Warming Regulations
In order to reduce the production of greenhouse gases, the transportation sector could
decrease its consumption of fossil fuels by improving the efficiency of highway vehicles,
and by using more energy-efficient means of transportation such as high-speed rail.
Since carbon dioxide is the primary global warming culprit, abatement policies tend to
concentrate on this gaseous material. A 50 percent reduction from baseline carbon
dioxide emissions by 2025 or 2050 would decrease world GNP between one and two
percent. This figure ranges from 0.7 percent of GNP for the former Soviet Union, 4.7
percent for China to 1.3 percent for the United States.
45The financial impact would not
42
lbid, pp. 72-74.
43 James J. MacKenzie, Michael P. Walsh, Driving Forces: Motor Vehicle Trends and their Implications for Global Warming,
Energy Strategies, and Transportation Planning, World Resources Institute, Washington, D.C., December 1990, p. 5. " Michael P. Walsh, "Motor Vehicle Trends and their Implications for Global Warming," Transport Policy and Global
Warming, European Conference of Ministers of Transport, 1992, pp.7 2-7 3. 4 5
Samuel Fankhauser, Valuing Climate Change. the Economics of the Greenhouse, Economic and Social Research Council, Earthscan Publications Ltd., London., pp. 54-55.
be as high when considering secondary benefits like the reduction of air and noise pollution, balance of trade deficits, traffic congestion and accidents.46
Probability of Transportation Service Interrptions due to Global Warming
The most recent global warming mitigation plan, which arose from the 1992 Earth Summit in Rio de Janeiro, calls for a transportation sector greenhouse gas reduction of 8.1 million metric tons of carbon equivalent. This figure represents only 7.5 percent of
the total reductions needed to return greenhouse gas emissions to 1990 levels by the year 2000.47 Some of the largest gross emitting countries such as the United States have failed to make substantial progress towards these greenhouse gas emission reduction goals.
Due to recent advances that help to prove the validity of global warming, these countries are expected to make greater efforts towards decreasing greenhouse gas
emissions. Since automobiles are major contributors to global warming, the transportation sector will be a primary target for any greenhouse gas reduction
strategy. Emission taxes and other regulatory measures would help to decrease the prevalence of greenhouse gas emissions whereas modal diversification using high-speed rail, for example, would offer travelers lower-emitting traveling options.
46 Ibid, pp. 103-105. 47
Benefits ofModalDiversification
In order to decrease greenhouse gas emissions, global warming experts agreed that
countries should adopt measures that improve transportation efficiency by decreasing highway vehicle miles traveled.48 As stated in the impacts section, the cost of
abatement policies aimed at reducing VMT equals 1.7 percent of the United States' GNP. To decrease the economic effects of emission regulations, policy makers could
offer incentives to travelers by developing efficient and effective low-emitting intercity transportation alternatives such as high-speed rail (HSR). If HSR existed in key congested corridors throughout the nation, the transition from high-emitting to
low-emitting modes would be easier. When regulatory policies such as emission taxes are mandated, an existing HSR service may become the more economically sound
alternative for travelers.
Natural Disasters
Introduction
Natural disasters such as earthquakes, major snow storms, tornadoes and floods occur
at irregular intervals. The likelihood and impact of these severe conditions depends on geographic location, and on the intensity of the incident. Typically, these hazards cause localized infrastructure problems that may take several months to repair. Diverse transportation systems would help to minimize disaster-related transportation delays
in that if one mode was disrupted, another comparable mode if already in service could expand its capacity in order to alleviate the transportation supply constraint.
Natural Disasters: Earthquakes
Earthquake Problem Description
Earthquakes disrupt transportation systems not only by causing infrastructure failures, but also by causing oil supply, communication system, and power generating
disturbances. Earthquake-related service interruptions last as short as several hours for safety checks to as long as several months for infrastructure repairs. Diversification of the transportation system would help to alleviate the impacts of these service
interruptions in that a variety of transportation services help to spread the excess demand created when a particular mode is disrupted and others are not.
Impacts of Earthquakes
Transportation-related facilities that are at risk include: roads, railroad tracks, bridges,