HAL Id: inserm-02446749
https://www.hal.inserm.fr/inserm-02446749
Submitted on 21 Jan 2020
HAL is a multi-disciplinary open access archive for the deposit and dissemination of sci-entific research documents, whether they are pub-lished or not. The documents may come from teaching and research institutions in France or abroad, or from public or private research centers.
L’archive ouverte pluridisciplinaire HAL, est destinée au dépôt et à la diffusion de documents scientifiques de niveau recherche, publiés ou non, émanant des établissements d’enseignement et de recherche français ou étrangers, des laboratoires publics ou privés.
Rab6-dependent retrograde traffic of LAT controls
immune synapse formation and T cell activation
Jean-Marie Carpier, Andres Zucchetti, Laurence Bataille, Stephanie
Dogniaux, Massiullah Shafaq-Zadah, Sabine Bardin, Marco Lucchino,
Mathieu Maurin, Leonel Joannas, Joao Gamelas Magalhaes, et al.
To cite this version:
Jean-Marie Carpier, Andres Zucchetti, Laurence Bataille, Stephanie Dogniaux, Massiullah Shafaq-Zadah, et al.. Rab6-dependent retrograde traffic of LAT controls immune synapse formation and T cell activation. Journal of Experimental Medicine, Rockefeller University Press, 2018, 215 (4), pp.1245-1265. �10.1084/jem.20162042�. �inserm-02446749�
Ar ticle
The Rockefeller University Press
Jour
nal of Exper
imental Medicine
INTRODUCTION
T lymphocyte activation relies on the cognate recogni-tion by the TCR of the MHC-associated peptide ligand (pMHC) presented at the surface of an APC. Engagement of the TCR induces a cascade of biochemical reactions that
involves tyrosine phosphorylation of the CD3-ζ complexes
by the kinase Lck and recruitment of the cytosolic tyrosine kinase ZAP70 to these phosphorylated complexes (Weiss and Littman, 1994). ZAP70 then phosphorylates multiple tyrosines in the cytoplasmic domain of the transmembrane protein LAT (for linker of activated T cells; Zhang et al., 1998). Once phosphorylated, LAT interacts with several adapter proteins and enzymes near the site of TCR engage-ment and forms nanostructures of multimolecular signaling complexes (Sherman et al., 2011; Roncagalli et al., 2014), which organize hierarchically (Sherman et al., 2016) and segregate from inhibitory molecules (Su et al., 2016). These complexes control downstream signaling and T lymphocyte development (Zhang et al., 1998) and activation (Samel-son, 2002). This process is organized in time and space by a structure that forms at the interface between T lympho-cyte and APC: the immune synapse (IS). The IS allows the
long-lasting signaling required for T cell activation (Grakoui et al., 1999; Fooksman et al., 2010).
The TCR-induced signaling cascade has long been presented as a linear cascade of events taking place exclu-sively at the plasma membrane. However, it is now clear that TCR-induced signaling is modular and involves distinct pools of signaling molecules at the plasma membrane and in intra-cellular compartments (Ehrlich et al., 2002; Das et al., 2004; Yudushkin and Vale, 2010; Antón et al., 2011; Finetti et al., 2014; Bouchet et al., 2016). Along these lines, we and others have shown that the intracellular vesicular pool of signaling molecules including LAT plays a key role in T cell activation (Bonello et al., 2004; Purbhoo et al., 2010; Williamson et al., 2011; Larghi et al., 2013; Soares et al., 2013). Hence, TCR signaling is regulated by the traffic of these vesicles from and to the IS (Purbhoo, 2013; Onnis et al., 2016).
One of the key questions now relates to the origin of the vesicular pool of signaling molecules. We herein ad-dress this question for LAT.
LAT is present in two pools at steady-state: one that is close or at the plasma membrane and a pericentrosomal one (Bonello et al., 2004). Upon activation, both pools are
re-The adapter molecule linker for activation of T cells (LAT) orchestrates the formation of signalosomes upon T cell receptor
(TCR) stimulation. LAT is present in different intracellular pools and is dynamically recruited to the immune synapse upon stimulation. However, the intracellular traffic of LAT and its function in T lymphocyte activation are ill defined. We show herein that LAT, once internalized, transits through the Golgi–trans-Golgi network (TGN), where it is repolarized to the im-mune synapse. This retrograde transport of LAT depends on the small GTPase Rab6 and the target soluble N-ethylmaleim-ide-sensitive factor attachment protein receptor (t-SNA RE) Syntaxin-16, two regulators of the endosome-to-Golgi/TGN
retrograde transport. We also show in vitro in Syntaxin-16– or Rab6-silenced human cells and in vivo in CD4+ T lymphocytes
of the Rab6 knockout mouse that this retrograde traffic controls TCR stimulation. These results establish that the retrograde traffic of LAT from the plasma membrane to the Golgi-TGN controls the polarized delivery of LAT at the immune synapse and T lymphocyte activation.
Rab6-dependent retrograde traffic of LAT controls
immune synapse formation and T cell activation
Jean-Marie Carpier,
1* Andres E. Zucchetti,
1* Laurence Bataille,
1** Stéphanie Dogniaux,
1**
Massiullah Shafaq-Zadah,
3** Sabine Bardin,
2Marco Lucchino,
3Mathieu Maurin,
1Leonel D. Joannas,
1Joao Gamelas Magalhaes,
1Ludger Johannes,
3Thierry Galli,
4Bruno Goud,
2and Claire Hivroz
11Crosstalk between T Cells and Dendritic Cells Group, Institut Curie, Paris Sciences and Lettres Research University, INS ERM U932, Paris, France 2Molecular Mechanisms of Intracellular Transport Group, Institut Curie, Paris Sciences and Lettres Research University, CNRS UMR 144, Paris, France 3Cellular and Chemical Biology of Membranes and Therapeutic Delivery Unit, Institut Curie, Paris Sciences and Lettres Research University, INS ERM U1143,
CNRS UMR 3666, Paris, France
4Center of Psychiatry and Neurosciences, Membrane Traffic in Health and Diseased Brain, Université Paris Descartes, Sorbonne Paris Cité, INS ERM ERL U950, Paris, France
© 2018 Carpier et al. This article is distributed under the terms of an Attribution–Noncommercial–Share Alike–No Mirror Sites license for the first six months after the publication date (see http ://www .rupress .org /terms /). After six months it is available under a Creative Commons License (Attribution–Noncommercial– Share Alike 4.0 International license, as described at https ://creativecommons .org /licenses /by -nc -sa /4 .0 /).
*J.-M. Carpier and A.E. Zucchetti contributed equally to this paper.
**L. Bataille, S. Dogniaux, and M. Shafaq-Zadah contributed equally to this paper. Correspondence to Claire Hivroz: claire.hivroz@curie.fr
on February 13, 2018
jem.rupress.org
Downloaded from
http://doi.org/10.1084/jem.20162042
Supplemental material can be found at:
on February 13, 2018 jem.rupress.org Downloaded from on February 13, 2018 jem.rupress.org Downloaded from on February 13, 2018 jem.rupress.org Downloaded from on February 13, 2018 jem.rupress.org Downloaded from on February 13, 2018 jem.rupress.org Downloaded from on February 13, 2018 jem.rupress.org Downloaded from
cruited to the IS, and both have a role in T cell activation (Lil-lemeier et al., 2010; Purbhoo et al., 2010; Williamson et al., 2011; Balagopalan et al., 2013; Larghi et al., 2013). As stated, LAT is a palmitoylated integral membrane protein that traffics from the Golgi apparatus to the plasma membrane (Hundt et al., 2009). Upon TCR activation, microclusters contain-ing LAT and SLP-76, another adapter protein that binds phosphorylated LAT, transiently associate with the TCR and undergo endocytosis (Barr et al., 2006; Balagopalan et al., 2007). This endocytosis depends on the ubiquitylation of LAT by c-Cbl (Balagopalan et al., 2011). The pericentrosomal pool of LAT has been shown to colocalize with internalized transferrin (Bonello et al., 2004), suggesting that LAT does recycle. More recently, we showed that the recruitment of LAT-containing vesicles to the TCR activation sites depends on the vesicular–soluble N-ethylmaleimide-sensitive factor attachment protein receptor (SNA RE) VAMP7 (Larghi et al., 2013). We also showed that LAT phosphorylation, formation of the LAT signalosome, and T cell activation were controlled by this VAMP7-dependent traffic of LAT. Thus, although it is clear that LAT follows both an outward flow from centroso-mal intracellular compartments to the IS and an inward flow from the periphery to recycling endosomes, the exact path-way followed by this key protein of T lymphocyte activation is still poorly defined.
The retrograde pathway allows the trafficking of pro-teins and lipids from endosomes to the trans-Golgi network (TGN)–Golgi complex (Bonifacino and Rojas, 2006; Jo-hannes and Popoff, 2008). This pathway is highly conserved from yeast to mammals and involves complex machinery consisting of small GTPases, tethering factors, and SNA REs (Bonifacino and Rojas, 2006). Retrograde transport from early endosomes to the TGN was first discovered through the study of protein toxins (Mallard et al., 1998). Retrograde trafficking is tightly regulated by the retromer, a cargo sorting complex (Arighi et al., 2004; Seaman, 2004), the target SNA RE (t-SNA RE) membrane fusion protein Syntaxin-16 (Mal-lard et al., 2002), and the regulatory GTPase Rab6 (Martinez et al., 1994; Mallard et al., 2002).
Using in vitro and in vivo models, we herein identify the Syntaxin-16– and Rab6-dependent retrograde trafficking as an intracellular route used by LAT to directionally traffic to the immune synapse and demonstrate its importance for TCR-induced T cell activation.
RESULTS
LAT is mislocalized in the Golgi-TGN in the absence of VAMP7
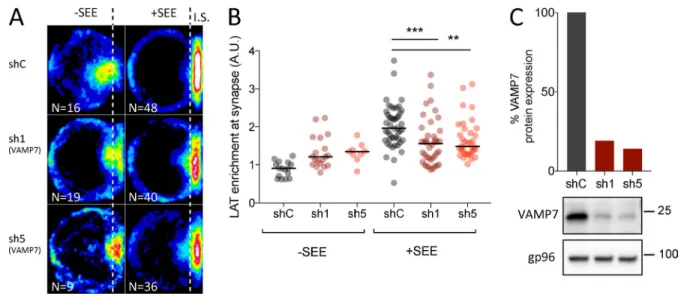
We previously showed that the recruitment of LAT to the immune synapse depends on the vesicular SNA RE VAMP7 (Larghi et al., 2013). In VAMP7-silenced Jurkat T cells forming conjugates with Staphylococcus enterotoxin type E (SEE)– pulsed antigen presenting cells, LAT was partially retained in intracellular compartments (Fig. S1 A) and as a consequence less recruited to the immune synapse (quantified in Fig. S1
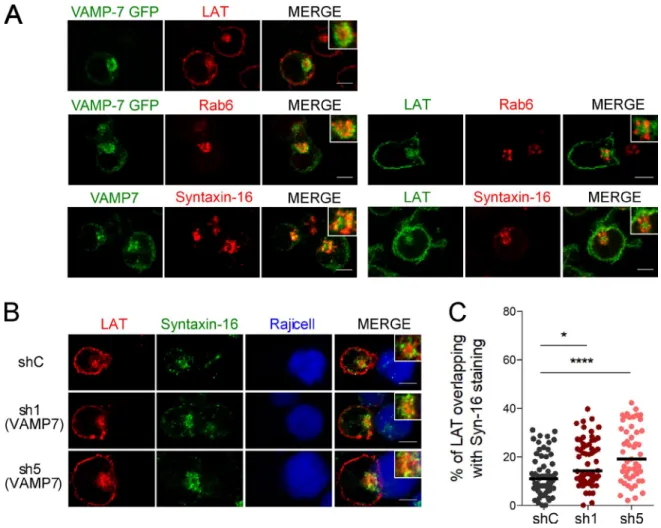
B) than in cells expressing a control nontargeting shRNA (shC) (see silencing in Fig. S1 C). We thus analyzed the rela-tive distribution of VAMP7 and LAT by confocal microscopy. In resting Jurkat T cells, LAT was juxtaposed with the VAMP7 compartments but was more central (Fig. 1 A). VAMP7, like in other cell types (Chaineau et al., 2009) was present in the Golgi of T cells as shown by its proximity with Rab6, a small GTPase associated with Golgi-TGN membranes (Goud et al., 1990) and with Syntaxin-16, a t-SNA RE localized to the Golgi stacks (Simonsen et al., 1998; Tang et al., 1998; Fig. 1 A). As shown previously for the relative distribution of VAMP7 and LAT, LAT was juxtaposed to the Golgi com-partments labeled with Rab6 or Syntaxin-16, but was more central, showing only an inconspicuous colocalization with these markers (Fig. 1 A). Thus, although VAMP7 is involved in LAT trafficking to the immune synapse, at the steady-state the central pool of LAT colocalized little with VAMP7, which was mainly present in Golgi–trans-Golgi compartments. We then studied the distribution of LAT in VAMP7-silenced Jur-kat T cells. In the absence of VAMP7, the intracellular pool of LAT colocalized more with the t-SNA RE Syntaxin-16 (Fig. 1 B; quantified in Fig. 1 C).
These results suggest that LAT transits through the Golgi–trans-Golgi compartments, where it is retained in the absence of VAMP7.
Purified membranes containing LAT also contain proteins involved in the retrograde transport from endosomes to the Golgi-TGN
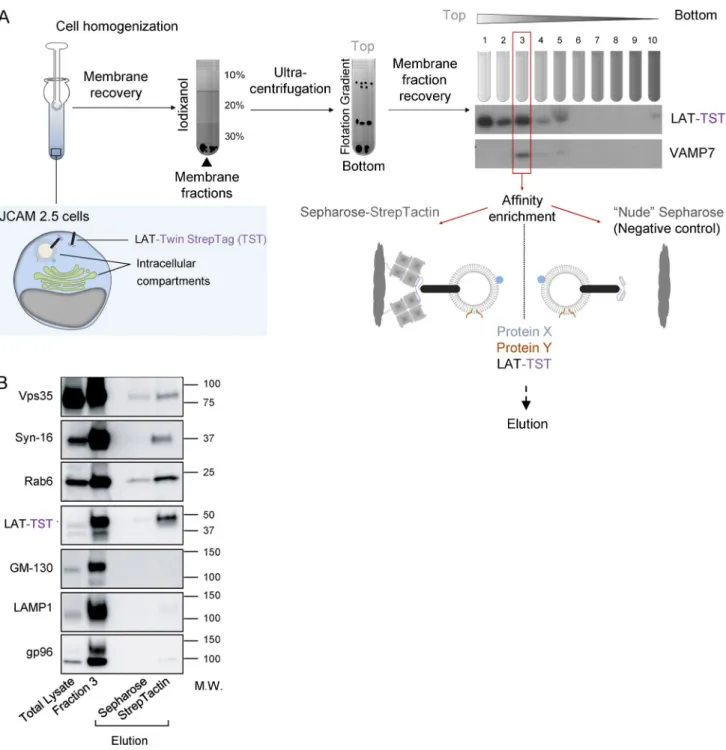
To get a better idea of the membrane compartments con-taining LAT, we purify these membranes and analyze their contents using a method already described (Hivroz et al., 2017). In brief (graphic summary of the process in Fig. 2 A), we mechanically disrupted the JCAM2.5 LAT-deficient T cell line (Finco et al., 1998) expressing the chimeric mouse LAT-Twin-Strep-Tag (LAT-TST; Roncagalli et al., 2014). After cell disruption, membranes were submitted to a floata-tion iodixanol gradient, and fracfloata-tions were collected from top to bottom. Fraction 3 retained our interest because it con-tained both the chimeric LAT-TST and VAMP7 (Fig. 2 A), which was shown to control LAT transport (Larghi et al., 2013; Fig. S1 A). We thus submitted this fraction to purifi-cation on Strep-Tactin Sepharose and eluted the retained material with biotin. By keeping the membranes intact, this protocol allowed the purification of molecules physically as-sociated with the LAT-TST chimeric protein as well as of molecules present in the same membrane compartments. Nonspecific binding controls were obtained by submitting fraction 3 to “nude” Sepharose precipitation and perform-ing elution as before. The small GTPase Rab6, a key reg-ulator of vesicular transport from and to the Golgi, was present together with the LAT-TST only in elutions from the Strep-Tactin Sepharose, showing that these two proteins are associated with the same membrane compartments (Fig. 2 B). Moreover, two proteins controlling the endosome-to-Golgi–
on February 13, 2018
jem.rupress.org
trans-Golgi retrograde trafficking route, i.e., the retromer component Vps35 (Seaman et al., 1998) and the t-SNA RE Syntaxin-16 (Mallard et al., 2002; Amessou et al., 2007), were also found in the eluted material, suggesting that LAT fol-lowed this transport pathway. GM130, a Golgin, LAMP1, a lysosomal membrane protein, and gp96, a chaperone of the endoplasmic reticulum, although detected in fraction 3, were absent from the eluted material, thereby establishing the spec-ificity of the purification.
Altogether, these results suggest that LAT transits through the Golgi–trans-Golgi compartment, where it is re-directed to the immune synapse.
LAT follows a Rab6/Syntaxin-16–dependent canonical retrograde transport from the plasma membrane to the Golgi-TGN, which is increased upon activation
To demonstrate that the endocytic LAT followed the retro-grade transport route from the plasma membrane to the Golgi
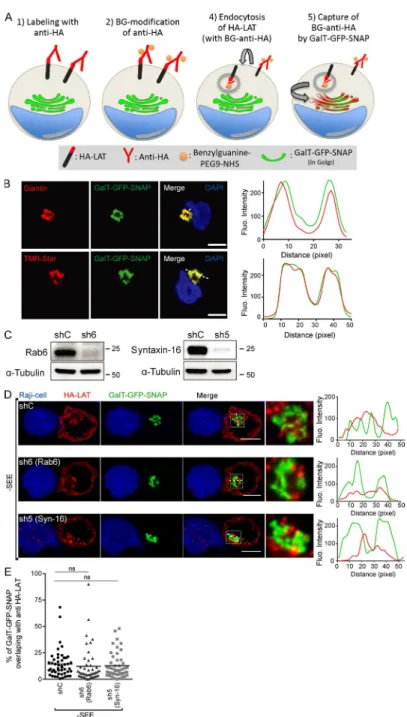
apparatus, we adapted a capture assay specifically developed to identify proteins that follow this route (Johannes and Sha-faq-Zadah, 2013). To do so, plasma membrane proteins are co-valently tagged with benzylguanine (BG). A capture reagent, the SNAP-tag, is fused to the Golgi membrane anchor from galactosyltransferase tagged with GFP (GalT-GFP-SNAP). After endocytosis, the BG-coupled proteins that are cargoes of the retrograde route to the Golgi-TGN are captured by the GalT-GFP-SNAP fusion protein upon formation of a co-valent linkage between BG and the SNAP-tag.
In our case, Jurkat T cells expressing the HA-tagged LAT, described elsewhere (Larghi et al., 2013), were infected with a lentiviral vector encoding the GalT-GFP-SNAP (Fig. S2 A, graphical summary of the method). As reported for other cell types, the GalT-GFP-SNAP was present in the Golgi of Jurkat T cells, as shown by its colocalization with Giantin (Fig. S2 B). Moreover, it was enzymatically active because it did react with the SNAP-Cell TMR-Star, a red fluorescent
sub-Figure 1. LAT dynamically transits through the Golgi-TGN. (A) Confocal images of the relative localization of VAMP7-GFP and LAT or Rab6,
endoge-nous VAMP7 and Syntaxin-16, or LAT and Rab6 or Syntaxin-16 in Jurkat T cells. Insets show the relative localization of VAMP7, LAT, Rab6, or Syntaxin-16. Representative of two independent experiments. (B) Confocal images of the relative localization of LAT and Syntaxin-16 in Jurkat T cells expressing a shC
or two VAMP7-targeting shRNA (sh1, sh5) in conjugates with Raji B cells. Insets show relative localization of LAT and Syntaxin-16 in control and VAMP-7– silenced Jurkat T cells. Bars, 5 µm. (C) Quantification of the colocalization of LAT with Syntaxin-16. Median is represented by horizontal lines. *, P < 0.05;
****, P < 0.0001 (one-way ANO VA). Data are from two independent quantifications.
on February 13, 2018
jem.rupress.org
strate of SNAP-tag fusion proteins (Fig. S2 B). After labeling of the cell surface pool of LAT at 4°C with the anti-HA antibodies (Abs) and washing, the non-membrane perme-able amino-reactive reagent BG-PEG-9-NHS was added to
the medium for 45 min at 4°C. After a second wash, cells were incubated at 37°C for 4 h to allow accumulation of the endocytosed Ab-labeled HA-LAT (Fig. S2 A). Finally, after fixation, colocalization of the GalT-GFP-SNAP and of the
Figure 2. LAT membranes contain proteins involved in the retrograde transport from recycling endosomes to the TGN. (A) Schematic
presen-tation of the purification of membranes containing LAT. JCAM2.5 LAT-deficient T cells expressing a chimeric mouse LAT-TST were mechanically disrupted. The membrane fraction was then submitted to a floatation gradient on iodixanol. After ultracentrifugation, 10 fractions from top to bottom were collected. Fraction 3 containing both the membrane associated LAT-TST and VAMP7 was mixed with Strep-Tactin Sepharose or uncoupled “nude” Sepharose as control. Eluted material was obtained by addition of biotin. (B) Western blot analysis of the eluted material. Total lysate obtained in the presence of detergent,
frac-tion 3, or material eluted from uncoupled Sepharose or Strep-Tactin Sepharose were run on SDS-PAGE and immunoblotted to reveal the indicated proteins. Molecular mass is indicated in kilodaltons. Experiment representative of two independent preparations.
on February 13, 2018
jem.rupress.org
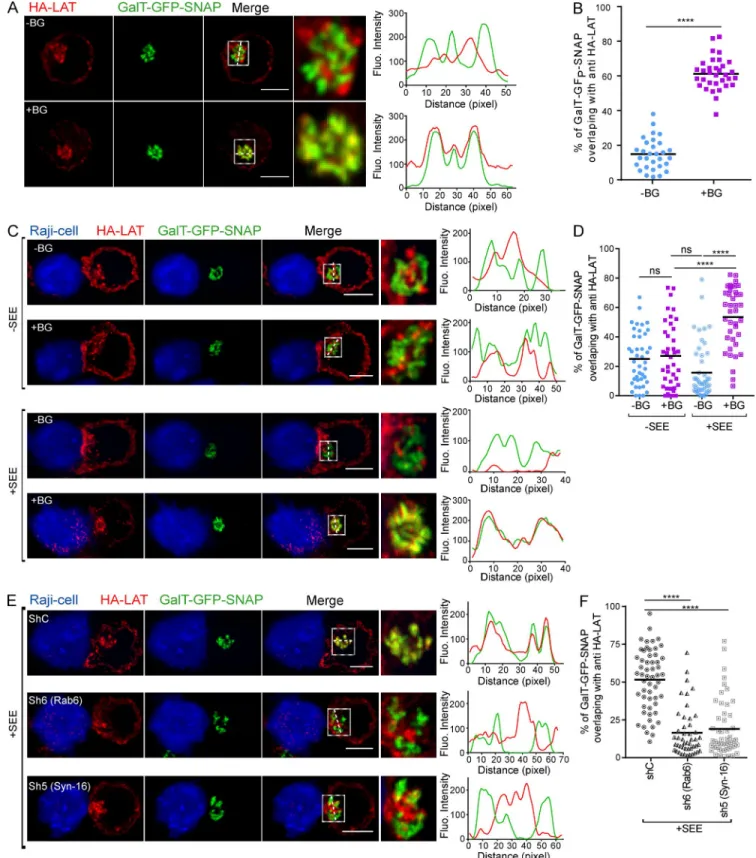
anti-HA was measured on confocal images. In the presence of BG-PEG-9-NHS, a colabeling between GalT-GFP-SNAP and anti-HA could clearly be detected (Fig. 3, A and B), showing that the plasma membrane pool of LAT that is con-stitutively endocytosed was captured in the Golgi. We then asked whether activation could increase the retrograde traf-fic of LAT. We thus performed the capture assay on Jurkat cells, incubated with anti-HA and BG-PEG-9-NHS as de-scribed above, which we then incubated with Raji B cells or SEE-pulsed Raji B cells for 30 min at 37°C. At this time point, no capture of the anti-HA/HA-LAT complexes was observed in Jurkat cells forming conjugates with unpulsed Raji (Fig. 3, C and D). Addition of SEE induced accumulation of the complexes in the Golgi, showing that TCR triggering increases the retrograde traffic of the endocytosed HA-LAT (Fig. 3, C and D). To formally demonstrate that LAT followed the retrograde transport from endosomes to Golgi-TGN, we silenced two proteins that play a key role in this transport pro-cess, the small GTPase Rab6 and the t-SNA RE Syntaxin-16 (Mallard et al., 2002), and performed a SNAP-tag capture assay as before (see silencing, Fig. S2 C). In the presence of SEE, an accumulation of the complexes was observed in the Golgi of Jurkat T cells expressing a control shRNA. Silenc-ing of both Rab6 and Syntaxin-16 significantly decreased the capture of the endocytosed HA-LAT in the Golgi (Fig. 3, E and F). As described, in the absence of SEE, no capture of the anti-HA/HA-LAT complexes was observed in 30-min con-jugates (Fig. S2, D and E).
Altogether, these results show that the plasma mem-brane pool of LAT, once endocytosed, follows the retrograde route from endosome to Golgi–trans-Golgi compartment in a Rab6/Syntaxin-16–dependent manner, and that this traffic is enhanced by TCR activation.
Rab6 and Syntaxin-16 control LAT recruitment to the immune synapse and signaling in T lymphocytes
We reasoned that the retrograde traffic of LAT from the plasma membrane to the Golgi–trans-Golgi membranes might con-trol its polarized resecretion to the immune synapse. To test this hypothesis, Rab6 or Syntaxin-16 was silenced in Jurkat cells, as before (silencing in Fig. S3 A for Rab6 and Fig. S3 C for Syntaxin-16), and endogenous LAT recruitment was analyzed by total internal reflexion fluorescence microscopy (TIR FM) in Jurkat cellsseeded on coverslips coated with an-ti-CD3 and anti-CD28 mAbs or poly-l-lysine as control, as previously described (Larghi et al., 2013). Upon stimulation, LAT microclusters were recruited to the immune synapse in cells expressing a control nontargeting shRNA (Fig. 4 A). In cells expressing Rab6- or Syntaxin-16–specific shRNA, LAT recruitment at the IS was decreased (Fig. 4, A and B, for Rab6; and Fig. 4, F and G, for Syntaxin-16). We also measured, in
Jurkat cells expressing a chimeric CD3-ζ–GFP, the
recruit-ment of CD3-ζ, which is also present in endocytic
com-partments (Blanchard et al., 2002; Yudushkin and Vale, 2010; Soares et al., 2013). In contrast to LAT, no decrease in the
recruitment of CD3-ζ was observed in Rab6-silenced cells,
but it was even increased in these cells (Fig. 4 C). These results suggest that the retrograde route from the plasma membrane to the Golgi apparatus is needed to polarize LAT at the IS
but is not needed for CD3-ζ recruitment. Plasma membrane
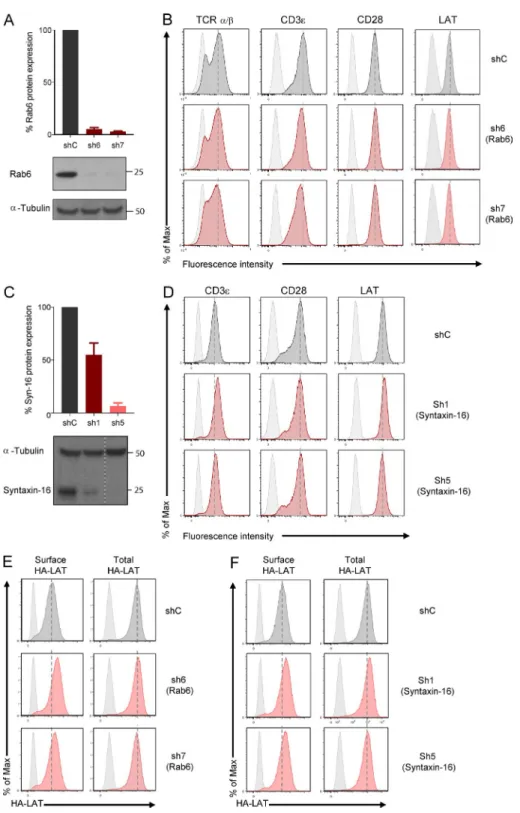
expression of CD3 and CD28 was not affected by Rab6 or by Syntaxin-16 silencing (Fig. S3 B for Rab6 and Fig. S3 D for Syntaxin-16). Total LAT expression was not affected, either (Fig. S3 B for Rab6 and Fig. S3 D for Syntaxin-16). Yet analysis of the different pools of LAT using the chimeric HA-LAT revealed that both Rab6 and Syntaxin-16 silencing induced an increased expression of HA-LAT at the plasma membrane for an unchanged total expression of HA-LAT (Fig. S3 E for Rab6 and Fig. S3 F for Syntaxin-16). Thus, although HA-LAT at steady-state is more expressed at the plasma membrane in Rab6 and Syntaxin-16–silenced T lym-phocytes, it is less recruited at the immune synapse after 10 min of activation (Fig. 4, B and G) and less phosphorylated (Fig. 4, D, E, and I). This suggests that once endocytosed, LAT requires transport via the Rab6/Syntaxin-16–dependent ret-rograde pathway to be recruited back to the IS, and that this endocytic pool of LAT plays a key role in LAT signaling.
TCR-induced recruitment of LAT has been shown to precede and to be essential for phosphorylation of LAT (Wil-liamson et al., 2011). We thus examined the phosphorylation of LAT in Jurkat cells in which Rab6 was silenced. Silenced Jurkat cells were activated with anti-CD3+CD28 Abs, and phosphorylation of LAT was analyzed by Western blot. Silenc-ing of Rab6 was accompanied by decreased phosphorylation of LAT (Fig. 4 D and quantified in Fig. 4 E, left). In contrast,
phosphorylation of the CD3-ζ chain did not show any
sub-stantial difference between control and Rab6-silencing condi-tions. In Syntaxin-16–silenced cells, we analyzed, by TIR FM, the phosphorylation of LAT and the recruitment of ZAP70 and its phosphorylation at the immune synapse. We showed that whereas the density of phospho-LAT microclusters was decreased in Syntaxin-16–depleted cells (Fig. 4 I), the density of ZAP70 microclusters was increased (Fig. 4 H), and that of phospho-ZAP70 microclusters (Fig. 4 J) was unchanged.
Together, these results show that Rab6 and Syntaxin-16 are required for the polarized delivery and phosphorylation of LAT at the immune synapse but are needed neither for the bulk transport to the plasma membrane nor for the
induc-tion of upstream signals such as CD3-ζ and ZAP70
recruit-ment and phosphorylation.
The retrograde transport machinery controls T lymphocyte functions
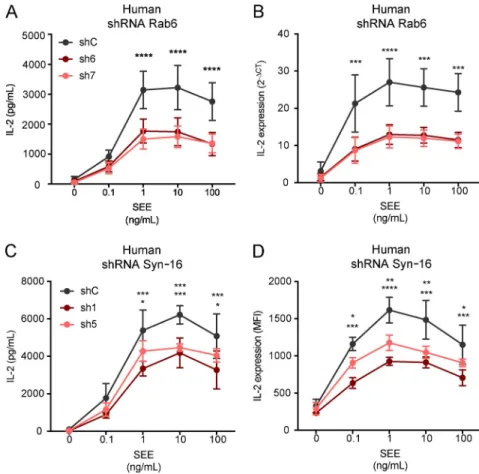
Jurkat cells silenced for the expression of Rab6 or Syntaxin-16 were activated for 6 h with Raji B cells pulsed with different concentrations of SEE. IL-2 present in the supernatants was measured by ELI SA and was significantly decreased in both the absence of Rab6 and Syntaxin-16 (respectively, Fig. 5 A and Fig. 5 C). To discriminate between inhibition of IL-2 secretion and inhibition of IL-2 production, we measured
on February 13, 2018
jem.rupress.org
Figure 3. LAT follows the Rab6/Syntaxin-16–dependent canonical retrograde transport from endosomes to the TGN. (A–F) Jurkat cells
express-ing both GalT-GFP-SNAP and HA-LAT were incubated at 4°C with anti-HA Ab, washed, and incubated at 4°C with (+BG) or without (−BG) BG-PEG9-NHS. After washing, cells were incubated at 37°C for 4 h (A and B) or activated on slides for 30 min with Raji cells (C–F) left unpulsed (−SEE) or pulsed with SEE (+SEE). Immunolabelings were performed using anti–mouse Ig (Alexa Fluor 568) to label the anti-HA Ab and anti-GFP to label the GalT-GFP-SNAP. Colocalization of anti-HA and GalT-GFP-SNAP is shown. Quantifications show Mander’s colocalization coefficient (B, D, and F). (B) Quantification of the
on February 13, 2018
jem.rupress.org
mRNA transcription by quantitative PCR in Rab6-silenced cells, and IL-2 production was measured by intracellular FACS in Syntaxin-16–silenced T cells (respectively, Fig. 5 B and Fig. 5 D). In both cases, IL-2 production was decreased, which showed that both Rab6 and Syntaxin-16 are involved in TCR-induced production of IL-2. An additional effect on secretion could not be excluded.
Thus, Rab6- and Syntaxin-16–dependent retrograde transport, which controls LAT delivery to the immune synapse and phosphorylation, is involved in T lymphocyte activation.
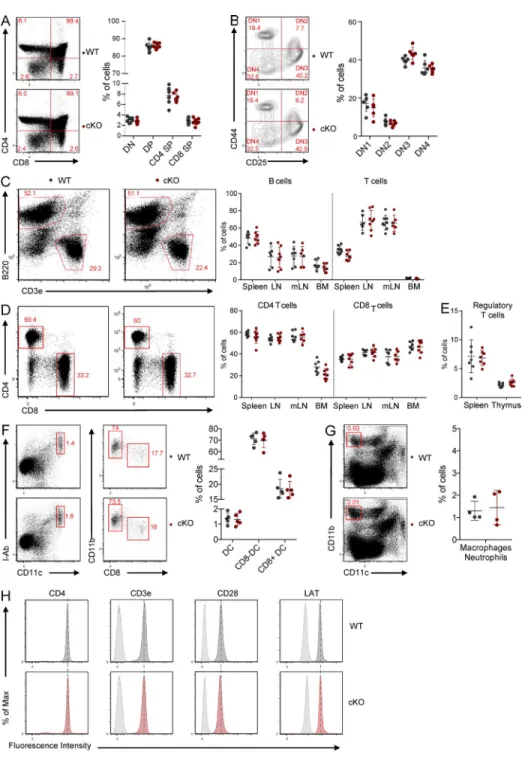
Analysis of LAT recruitment and T cell activation in Rab6-cKO T lymphocytes
To confirm the role of Rab6 in LAT recruitment and T lym-phocyte activation in primary cells, mice described elsewhere (Bardin et al., 2015) in which exon 4 of RAB6A was flanked
with LoxP sites were crossed with a CD4-Cre mouse line
(Rab6fl/flCD4-Cre+, hereafter referred as Rab6-cKO mice).
As expected, Rab6 protein was depleted in CD4+ T cells and
CD8+ T cells isolated from Rab6-cKO mice (not shown) but
not in other tissues (Fig. 6 A). In these mice, no gross pertur-bation of thymic development was observed. Thymic cellular-ity was normal, as well as the percentage of double-negative (DN), double-positive, and single-positive (SP) CD4 and CD8 T cells (Fig. S4 A). The four stages of differentiation of the
DN thymocytes (DN1, CD44+CD25−; DN2, CD44+CD25+;
DN3, CD44−CD25+; and DN4, CD44−CD25−) were also
normally represented in the Rab6-cKO (Fig. S4 B). In the periphery, the percentages of T lymphocytes (Fig. S4 C)
CD4+ and CD8+ (Fig. S4 D), and regulatory T cells (Fig. S4
E) were also unaltered. Percentages of B lymphocytes (Fig. S4
C), CD8+ and CD11b+ dendritic cells (Fig. S4 F), and
neu-trophils and macrophages (Fig. S4 G) were also normal in the periphery of Rab6-cKO mice.
LAT recruitment was measured by TIR FM in isolated
Rab6-cKO CD4+ T lymphocytes plated on coverslips coated
with anti-CD3 and anti-CD28 mAbs. Rab6-cKO CD4+ T
lymphocytes exhibited fewer LAT microclusters in the eva-nescent field of the TIR FM (Fig. 6 B), confirming in primary
CD4+ T cells that Rab6 is involved in LAT recruitment to
the synapse. This defect was not a result of a defect in CD3ε,
CD28, or LAT expression by Rab6-cKO CD4+ T cells (Fig.
S4 H). In contrast to LAT, the density of ZAP70 microclusters formed at the immune synapse was not altered in Rab6-cKO
CD4+ T lymphocytes (Fig. 6 C), showing that the first events
after TCR triggering are Rab6-independent.
We next tested the role of Rab6 in CD4+ mouse T
cell activation in the context of a mixed lymphocyte
reac-tion. Rab6-cKO and WT CD4+ T cells were labeled with
a cell proliferation dye and incubated for 5 d with different ratios of irradiated allogeneic splenocytes as stimulatory cells (Fig. 6 D). Proliferation of Rab6-cKO T cells was signifi-cantly decreased compared with littermate controls (Fig. 6, D and E). In contrast, proliferation of Rab6-cKO T cells in-duced by PMA/ionomycin was unaltered (Fig. 6 G), showing that Rab6-deficient T cells can proliferate normally when activated by drugs bypassing the TCR stimulation. Moreover, the defect was T cell intrinsic and not a result of a lack of
secreted factors because mixing WT and Rab6-cKO CD4+ T
cells labeled with two different dyes did not rescue the defec-tive proliferation of Rab6-cKO T cells (Fig. 6 F).
Thus, in primary mouse T lymphocytes, Rab6 con-trols LAT delivery to the immune synapse and T lympho-cyte activation, confirming our previous results obtained in the Jurkat T cell line.
In vivo T lymphocyte response is abrogated in the absence of Rab6
To further document the role of Rab6 in T lymphocyte ac-tivation, we analyzed T lymphocyte responses in vivo. To do
so, we first checked basal activation states of CD4+ T cells in
the sanitary context of our animal facility. Compared with
WT littermate controls, the proportion of naive CD4+ T cells
(CD62L+ CD44−) was significantly increased in the spleen,
bone marrow (BM), and blood of Rab6 cKO mice, whereas
effector/memory (CD62−CD44+) T cells were decreased
(Fig. 7, A and B). This defect might reflect a defect in the gen-eration or in the maintenance of memory T cells. To check if priming of T cells was altered in the absence of Rab6, we challenged the mice for a specific antigen in a polyclonal T lymphocyte context. To do so, cohorts of BM chimeras con-stituted of irradiated Rag2KO mice injected with BM from Rab6 cKO or WT littermate control mice were generated (experimental setup in Fig. S5 A). After 8–10 wk of recon-stitution, the B and T cell compartments were comparable in both groups of mice as shown by flow cytometry analysis of the blood of chimeras (Fig. S5 B). Mice were then challenged by subcutaneous injection with OVA protein emulsified with CFA. At day 11 after injection, spleens and draining lymph nodes (LNs) were restimulated for 24 h ex vivo with a non-relevant antigen (human serum albumin [HSA]), OVA
pro-tein class I (OVA257-264), or class II (OVA323-339) peptides, and
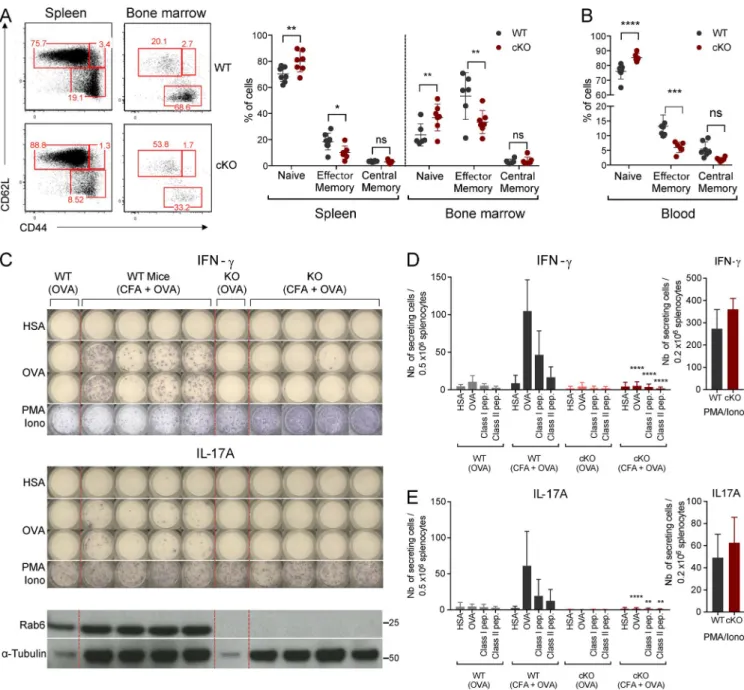
the IFN-γ response was assessed by ELI SPOT (Fig. 7 C). As
expected, WT chimeric mice robustly responded to OVA/ CFA challenge compared with mice injected with OVA alone. This response was antigen-specific given that irrelevant
colocalization after 4 h of antibody uptake. (D) Quantification compare colocalization in cells stimulated for 30 min with unpulsed or SEE-pulsed Raji B cells. (F) Quantification of the colocalization in Jurkat T cells, expressing a control (ShC), Rab6-specific (Sh6), or Syntaxin-16–specific shRNA (Sh5), activated with SEE-pulsed Raji B cells. Images show the maximum intensity from z-projections of three to five z-stacks covering the Golgi apparatus. Insets show the Golgi compartment. The profile plots of RGB images from ImageJ are shown. Means, n = 3 (A and B), 2 (C and D), and 2 (E and F) independent experiments for each condition. Bars, 5 µm. ****, P < 0.0001. (B) Student’s t test. (D and F) One-way ANO VA.
on February 13, 2018
jem.rupress.org
on February 13, 2018
jem.rupress.org
protein restimulation (HSA) did not induce an IFN-γ re-sponse (Fig. 7, C and D). In contrast, Rab6 cKO splenocytes
showed a much-reduced IFN-γ response (Fig. 7, C and D).
This was a global defect because IL-17A (Fig. 7, C and E), IL-2, IL-4, and IL-5 responses (Fig. S5, C–E) were abolished. Of note, PMA/ionomycin restimulation of WT and Rab6 cKO splenocytes induced similar responses (Fig. 7, D and E),
indicating that Rab6-deficient CD4+ T cells secreted a
nor-mal amount of cytokines when TCR triggering was bypassed. These results thus establish an important role of Rab6 in T lymphocyte activation in vivo.
Altogether, our in vivo results show that Rab6, which controls LAT retrograde traffic, plays a key role in T lymphocyte activation.
DISCUSSION
LAT is localized at the plasma membrane and in intracellular vesicles in T lymphocytes (Bonello et al., 2004). The relative contribution of each pool to the formation of microclusters found at the immune synapse and to activation of T cells is still unknown. Following up on the demonstration that the vesicular pool of LAT plays a critical role in T cell activa-tion (Purbhoo et al., 2010; Williamson et al., 2011; Larghi et al., 2013; Soares et al., 2013), we here demonstrate that LAT traffics via the canonical Rab6/Syntaxin-16 retrograde route from the plasma membrane to the Golgi-TGN before being resecreted to the immune synapse. Our results also show that this retrograde trafficking is of critical importance for T lym-phocyte activation both in vitro and in vivo.
Indeed, membranes containing LAT also contain key molecules involved in the retrograde transport of cargoes from endosomes to the Golgi–trans-Golgi such as Rab6 and Syntaxin-16 (Fig. 2). Moreover, LAT, after being endocytosed from the plasma membrane, is routed to the Golgi (Fig. 3), and this transport is blocked by silencing of Rab6 or Syn-taxin-16 expression, two molecules involved in the canon-ical early/recycling endosomes to Golgi-TGN retrograde transport (Mallard et al., 2002). Interestingly, this retrograde transport is increased upon TCR activation, raising the ques-tion of the signaling machinery involved in this regulaques-tion. We show herein that at relatively late time point after activa-tion (10 min), this endosome to Golgi retrograde transport of LAT is necessary to the formation of LAT microclusters
at the immune synapse (Fig. 4), whereas it does not affect
the recruitment of CD3-ζ. Because CD3-ζ is also present in
endocytic compartments (Blanchard et al., 2002; Yudushkin and Vale, 2010; Soares et al., 2013), these results show that the endosome to Golgi retrograde transport does not apply to all the endocytosed signaling molecules involved in T cell activation. Our results also show that TCR signaling upstream of LAT recruitment was preserved as reflected by the normal
phosphorylation of the CD3-ζ chain in Rab6-silenced Jurkat
cells (Fig. 4) and normal density, at the immune synapse, of ZAP70 and phospho-ZAP70 in Syntaxin-16–depleted Jurkat
T cells (Fig. 4) and ZAP70 in Rab6 KO CD4+ mouse T cells
(Fig. 6). A more thorough analysis would be required to find out if other signaling molecules are affected by the inhibition of the retrograde transport.
It is worth noting that the decreased microcluster den-sity and phosphorylation of LAT at the immune synapse is not a result of a decreased expression of LAT at the plasma membrane. Rather, silencing of Rab6 or Syntaxin-16 both increase LAT expression at the plasma membrane without altering total LAT expression (Fig. S3). These results demon-strate that LAT neosynthesis is affected by neither Rab6 nor Syntaxin-16 silencing. They probably reflect the fact that al-tering one step of the very dynamic traffic of a molecule can induce an imbalanced distribution of this molecule. These results also reinforce data obtained by others and us showing that the plasma membrane pool of LAT is not the only pool contributing to LAT accumulation at the immune synapse and LAT signaling (Bonello et al., 2004; Purbhoo et al., 2010; Williamson et al., 2011; Larghi et al., 2013; Soares et al., 2013). Yet in our study, formation of the microclusters and phos-phorylation of LAT are not completely abolished. This leaves some space for a contribution of the plasma membrane pool of LAT to T cell activation that has been demonstrated (Balago-palan et al., 2013). It would be interesting to kinetically follow the formation of LAT microclusters in these conditions. The reduced formation of microclusters at the immune synapse is accompanied by a defective TCR-induced IL-2 production in T cells silenced for Syntaxin-16 or Rab6 (Fig. 5), and to strongly diminished mixed lymphocyte reactions (Fig. 6) and antigenic responses in T lymphocytes from Rab6 KO mice (Fig. 7). It is worth noting that although partial, the signaling defect induces an important functional T cell defect in vivo.
Figure 4. Rab6 and Syntaxin-16 control LAT microcluster formation at the immune synapse and LAT phosphorylation. (A) TIR FM images of
endogenous LAT in Jurkat cells expressing shC or Rab6-specific shRNA (sh6, sh7), incubated for 10 min on coverslips coated with poly-l-lysine alone (resting
conditions) or anti-CD3ε+antiCD28 Abs (αCD3αCD28, activating conditions) before fixation and staining. (B) Quantification, in the evanescent field, of the density of LAT microclusters in Jurkat cells or (C) CD3ζ-GFP in Jurkat cells expressing CD3ζ-GFP. (D) Immunoblot analysis of phospho-LAT, phospho-CD3ζ, total LAT, and Rab6 in Jurkat cells expressing the different shRNA and activated for different times with anti-CD3ε+antiCD28 Abs. (E) Quantification of phospho-LAT and phospho-CD3ζ intensities, normalized on loading control, and expressed as fold increase of intensity at time 0. (F) TIR FM images of LAT in Jurkat cells expressing shC or Syntaxin-16–specific shRNA (sh1, sh5). (G–J) Quantification of the density of microclusters of LAT (G), ZAP70 (H),
phos-pho-LAT (I), and phospho-ZAP-70 (J) in Jurkat cells, expressing control and Syntaxin-16–specific shRNA, activated for 10 min on coverslips coated with anti-CD3ε+antiCD28 Abs. *, P < 0.05; **, P < 0.01; ***, P < 0.001; ****, P < 0.0001 (one-way ANO VA). Median is represented by horizontal lines except in E, where mean is presented. All data are from two independent experiments, except for A, B and G, three independent experiments, and in E, three independent experiments each represented by one color. Bars, 5 µm.
on February 13, 2018
jem.rupress.org
Rab6 deficiency results in a decreased number of memory T cells, and a defect in the production of all the cytokines tested, including Th1, Th2, and Th17 cytokines (Fig. 7 and Fig. S5),
further supporting an impaired ability of CD4+ T cells from
Rab6fl/fl CD4-Cre+ mice to respond to TCR signaling. These defects are not accompanied by gross defects in T cell de-velopment (Fig. S4, A and B), unlike LAT-deficient mice, which show a severe defect in intrathymic T cell develop-ment (Zhang et al., 1999). This may be a result of the fact that
in CD4+ T cells from Rab6fl/fl/CD4Cre mice, LAT-dependent
signaling is not completely absent. Moreover, our data do not rule out a faulty maturation of T cells in the thymus that would require further analysis to be revealed.
We cannot totally exclude that diminished expressions of Rab6 and Syntaxin-16 have other effects than the mere recruitment of LAT at the immune synapse. Yet T cell activa-tion by PMA and ionomycin of Rab6-deficient T cells was preserved (Figs. 6 and 7), showing that signaling downstream
of PKC stimulation and Ca2+ increase does not require Rab6.
The retrograde endosome to Golgi pathway ensures several functions. First, retrograde transport can avoid the cargoes following this route from being degraded in lyso-somal compartments (Lu and Hong, 2014). This might apply to LAT because upon TCR activation this molecule is ubiq-uitinated (Brignatz et al., 2005; Balagopalan et al., 2007; Xie et al., 2013) and degraded in a compartment, yet to be
iden-tified. However, we did not observe any decrease in LAT expression in activated T lymphocytes in which retrograde transport was inhibited (not shown).
Second and nonexclusively, the retrograde endosome to Golgi–trans-Golgi pathway can ensure the polarized “re”-secretion of recycling molecules by collecting them back in the Golgi apparatus. In other words, LAT that reaches the Golgi–trans-Golgi membrane after retrograde traffick-ing from the plasma membrane could then be packaged into newly formed secretory vesicles for polarized secretion from the Golgi–trans-Golgi to the immune synapse (see Fig. 8 for schematic representation of the model). Indeed, this traffick-ing pathway has been shown in other cell types to regulate polarized signaling by allowing proteins that follow the retro-grade route to be secreted in a polarized manner to specific subdomains of the plasma membrane. This has been docu-mented for the transmembrane protein Crumbs, which in epithelial cells recycles from endosomes to the TGN and con-tributes to the apical-basal polarity of these cells (Pocha et al.,
2011; Zhou et al., 2011). This has also been shown for the β1
integrin that traffics in a Syntaxin-16– and Rab6-dependent manner from the plasma membrane to the TGN before being secreted in a polarized manner to the leading edge of migra-tory cells, allowing for persistent cell migration and efficient adhesion (Shafaq-Zadah et al., 2016). In T cells, retrograde transport of LAT back to the Golgi apparatus, which is
polar-Figure 5. Rab6 and Syntaxin-16 are required for TCR-induced IL-2 production by T lympho-cytes. (A–D) IL-2 production was measured in
Jur-kat cells activated for 6 h with Raji cells pulsed with different concentrations of SEE. (A and B) In cells ex-pressing control or Rab6-specific shRNA, IL-2 in the supernatant (ELI SA; A) or quantitative PCR of IL-2– specific cDNA (B). (C and D) In cells expressing control or Syntaxin-16–specific shRNA, IL-2 in supernatant (ELI SA; C) or produced inside the cells (intracellular flow cytometry; D). *, P < 0.05; **, P < 0.01; ***, P < 0.001; ****, P < 0.0001 (two-way ANO VA; mean and SEM). Data represent five experiments (A), four ex-periments (B), and three exex-periments (C and D).
on February 13, 2018
jem.rupress.org
on February 13, 2018
jem.rupress.org
ized toward the immune synapse (Kupfer et al., 1983; Stinch-combe et al., 2006; Chemin et al., 2012), would ensure the directional delivery of recycled pools of LAT back to the immune synapse. It would also allow the recycling pool of LAT to meet again the Golgi–trans-Golgi localized VAMP7 (Fig. 1 C), which is necessary for LAT transport to the TCR activation site (Larghi et al., 2013) and more generally for the transport of vesicles from the center to the periphery of cells (Burgo et al., 2012).
Third, LAT transport to the Golgi apparatus may allow signaling in this compartment (Mayinger, 2011). Indeed, compartmentalized activation of Ras/MAPK in T lympho-cytes has been reported (Bivona et al., 2003; Daniels et al., 2006; Zou et al., 2015).
We recently showed that the intraflagellar transport pro-tein IFT20 controls LAT recruitment to the immune synapse (Vivar et al., 2016). Of note, this protein, which is involved in immune synapse (Finetti et al., 2009, 2014) and cilium formation (Follit et al., 2006) is strongly associated with the Golgi complex (Follit et al., 2008), pointing once again at the Golgi as a major hub of LAT traffic. It would be interesting to study if the Golgi localization of IFT20 is required for LAT traffic and T cell activation. By regulating the recycling of LAT at the immune synapse, the retrograde transport could define the amount of LAT available for LAT signalosome formation, providing an efficient mechanism to fine-tune signaling in T lymphocytes. This could be particularly im-portant when T lymphocytes are activated by a low amount of MHC-peptide or weak agonists.
In conclusion, we propose herein a model in which retrograde transport from endosomes to the Golgi apparatus controls the polarized “re”-secretion of the recycling pool of LAT to the immune synapse, ensuring a sustained supply of signaling molecules and full T lymphocyte activation.
MATERIALS AND METHODS Cells and mice
Jurkat T cells (clone E6.1), JCAM2.5 cells stably expressing the mouse LAT-TST construct (Roncagalli et al., 2014),
Jur-kat expressing the CD3ζ-GFP chimera described elsewhere
(Blanchard et al., 2002), and Raji B cells were cultured at
37°C 5% CO2 in RPMI 1640 GlutaMAX (Gibco-BRL
61870–010; Gibco) supplemented with 10% FCS (DE14-801F, lot 0SB017; Lonza) and were passed every 2–3 d
at ∼0.5 × 10⁶ cells/ml.
The Rab6 mouse strain (Bardin et al., 2015) was crossed more than 10 generations on a C57BL/6J
back-ground. Detection of LoxP sites siding exon 4 of Rab6a/a′
gene was performed by PCR using the forward primer 5
′-TTG CCT CCC TGT ′-TTG TAC CAG TAC GCT-3′ and
re-verse primer 5′-CTT CAA CAC AAG CCA TGA AGG ATC
TGG-3′. To reach the excision of the exon 4 of Rab6 gene
in T lymphocytes, Rab6fl/fl mice were crossed with
trans-genic CD4-Cre mouse line. Rab6fl/fl CD4-Cre+ (Rab6-cKO
mice) and Rab6wt/wt CD4-Cre+ littermate controls (control
mice) were used for experiments. Both males and females were used and matched within each experiment. Organs (spleen, thymus, LNs, mesenteric LNs [mLNs], BM) from mice were disrupted, and filtered to obtain single-cell
sus-pensions. CD4+T cells were negatively isolated from spleens
and/or LNs with a Miltenyi kit (130–104-454; Miltenyi Biotec), and purity reached 95% mean. Mouse T cells were cultured in RPMI GlutaMAX supplemented with 10% FCS, 1% penicillin/streptomycin (Gibco-BRL 15–140-122; Gibco), 10 mM Hepes (Gibco-BRL 15630–080; Gibco), 1% nonessential amino acids (Gibco-BRL 11140–050; Gibco), 1 mM sodium pyruvate (Gibco-BRL 11360–070; Gibco),
and 0.05 mM β-mercaptoethanol (Gibco-BRL 31350–010;
Gibco) at 37°C, 5% CO2.
BALB/cByJ mice were purchased from Charles River Laboratories, and Rag2KO mice and CD4-Cre mice were bred in our animal facility. Irradiations of cells and mice were performed with an x-ray irradiator (Philips 320 kV), and times of exposure were calculated according to periodic dosimetry in order to reach the given irradiation doses. Mouse in vivo studies were ethically approved by the French “Ministère de l’Education Nationale et de l’Enseignement supérieur” gov-ernmental committee (approval number, 05301.03).
Reagents and antibodies
For Jurkat and primary CD4+ T cell activation, anti–
human activating antibodies, anti-CD3ε (clone OKT3,
10 µg/ml, 16–0037-85; eBioscience) and α-CD28 (clone
CD28.2, 10 µg/ml, 302923; Biolegend), and
recombi-Figure 6. LAT recruitment to the immune synapse and late T cell activation are deficient in Rab6 cKO CD4+ T lymphocytes. (A) Immunoblot
analysis of Rab6 and gp96 (loading control) expression in CD4+ T cells (left) or total kidney cells (right) isolated from control (WT) and Rab6 cKO mice.
Molecular mass is indicated in kilodaltons. (B and C) Quantification by TIR FM of the number of LAT (B) or ZAP70 (C) microclusters recruited to the immune
synapse in CD4+ T cells incubated on
poly-l-lysine alone or anti-CD3+anti-CD28 mAb (1 or 10 µg/ml). Bars, 5 µm. (D–F) Flow cytometry analysis of the
proliferation of CD4+ T cells isolated from control (Ctrl) or Rab6 cKO mice labeled with CTV proliferation dye and stimulated for 5 d by different numbers of
irradiated allogeneic Balb/C splenocytes (stimulatory cells) in a mixed lymphocyte reaction. (D) Representative experiment. (E) Percentages of proliferating CD4+ T cells from five Rab6 cKO or control mice. (F) Rab6-deficient CD4+ T cells labeled with the CFSE proliferation dye were either left alone (dark colors)
or mixed with (1:1) control CD4+ T cells labeled with CTV (light colors). Analysis of the percentages of proliferating CD4+ T cells exposed for 5 d to different
numbers of irradiated allogeneic Balb/C splenocytes was performed as in D. (G) Percentages of proliferating CD4+ T cells isolated from control or Rab6 cKO
mice left untreated (left) or stimulated for 5 d with low concentrations of PMA/ionomycin (7.5 × 10⁻⁷ M and 2 × 10⁻⁸ M; right). *, P < 0.05; **, P < 0.01; ****,
P < 0.0001; one-way ANO VA in B and C; two-way ANO VA in E; mean and SEM in D. Horizontal lines represent median in B and C. Data from three experi-ments in B, from two experiexperi-ments in C, and from four experiexperi-ments in E. Data representative from three experiexperi-ments in A, four in D, two in F, and three in G.
on February 13, 2018
jem.rupress.org
Figure 7. T lymphocyte response in vivo is abrogated in the absence of Rab6. (A) Representative flow cytometry analysis of naive (CD62L+CD44−),
central/memory (CD62L+CD44+), and effector/memory (CD62L−CD44+) CD4+ T cells in spleen and BM (left) from Rab6 cKO and control WT mice and
per-centages of these subpopulations (left). (B) Percentages of naive, central/memory, and effector/memory CD4+ T cells in the blood of Rab6 cKO and control
WT mice. (C) Representative ELI SPOT analysis of the IFN-γ (top) and IL-17A (middle) responses after immunization. Splenocytes from control or Rab6 cKO bone-marrow chimeras, immunized 11 d before with OVA or CFA+OVA, were restimulated in vitro for 24 h with HSA (irrelevant antigen), OVA, or PMA/ ionomycin. Each column represents one immunized mouse. Rab6 and α-tubulin expressions in CD4+ T cells isolated from LNs of the same mice are shown at
the bottom. (D and E) Quantification by ELI SPOT of IFN-γ– (D) or IL-17A– (E) secreting cells from splenocytes of mice immunized as before and restimulated with HSA, OVA, MHC Class-I and MHC Class-II OVA peptides (left) or PMA/ionomycin (right; WT-OVA, n = 3 mice; WT CFA/OVA, n = 13; cKO-OVA, n = 3; cKO-CFA/OVA, n = 13). Each symbol represents a mouse (A and B). *, P < 0.05; **, P < 0.01; ***, P < 0.001; ****, P < 0.0001 (two-way ANO VA). Data represent three independent experiments (C–E; mean and SD) and one experiment (B; mean and SD).
on February 13, 2018
jem.rupress.org
nant SEE (MBS1112600; Cellgenetech) were used. For
mouse T lymphocyte activation, anti-CD3ε (clone
145-2C11, 553057; BD Biosciences), anti-CD28 (clone 37.51, 553294; BD Biosciences), PMA (79346; Sigma-Aldrich), and ionomycin (407950; Calbiochem) were used at indicated concentrations.
Production of lentiviruses and infection of Jurkat cells
Nonreplicative VSV-g pseudotyped lentiviral particles were produced by transfecting HEK-293T cells with Gag, Pol, rev, encoding plasmid (pPAX2), envelop encoding plasmid (pMD2.G), and either the HA-Tev-LAT construct (Larghi et al., 2013) encoded in a pWXLD vector, or the
SNAP-GalT-Figure 8. Schematic representation: LAT is internalized in early/recycling endosomes and traffics back to the immune synapse through a Rab6- and Syntaxin-16–dependent endosomes to Golgi–trans-Golgi retrograde pathway. LAT constitutively recycles from the plasma membrane
to early/recycling endosomes. Our data suggest that vesicles from this compartment undergo a retrograde transport to the Golgi apparatus, which is increased upon TCR activation. Rab6 and Syntaxin-16, which play a key role in endosomes to Golgi–trans-Golgi retrograde pathway, are required for the resecretion of LAT containing vesicles to the immune synapse. Indeed, in the absence of these two molecules, LAT is not recruited to the immune synapse. We propose that this retrograde pathway allows the recycling pool of LAT to meet the VAMP7 vesicular SNA RE present in the Golgi–trans-Golgi membranes, which is necessary for the polarized transport of LAT to the TCR activation site. This polarized secretion of LAT and perhaps of other molecules controlled by the endosomes to Golgi–trans-Golgi retrograde route plays a key role in T cell activation as shown by the defective TCR stimulation of T lymphocytes lacking Rab6 and Syntaxin-16.
on February 13, 2018
jem.rupress.org
GFP construct (Johannes and Shafaq-Zadah, 2013) encoded in a pCDH-EF1-MCS-IRES-Puro vector (SBI System Biosci-ences), or shRNA sequences encoded in pLKO.1 plasmid. shC (Mission shRNA SHC002; Sigma-Aldrich), VAMP7-specific shRNA, sh1 (Mission shRNA, TRCN0000059888; Sigma-Al-drich) and sh5 (Mission shRNA, TRCN0000059892;
Sig-ma-Aldrich), Rab6a/a′-specific shRNA, sh6 (Mission shRNA,
TRCN0000379588; Sigma-Aldrich) and sh7 (Mission shRNA, TRCN0000379794; Sigma-Aldrich) and Syntaxin-16–spe-cific shRNA, sh1 (Mission shRNA, TRCN0000229991; Sig-ma-Aldrich), and sh5 (Mission shRNA, TRCN0000161930; Sigma-Aldrich) were used. Lentivirus were recovered in
su-pernatant after 2 d and concentrated. 5 × 10⁶ Jurkat T cells
were infected for 24 h, when silenced cells were selected in puromycine (2 µg/ml; Invivogen) and used 5 d after infection.
Plasmids and transfection
Plasmid encoding the GFP-VAMP7 chimeric molecule was described elsewhere: (Martinez-Arca et al., 2000). 10
× 106/500 µl cells were washed and resuspended in RPMI
without FCS and were electroporated, with 20 µg of the plasmid, in 4-mm gap electroporation cuvettes (5540–11; Molecular BioProducts) with a Gene Pulser electroporator (960 µF, 0.26 V; Biorad). Cells were recovered and diluted in warmed RPMI supplemented with 10% FCS and cultured
for 24 h at 37°C, 5% CO2.
Activation of Jurkat T cells for phospho-blot analysis
Jurkat T cells were activated in RPMI at 107 cells/ml with
anti-CD3 and anti-CD28 antibodies each used at 10 µg/ml. After activation, cells were put on ice in order to stop the ac-tivation, centrifuged at 1,800 g at 4°C, and incubated on ice for 20 min in 30 µl of ice-cold lysis buffer (50 mM Tris, pH 8,
150 mM NaCl, 1.5 mM MgCl2, 1% glycerol, 1% TritonX100,
0.5 mM EDTA, pH 8, and 5 mM NaF) supplemented with a protease inhibitor cocktail (11873580001; Sigma-Aldrich) and phosphatase inhibitor cocktail (78420; Thermo Fisher Scientific). Postnuclear lysates obtained by centrifugation at maximum velocity for 15 min at 4°C and were kept at −20°C before immunoblot analysis.
Preparation of LAT-containing membranes
To prepare membranes containing LAT, JCAM2.5 LAT-de-ficient Jurkat cells expressing the mouse LAT-TST protein (Roncagalli et al., 2014) were suspended in 0.25 M sucrose, 10 mM Tris-HCl, pH 7.4, and 1 mM EDTA (homogenization buffer) supplemented with a protease inhibitor cocktail (Sigma- Aldrich) and a phosphatase inhibitor cocktail (Thermo Fisher Scientific) and then transferred into a Dounce homogenizer (Kimble Kontes). Cell breakage was induced on ice by 25 successive stokes. The cell suspension was then passed 15 times through a 25-Ga needle to achieve cell disruption and centrifuged for 5 min at 900 g at 4°C to remove nuclei and intact cells. The supernatant was transferred into Ultra-clear centrifugation tubes (Beckman Coulter) and centrifuged
at 65,000 g for 1 h at 4°C in a SW55Ti rotor (Beckman
Coulter). The pellet was suspended in 1.2 ml of homogeni-zation buffer supplemented as before and passed several times through a 25-Ga needle to ensure complete resuspension of the membranes. This suspension was transferred into a new tube and mixed with 1.2 ma of a 60% solution of Optiprep/ iodixanol (Axis-Shield) to reach a 30% iodixanol suspension. The Optiprep solution was diluted extemporaneously into 0.25 M sucrose, 60 mM Tris-HCl, pH 7.4, and 6 mM EDTA to prepare 1.3 ml of a 20% solution and 1.2 ml of a 10% solution. The 20% and the 10% iodixanol solutions were lay-ered successively on top of the 30% suspension and centri-fuged at 350,000g for 3 h at 4°C in a SW55Ti rotor (342194; Beckman Coulter) without brake when stopping. Ten frac-tions of 490 µl were collected from the top of the tube. To purify LAT-StrepTag–associated membranes, fraction 3 was incubated for 90 min at 4°C on a rotating wheel with equal amounts of either prewashed Sepharose resin (IBA GmbH) or prewashed Strep-Tactin Sepharose resin in the presence of protease and phosphatase inhibitors. Resins were washed and suspended in StrepTag washing buffers (buffer W, 100 mM, Tris-HCl, 150 mM NaCl, and 1 mM, EDTA, pH 8.0) accord-ing to the manufacturer’s instructions. After 5 washes in buf-fer W, membranes were eluted from the resin by incubation for 8 min at 4°C with 2.5 mM of d-biotin (Sigma-Aldrich) diluted in buffer W. Eluted material was then submitted to SDS-PAGE and immunoblot analysis.
SNAP-tag capture assay
Jurkat cells expressing both the GalT-GFP-SNAP and the HA-LAT encoding constructs were incubated for 30 min at 4°C on a wheel with 1:100 of mouse anti-HA Ab (901515; Biolegend). The cells were washed with cold PBS and incu-bated for 45 min at 4°C on a wheel with membrane-imper-meable BG–PEG9–NHS (Johannes and Shafaq-Zadah, 2013). Cells were then incubated 4 h at 37°C in complete medium to analyze constitutive traffic of endocytosed LAT or put on slides together with Raji B cells for 30 min to form conju-gates as described in the “Preparation of Jurkat T cells and Raji B cells conjugates” section. Cells were then fixed and permeabilized and stained with anti-GFP (human anti-GFP from Institut Curie) to reveal the GalT-GFP-SNAP and anti– mouse Ig to reveal the anti-HA Ab. Colocalization of the pro-teins was analyzed as described in the “Analysis of HA-LAT trapping in Golgi in cells expressing SNAP-Tag” section.
Immunoblot analysis
Protein concentrations from mouse samples were determined with microBCA kit (23235; Thermo Fisher Scientific) by di-luting the samples to 1:50, and 10 µg of protein was loaded. NuPage LDS loading buffer (NP0008; Thermo Fisher Scien-tific) and reducing agent (NP0009; Thermo Fisher ScienScien-tific) were added to postnuclear lysates that were heated at 95°C for 5 min. Samples were resolved on NuPage 4–12% Bis-Tris gel (NP0323BOX; Thermo Fisher Scientific) and liquid
on February 13, 2018
jem.rupress.org
transferred (NP00061; Thermo Fisher Scientific) on PVDF membranes (162-0177; Biorad). After blocking with 1× TBS, 0.05% Tween20, 5% BSA for 1 h 30 min on a rocking plat-form shaker, membranes were incubated overnight at 4°C with primary antibodies anti-Rab6 (0.2 µg/ml, sc-310; Santa
Cruz Biotechnology), anti–α-tubulin (1:1,000, CP08;
Calbio-chem), anti–phospho-LAT Y191 (1:1,000, 07-278; Millipore),
anti–phospho-CD3ζ Y142 (1:1,000, 558402; BD Biosciences),
anti–Syntaxin-16 (0.1 µg/ml, ab134945; Abcam) or anti-gp96 (1:1,000, ADI-SPA-850; Enzo), anti-LAMP1 (1:1,000, 3243; Cell Signaling Technology), anti-GM130 (1:1,000, ab52649; Abcam), and anti–Vps-35 (1:1,000, ab10099; Abcam). Mem-branes were washed three times with TBS 0.05% Tween and incubated for 40 min in TBS 0.05% Tween on rocking platform shaker with the following secondary antibodies (1:20,000; Jackson ImmunoResearch): anti–rabbit HRP (111-036-046), anti–mouse HRP (115-035-146), or anti–rat HRP (112-035-143) according to primary antibody species. Membranes were washed three times and incubated for 1 min with HRP sub-strate (Enhanced Chemiluminescence, 32106; Thermo Fisher Scientific). Autoradiography films (28906844; Amersham) were exposed to membranes for different exposure times and were revealed with an AGFA CP100 film processor.
Immunofluorescence
Coverslip and dish preparation. 12-mm-diameter coverslips
(631-0666; VWR) were precoated with poly-l-lysine (0.02%, P8920; Sigma-Aldrich) for 20 min at room temperature and were washed three times in water before being dried and kept for a maximum of 2 d.
Preparation of Jurkat T cells and Raji B cells conjugates. Raji
B cells were washed, resuspended at a concentration of 106
cells/ml in RPMI without FCS, and labeled with CellTracker Blue CMAC dye (10 µM, C2110; Thermo Fisher Scientific) for 20 min in a 37°C waterbath. Labeling was stopped with RPMI 10% FCS, and cells were washed once and resuspended
at 106 cells/ml. Cells were pulsed with SEE (100 ng/ml) or
left untreated for 30 min at 37°C in a water bath before being
washed once and resuspended at a concentration of 0.5 × 10⁶
cells/ml. 75,000 Raji cells were incubated on coverslips for 30 min and washed once with warmed PBS, and 150,000 Jurkat cells resuspended in RPMI 10% FCS were added for 30 min. Coverslips were washed once with cold PBS before fixation.
Fixed TIR FM. Poly-l-lysine–coated coverslips were left
un-treated or coated overnight at 4°C or 3–4 h at 37°C with αCD3εαCD28 (human or mouse–specific), washed three times, and prewarmed at 37°C for 10–15 min. 150,000 Jurkat
T cells or mouse CD4+ T cells were incubated on coated
coverslips for 10 min before being washed once with cold PBS and fixed.
Fixation. Cells were fixed with 4% paraformaldehyde (15710;
Electron Microscopy Sciences) for 15 min at room
tempera-ture and washed once in PBS, and excess paraformaldehyde was quenched for 10 min with PBS 10 mM Glycine (G8898; Thermo Fisher Scientific). Coverslips were kept at 4°C in PBS until permeabilization and staining.
Staining. For regular staining, cells were permeabilized for 30 min at room temperature with PBS 0.2% BSA (04–100-812; Euromedex) and 0.05% Saponin (S4521; Sigma-Aldrich). Cells were incubated for 1 h at room temperature with the following primary antibodies: rabbit anti-LAT (5 µg/ml, 06– 807; Millipore), mouse anti-LAT (5 µg/ml, MAB63341; R&D Systems), rabbit anti–phospho-LAT (1:50, 3584; Cell Signaling Technology), rabbit anti–phospho-ZAP70 (1:50, 27015; Cell Signaling Technology), anti-ZAP70 (1:400, 3165; Cell Signaling Technology), rabbit anti-GFP (1:200, A11122; Thermo Fisher Scientific), mouse anti-GFP (1:200, A11120; Thermo Fisher Scientific) or human anti-GFP (produced by the Institut Curie platform), anti-Rab6 (1:400, 9625; Cell Signaling Technology), and anti–Syntaxin-16 (5 µg/ml, ab134945; Abcam) or anti-Giantin (produced by the Institut Curie platform). Cells were washed three times with 1× PBS, 0.2% BSA, 0.05% Saponin and incubated protected from light for 30 min in the same buffer with spinned secondary antibodies (1:300) anti–rabbit Ig Alexa Fluor 568 (A11036; Thermo Fisher Scientific), anti–rabbit Ig Alexa Fluor 488 (A11034; Thermo Fisher Scientific), anti–mouse Ig Alexa Fluor 568 (A11004; Thermo Fisher Scientific), anti–mouse Ig Alexa Fluor 488 (A11029; Thermo Fisher Scientific), or anti– human Ig Cy2 (709–225-149; Jackson Immunoresearch Lab-oratories) according to primary antibody species. After washing once with PBS BSA Saponin, and once with PBS, coverslips were soaked three times in PBS and three times in water and mounted on slides. For VAMP7 endogenous stain-ing, cells were treated as in Larghi et al. (2013).
Mounting. For regular confocal microscopy, coverslips were
mounted with 4–6 µl of Fluoromount G (0100–01; Souther-nBiotech) on slides (KNI TTEL Starfrost) and dried overnight protected from light before microscope acquisition.
For TIR FM, after staining with secondary antibody, coverslips were soaked in PBS and mounted with 4–6 µl of PBS, sealed with uncolored nail polish, and dried for 15 min before acquisition.
Microscopy and image analysis
Microscopes. Confocal images were acquired with a Laser
Scanning Confocal (LSM780; Zeiss) from the PICT-IBiSA @ Pasteur Imaging Facility at Institut Curie, equipped with 40× or 100× Plan Apo objectives (numerical apertures, 1.35), and a 1–airy unit pinhole size was used. Single-plane images or z-stack images were acquired. TIR FM was performed using an inverted Nikon microscope Ti-E from the Nikon Imaging Center at Institut Curie-CNRS with a 100× CFI Apo TIRF and equipped with objective (numerical aperture of 1.49), 491 nm and 561 nm lasers, and an EMC CD 512 Evolve
on February 13, 2018
jem.rupress.org
era (Photometrics). Images were analyzed on Fiji (Schindelin et al., 2012), and ImageJ software and compatible scripts were generated for automated or semiautomated analysis.
Analysis of LAT recruitment to the immune synapse between Jurkat and Raji conjugates on confocal images and “mean
cell” creation. Middle plane images with from similarly
di-mensioned z-stack images of conjugates were chosen, and T cells were cropped and oriented in the same way regarding their synapse (script 1). Created images were grouped by con-dition (shRNA ± SEE), and fluorescence intensities were normalized by the mean fluorescence intensity (MFI) of all images. Images were then resized to the smallest image size in order to create stacks of images for each group (script 2). Each stack was normalized to MFI, mean height, and mean width of all groups in order to obtain conditions with comparable total cell MFI and identical sizes. Stacks of aligned cells were finally projected (averaging method), giving single-plane “mean cells” (script 3). Then, in order to obtain mean inten-sity profiles along cell width, stacks of images from script 2 were normalized to MFI and mean width of all experimental groups and were resized to obtain a 1-pixel height stack by averaging the fluorescence intensity of the total height of each image. Projected images were created based on mean and SD methods, and pixel intensities were measured along image widths (script 4). To get a cell-by-cell quantification, MFI of total cells and MFI of rectangles at the synapse region representing 10.5% of the total cells were measured plane by plane for each stack from script 2. Ratios of both MFIs were calculated, giving LAT enrichment at the immune synapse, expressed in arbitrary units (script 3).
Analysis of the recruitment of molecules to the immune
syn-apse on TIR FM images. Before imaging cells, TIR FM angle
was set up to provide an evanescent field of fixed thickness
(∼120–150 nm). Illuminated microclusters were imaged, and
the background was substracted (50 pixels, rolling ball radius) for each acquired image. Cells were manually segmented, and regions of interest (ROIs) were defined in order to measure their areas. Then, within each ROI, microclusters present in the evanescent field were defined as signal intensity maxima detected by using the “Find Maxima…” method, for which a value of noise tolerance was arbitrarily set according to back-ground from experiment to experiment (values around 5,000 in most experiments). Using this method allowed the dis-crimination of maximas coming from clusters (local bright patches at the plasma membrane or just below in the limit of thickness of the evanescent field) from an homogeneous sig-nal. The number of “maximas” was then counted for each ROI, giving a cell-by-cell quantification of the number of microclusters or density of microclusters at or below the plasma membrane.
Analysis of colocalization on confocal images based on
over-lapped areas. Middle planes of z-stack images of similarly
di-mensioned conjugates were chosen. Masks for Raji B cells labeled with CellTracker Blue CMAC dye were obtained by automatic thresholding (“Otsu” method). Masks of T-B con-jugates were created with LAT staining background by using automatic thresholding (“Default” method). B masks were substracted from T-B masks, creating T masks that were de-fined as ROIs by using the “Analyze Particles…” function. Within each ROI, a Golgi mask based on Rab6 or Syn-taxin-16 staining was created by thresholding. LAT areas, Golgi areas, and overlapping areas were calculated, and ratios of overlapping areas/LAT areas were calculated and ex-pressed in arbitrary units.
Analysis of HA-LAT trapping in Golgi in cells expressing
SNAP-Tag. Z-stack (0.5 µm) images of similarly dimensioned
conjugates or Jurkat cells were chosen. In that z-stack, a ROI surrounding the Golgi was defined based on GalT-GFP-SNAP staining. Within each ROI, masks based on both GalT-GFP-SNAP and HA-LAT stainings were created by thresholding. Automatic colocalization assays were performed with Mander’s overlap coefficient, using the JACoP plugin for ImageJ64. Colocalization plots, in representative images showing the maximum intensity from z-projections of three to five z-stacks, were obtained using the “RGB Pro-filer” plugins on ImageJ.
IL-2 secretion and production assay in Jurkat cells. Jurkat T
cells and Raji B cells were washed and resuspended at 106
cells/ml. 100 µl Jurkat cells and 50 µl Raji cells were mixed in a 96-well plate, flat bottom (92096; TPP). 50 µl of SEE at the final indicated concentrations was added for 6 h. Supernatants were recovered and tested for IL-2 by ELI SA (BD OptEIA, 555190; BD Biosciences). Total mRNA was isolated from cells with NucleoSpin RNA kit (740–955; Macherey Nagel), and IL-2 mRNA expression was assessed by quantitative PCR using the Taqman method and IL-2 mRNA targeting primers (Hs00174114_m1; Thermo Fisher Scientific). For in-tracellular cytometry, after 1 h activation, 25 µl of brefeldin-A (B6542; Sigma-Aldrich), at the final concentration of 5 µg/ ml, was added to each well for an additional 5 h.
Mixed lymphocyte reaction
Spleens from BalB/C mice were dissociated into cell suspen-sion, filtered, irradiated (20 Gy), and used as stimulatory cells. In the case of separated culture of Rab6 cKO and control
CD4+ T cells, stimulatory cells and responder cells were
respec-tively labeled with CFSE dye (2 µM, C34554; Thermo Fisher Scientific) and CellTrace Violet (CTV) dye (2 µM, C34557;
Thermo Fisher Scientific). 4 × 10⁵ responder cells were
cocul-tured with indicated numbers of stimulatory cells. In the case of Rab6 cKO and control responder cells coculture, control and cKO cells were respectively stained with CTV and CFSE dyes and mixed with the indicated amount of stimulatory cells. As positive control, cell proliferation was induced with phorbol
myristate acetate (7.5 × 10⁻⁷ M) and ionomycin (2 × 10⁻⁸ M).
on February 13, 2018
jem.rupress.org