HAL Id: hal-02661326
https://hal.inrae.fr/hal-02661326
Submitted on 30 May 2020
HAL is a multi-disciplinary open access
archive for the deposit and dissemination of
sci-entific research documents, whether they are
pub-lished or not. The documents may come from
teaching and research institutions in France or
abroad, or from public or private research centers.
L’archive ouverte pluridisciplinaire HAL, est
destinée au dépôt et à la diffusion de documents
scientifiques de niveau recherche, publiés ou non,
émanant des établissements d’enseignement et de
recherche français ou étrangers, des laboratoires
publics ou privés.
QTL region and comparative mapping of this region
among vertebrate genomes
Julie Demars, Juliette Riquet, Katia Feve, Mathieu Gautier, Mireille
Morisson, Olivier Demeure, Christine Renard, Patrick Chardon, Denis Milan
To cite this version:
Julie Demars, Juliette Riquet, Katia Feve, Mathieu Gautier, Mireille Morisson, et al.. High resolution
physical map of porcine chromosome 7 QTL region and comparative mapping of this region among
vertebrate genomes. BMC Genomics, BioMed Central, 2006, 7, pp.13. �10.1186/1471-2164-7-13�.
�hal-02661326�
Open Access
Research article
High resolution physical map of porcine chromosome 7 QTL region
and comparative mapping of this region among vertebrate
genomes
Julie Demars
1, Juliette Riquet
1, Katia Feve
1, Mathieu Gautier
2,
Mireille Morisson
1, Olivier Demeure
3, Christine Renard
4, Patrick Chardon
4and Denis Milan*
1Address: 1Laboratoire de Génétique Cellulaire, INRA, BP52627, 31326 Castanet-Tolosan, France, 2Laboratoire de Génétique Biochimique et de
Cytogénétique, INRA, 78352 Jouy en Josas, France, 3Laboratoire de Génétique animale, INRA, 35042 Rennes, France and 4Laboratoire de
Radiobiologie et d'Etude du Génome, INRA-CEA, 78352 Jouy en Josas, France
Email: Julie Demars - julie.demars@toulouse.inra.fr; Juliette Riquet - juliette.riquet@toulouse.inra.fr; Katia Feve - katia.feve@toulouse.inra.fr; Mathieu Gautier - mathieu.gautier@jouy.inra.fr; Mireille Morisson - mireille.morisson@toulouse.inra.fr;
Olivier Demeure - demeure@roazhon.inra.fr; Christine Renard - crenard@jouy.inra.fr; Patrick Chardon - Patrick.chardon@jouy.inra.fr; Denis Milan* - denis.milan@toulouse.inra.fr
* Corresponding author
Abstract
Background: On porcine chromosome 7, the region surrounding the Major Histocompatibility Complex
(MHC) contains several Quantitative Trait Loci (QTL) influencing many traits including growth, back fat thickness and carcass composition. Previous studies highlighted that a fragment of ~3.7 Mb is located within the Swine Leucocyte Antigen (SLA) complex. Internal rearrangements of this fragment were suggested, and partial contigs had been built, but further characterization of this region and identification of all human chromosomal fragments orthologous to this porcine fragment had to be carried out.
Results: A whole physical map of the region was constructed by integrating Radiation Hybrid (RH)
mapping, BAC fingerprinting data of the INRA BAC library and anchoring BAC end sequences on the human genome. 17 genes and 2 reference microsatellites were ordered on the high resolution IMNpRH212000rad Radiation Hybrid panel. A 1000:1 framework map covering 550 cR12000 was established and a complete contig of the region was developed. New micro rearrangements were highlighted between the porcine and human genomes. A bovine RH map was also developed in this region by mapping 16 genes. Comparison of the organization of this region in pig, cattle, human, mouse, dog and chicken genomes revealed that 1) the translocation of the fragment described previously is observed only on the bovine and porcine genomes and 2) the new internal micro rearrangements are specific of the porcine genome.
Conclusion: We estimate that the region contains several rearrangements and covers 5.2 Mb of the
porcine genome. The study of this complete BAC contig showed that human chromosomal fragments homologs of this heavily rearranged QTL region are all located in the region of HSA6 that surrounds the centromere. This work allows us to define a list of all candidate genes that could explain these QTL effects.
Published: 24 January 2006
BMC Genomics2006, 7:13 doi:10.1186/1471-2164-7-13
Received: 02 August 2005 Accepted: 24 January 2006 This article is available from: http://www.biomedcentral.com/1471-2164/7/13
© 2006Demars et al; licensee BioMed Central Ltd.
This is an Open Access article distributed under the terms of the Creative Commons Attribution License (http://creativecommons.org/licenses/by/2.0), which permits unrestricted use, distribution, and reproduction in any medium, provided the original work is properly cited.
Background
Chromosome 7 contains a region of the porcine genome in which the highest number of quantitative trait loci (QTL) have been mapped, affecting most notably growth, fat deposition and carcass composition [1-5]. Among all QTL detected on this chromosome, many have been mapped in an interval spanning the SLA complex in posi-tion 7p12-q12. Development of a high resoluposi-tion porcine gene map and comparison with the human map is a major step towards the identification of the genes respon-sible for QTL effects. The development of two radiation hybrid panels IMpRH and IMNpRH2 constructed after irradiation of porcine cells at 7.000 and 12.000 rads [6,7] provides tools of choice for such comparative mapping studies at 2 complementary resolutions : 1) one breakage could be observed on at least one hybrid of the panel for markers at an average distance of >50 and 20 Kb, 2) the order of a set of markers can be unambiguously deter-mined, provided that the distance between adjacent mark-ers range from 0.25 to 1.5 Mb on IMpRH panel and from 100 to 600 Kb on IMNpRH2 panel [8].
At first glance, the chromosomal region in which QTL have been mapped on SSC7 seemed identical to the p arm of HSA6 [9,10]. A more detailed study showed that a frag-ment of ~3.7 Mb found at a pericentromeric location on HSA6 is situated at 23 Mb from the expected location on the porcine genome, precisely in the region of interest [11,12]. This fragment was defined by three genes (FLJ10775, BMP5 and BAG2) located close to the centro-mere at 56 Mb on HSA6p12.1-6p11.2 and mapped on SSC7q11 close to RAB2L and DAXX genes localized at 33 Mb on HSA6p21.32. A preliminary physical map of this region was proposed by Barbosa [12], but 4 limited BAC contigs were built in this rearranged region. However, it failed to establish a complete comparative map of this region and to ensure that no additional fragments found elsewhere on the human genome are located in the por-cine QTL region.
We now report the building of a complete BAC map cov-ering the whole region. This was achieved by taking advantage of the fingerprinting of a 5.5× BAC library (Chardon et al, in preparation), undertaken to establish primary BAC contigs. We monitored the assembly of the complete contig by mapping genes and markers on the high resolution IMNpRH212000 panel, as previously done
in the Halothane region [8]. Sequence comparison of BAC ends from this contig with the human sequence allowed us to identify 4 BAC containing the four synteny breaking points detected in this region. A local bovine RH map was also established in this region to determine if the rear-rangements observed on the pig genome are specific of suines or if they occurred in an ancestral species. A multi-species comparison of this region was finally performed.
Results
Development of a preliminary porcine gene map
To study the complete rearrangements that occurred in this region of an estimated 3.7 Mb and containing the 3 genes LANO (previously called FLJ10775), BMP5 and BAG2 [11,12], it was necessary to: 1) define the chromo-somal blocks arranged differently between HSA6 pericen-tromeric region and SSC7; 2) determine if additional human fragments moved in this porcine region. In the first approach, we increased the density of genes mapped in this region of the IMNpRH212000 panel [7]. Using the ICCARE browser [13], we identified genes for which por-cine EST were available. We chose 5 genes located on HSA6p21.32 and 5 genes located on HSA6p12.1-6p11.2: COL11A2 (33.24 Mb), HSD17B8 (33.28 Mb), RING1 (33.29 Mb), VPS52 (33.33 Mb), RPS18 (33.35 Mb), GCLC (53.47 Mb), TINAG (54.28 Mb), HCRTR2 (55.15 Mb), COL21A1 (56.03 Mb) and DST (56.43 Mb). No gene was selected below PRIM2A since no porcine sequence was available for the few genes located in this region very close to the centromere of HSA6. When possible, primers were developed in the 3' UTR sequence of selected genes (Table 1). For GCLC only, we had to choose primers in two con-secutive exons framing an intron. Markers developed for these 10 genes, as well as markers previously developed [11,12] for RXRb (33.27 Mb), ELOVL5 (53.28 Mb) and PRIM2A (57.29 Mb), were analyzed on the 90 clones of IMNpRH212000 panel. In addition to markers produced in the frame of this project, we included in the analysis markers already mapped in this region on IMpRH and IMNpRH2 panels, in particular HKE4 (33.28 Mb), RAB2L (33.37 Mb), LANO (53.77 Mb) (called previously FLJ10775),BMP5 (55.73 Mb) and BAG2 (57.15 Mb) [11,12]. An average retention frequency of 40% was observed, ranging from 27% for PRIM2A to 55% for RAB2L and HKE4. A draft 1000:1 framework map was then built with Carthagene software [14], using a stepwise locus adding strategy (data not shown). The robustness of the map was tested by comparison of the likelihood of the reference map to the likelihood of maps derived from the reference map by all possible permutations in a window of 6 markers and by inversion of parts of the map using the simulated annealing algorithm. The 6 additional genes (COL11A2, RXRb, RING1, PRIM2A, COL21A1 and RPS18) were mapped at their most likely location rela-tively to markers of this preliminary framework map, con-sidering the distance between framework markers as fixed. To compare the order of genes between SSC7 and HSA6, we determined the location of these genes on the NCBI Build 35 assembly of the human genome available at UCSC [15]. We confirmed the insertion in pig of a large fragment between RING1 and VPS52 genes (fragments 1 and 2), which are only 40 Kb apart on the human genome (Figure 1A). The fragment found in pig between these two
genes is located on human genome close to the centro-mere on the HSA6p arm. The mapping of these genes on the porcine RH map allowed us to distinguish two main conserved fragments: one fragment containing BMP5 – HCTR2 – Sw2019 – TINAG – LANO – GCLC (fragment 4), and a second fragment containing DST, BAG2 and PRIM2A (fragment 5). The order of genes is conserved inside each fragment; however, the 2 blocks are oppositely oriented in the porcine and human genomes. A large dis-tance is observed between GCLC and BAG2, suggesting that another fragment is inserted between them, possibly a fragment called "6" in the human genome. This addi-tional porcine fragment is particularly interesting because it contains Sw1856, a marker mapped at the most likely
location of the QTL of interest. At that step, it was not pos-sible to determine whether the rearranged fragment includes a short fragment located on the q arm of HSA6. The first gene found on HSA6q arm also mapped on the porcine genome, being FLJ13159 located on SSC1 [11].
Bac contig construction
In order to confirm the rearrangements previously observed between HSA6 (6p21.32 and 6p12.1-11.2) and SSC7 (7q11), we built a complete BAC contig of this region. As in previous studies, an almost complete BAC contig of the SLA region has been developed [12], but a gap remained to be filled precisely in this region that was very different between the human and pig genomes. We screened by PCR the INRA BAC library [16] using primers defined for microsatellites Sw2019 and Sw1856, and for the 10 following genes RING1, HSD17B8, BMP5, HCRTR2, TINAG, LANO, GCLC, PRIM2A, BAG2 and DST. For each of these 10 genes or 2 markers (Sw2019 and Sw1856), we identified one positive BAC (Figure 2). To accelerate the establishment of a complete BAC contig, we took advantage of the availability of preliminary BAC con-tigs built after the fingerprinting of 72 190 BAC of the INRA library (Chardon et al, in preparation). It appeared that 8 of these 12 BAC were mapped in 8 different INRA contigs (contigs 5174, 1178, 5990, 3302, 2270, 137, 236 and 1421), containing from 3 to 21 BAC (Figure 2). In the frame of the INRA physical mapping project, 35 000 INRA BAC regularly dispersed on the INRA contigs had been selected. The sequence of their extremities were determined at CNS (Evry, France) and compared with the human sequence (Chardon et al, in preparation). Analysis of 108 porcine BES anchored on the human region between 33 and 34 Mb, or between 53 and 64 Mb, allowed us to identify 55 BAC located on the pig genome in the chosen region. Among these BAC, 39 belonged to one of the 8 INRA contigs already identified. 8 additional BAC allowed us to identify 3 others INRA contigs (contigs 5488, 6382 and 7444) located in this same region, and the last 8 clones correspond to BAC that had not been fin-gerprinted.
To fill several gaps, the INRA BAC library was screened with markers derived from BES, and 12 additional INRA BAC (bI0149A04, bI0474F10, bI0403D01, bI0842H05, bI0323A08, bI0159D05, bI0438F07, bI1044F02, bI0135F11, bI0311E12, bI0105B03 and bI0032D02) were recruited. For BAC of interest whose BES had not been sequenced by the CNS, we sequenced the extremities in order to get on with the construction of the contig; these sequences were submitted to EMBL Nucleotide Sequence Database (AM156864 to AM156903). To fill the remaining gaps, we selected 7 additional BAC (bE0164A10, RPCI44_0470A18, bE0047O02,
Gene based comparative map of SSC 7q1.2 and BTA 23q11 radiation hybrid maps and HSA 6p21.32/HSA 6p12.1-q112 physical map
Figure 1
Gene based comparative map of SSC 7q1.2 and BTA 23q11 radiation hybrid maps and HSA 6p21.32/HSA 6p12.1-q112 physical map. A- SSC 7q1.2 radiation hybrid
map was build using IMNpRH212000 developed by Yerle et al
[7]. B- BTA 23q11 radiation hybrid map was build using RH5000 panels developed by Williams et al [22]. The human physical map corresponds to NCBI build 35 produced by the International Human Genome Sequencing Consortium. Markers in bold on the RH map belong to the framework map, whereas markers in italic are mapped at their most likely location considering as fixed the distance between framework markers. The centromere is represented by a cir-cle. Arrows indicate blocks of gene whose order is con-served among the three species. Hatched box on the SSC7 RH map represents a fragment where no gene mapping infor-mation is available.
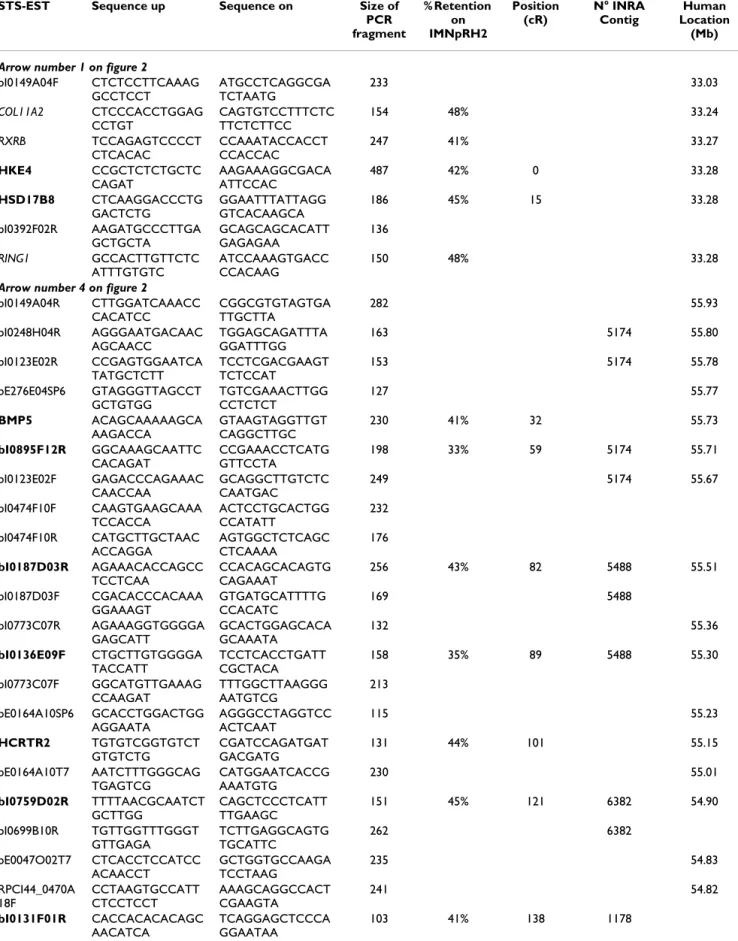
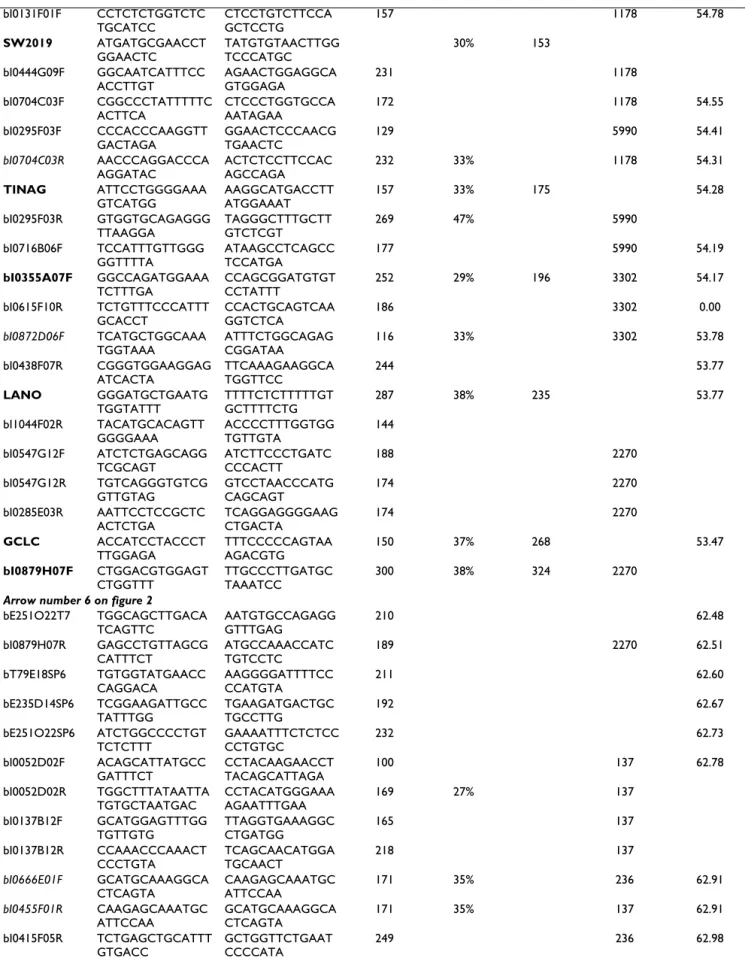
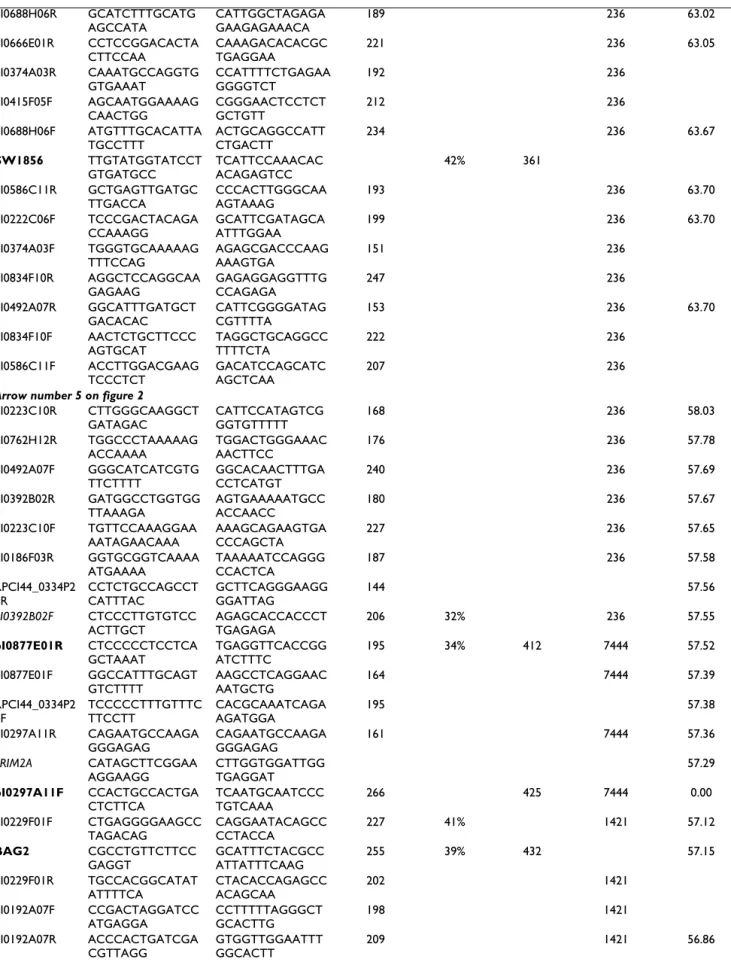
Table 1: Porcine markers developed for RH mapping and BAC contig construction
STS-EST Sequence up Sequence on Size of
PCR fragment % Retention on IMNpRH2 Position (cR) N° INRA Contig Human Location (Mb) Arrow number 1 on figure 2
bI0149A04F CTCTCCTTCAAAG GCCTCCT ATGCCTCAGGCGA TCTAATG 233 33.03 COL11A2 CTCCCACCTGGAG CCTGT CAGTGTCCTTTCTC TTCTCTTCC 154 48% 33.24 RXRB TCCAGAGTCCCCT CTCACAC CCAAATACCACCT CCACCAC 247 41% 33.27 HKE4 CCGCTCTCTGCTC CAGAT AAGAAAGGCGACA ATTCCAC 487 42% 0 33.28 HSD17B8 CTCAAGGACCCTG GACTCTG GGAATTTATTAGG GTCACAAGCA 186 45% 15 33.28 bI0392F02R AAGATGCCCTTGA GCTGCTA GCAGCAGCACATT GAGAGAA 136 RING1 GCCACTTGTTCTC ATTTGTGTC ATCCAAAGTGACC CCACAAG 150 48% 33.28
Arrow number 4 on figure 2
bI0149A04R CTTGGATCAAACC CACATCC CGGCGTGTAGTGA TTGCTTA 282 55.93 bI0248H04R AGGGAATGACAAC AGCAACC TGGAGCAGATTTA GGATTTGG 163 5174 55.80 bI0123E02R CCGAGTGGAATCA TATGCTCTT TCCTCGACGAAGT TCTCCAT 153 5174 55.78 bE276E04SP6 GTAGGGTTAGCCT GCTGTGG TGTCGAAACTTGG CCTCTCT 127 55.77 BMP5 ACAGCAAAAAGCA AAGACCA GTAAGTAGGTTGT CAGGCTTGC 230 41% 32 55.73 bI0895F12R GGCAAAGCAATTC CACAGAT CCGAAACCTCATG GTTCCTA 198 33% 59 5174 55.71 bI0123E02F GAGACCCAGAAAC CAACCAA GCAGGCTTGTCTC CAATGAC 249 5174 55.67 bI0474F10F CAAGTGAAGCAAA TCCACCA ACTCCTGCACTGG CCATATT 232 bI0474F10R CATGCTTGCTAAC ACCAGGA AGTGGCTCTCAGC CTCAAAA 176 bI0187D03R AGAAACACCAGCC TCCTCAA CCACAGCACAGTG CAGAAAT 256 43% 82 5488 55.51 bI0187D03F CGACACCCACAAA GGAAAGT GTGATGCATTTTG CCACATC 169 5488 bI0773C07R AGAAAGGTGGGGA GAGCATT GCACTGGAGCACA GCAAATA 132 55.36 bI0136E09F CTGCTTGTGGGGA TACCATT TCCTCACCTGATT CGCTACA 158 35% 89 5488 55.30 bI0773C07F GGCATGTTGAAAG CCAAGAT TTTGGCTTAAGGG AATGTCG 213 bE0164A10SP6 GCACCTGGACTGG AGGAATA AGGGCCTAGGTCC ACTCAAT 115 55.23 HCRTR2 TGTGTCGGTGTCT GTGTCTG CGATCCAGATGAT GACGATG 131 44% 101 55.15 bE0164A10T7 AATCTTTGGGCAG TGAGTCG CATGGAATCACCG AAATGTG 230 55.01 bI0759D02R TTTTAACGCAATCT GCTTGG CAGCTCCCTCATT TTGAAGC 151 45% 121 6382 54.90 bI0699B10R TGTTGGTTTGGGT GTTGAGA TCTTGAGGCAGTG TGCATTC 262 6382 bE0047O02T7 CTCACCTCCATCC ACAACCT GCTGGTGCCAAGA TCCTAAG 235 54.83 RPCI44_0470A 18F CCTAAGTGCCATT CTCCTCCT AAAGCAGGCCACT CGAAGTA 241 54.82 bI0131F01R CACCACACACAGC AACATCA TCAGGAGCTCCCA GGAATAA 103 41% 138 1178
bI0131F01F CCTCTCTGGTCTC TGCATCC CTCCTGTCTTCCA GCTCCTG 157 1178 54.78 SW2019 ATGATGCGAACCT GGAACTC TATGTGTAACTTGG TCCCATGC 30% 153 bI0444G09F GGCAATCATTTCC ACCTTGT AGAACTGGAGGCA GTGGAGA 231 1178 bI0704C03F CGGCCCTATTTTTC ACTTCA CTCCCTGGTGCCA AATAGAA 172 1178 54.55 bI0295F03F CCCACCCAAGGTT GACTAGA GGAACTCCCAACG TGAACTC 129 5990 54.41 bI0704C03R AACCCAGGACCCA AGGATAC ACTCTCCTTCCAC AGCCAGA 232 33% 1178 54.31 TINAG ATTCCTGGGGAAA GTCATGG AAGGCATGACCTT ATGGAAAT 157 33% 175 54.28 bI0295F03R GTGGTGCAGAGGG TTAAGGA TAGGGCTTTGCTT GTCTCGT 269 47% 5990 bI0716B06F TCCATTTGTTGGG GGTTTTA ATAAGCCTCAGCC TCCATGA 177 5990 54.19 bI0355A07F GGCCAGATGGAAA TCTTTGA CCAGCGGATGTGT CCTATTT 252 29% 196 3302 54.17 bI0615F10R TCTGTTTCCCATTT GCACCT CCACTGCAGTCAA GGTCTCA 186 3302 0.00 bI0872D06F TCATGCTGGCAAA TGGTAAA ATTTCTGGCAGAG CGGATAA 116 33% 3302 53.78 bI0438F07R CGGGTGGAAGGAG ATCACTA TTCAAAGAAGGCA TGGTTCC 244 53.77 LANO GGGATGCTGAATG TGGTATTT TTTTCTCTTTTTGT GCTTTTCTG 287 38% 235 53.77 bI1044F02R TACATGCACAGTT GGGGAAA ACCCCTTTGGTGG TGTTGTA 144 bI0547G12F ATCTCTGAGCAGG TCGCAGT ATCTTCCCTGATC CCCACTT 188 2270 bI0547G12R TGTCAGGGTGTCG GTTGTAG GTCCTAACCCATG CAGCAGT 174 2270 bI0285E03R AATTCCTCCGCTC ACTCTGA TCAGGAGGGGAAG CTGACTA 174 2270 GCLC ACCATCCTACCCT TTGGAGA TTTCCCCCAGTAA AGACGTG 150 37% 268 53.47 bI0879H07F CTGGACGTGGAGT CTGGTTT TTGCCCTTGATGC TAAATCC 300 38% 324 2270
Arrow number 6 on figure 2
bE251O22T7 TGGCAGCTTGACA TCAGTTC AATGTGCCAGAGG GTTTGAG 210 62.48 bI0879H07R GAGCCTGTTAGCG CATTTCT ATGCCAAACCATC TGTCCTC 189 2270 62.51 bT79E18SP6 TGTGGTATGAACC CAGGACA AAGGGGATTTTCC CCATGTA 211 62.60 bE235D14SP6 TCGGAAGATTGCC TATTTGG TGAAGATGACTGC TGCCTTG 192 62.67 bE251O22SP6 ATCTGGCCCCTGT TCTCTTT GAAAATTTCTCTCC CCTGTGC 232 62.73 bI0052D02F ACAGCATTATGCC GATTTCT CCTACAAGAACCT TACAGCATTAGA 100 137 62.78 bI0052D02R TGGCTTTATAATTA TGTGCTAATGAC CCTACATGGGAAA AGAATTTGAA 169 27% 137 bI0137B12F GCATGGAGTTTGG TGTTGTG TTAGGTGAAAGGC CTGATGG 165 137 bI0137B12R CCAAACCCAAACT CCCTGTA TCAGCAACATGGA TGCAACT 218 137 bI0666E01F GCATGCAAAGGCA CTCAGTA CAAGAGCAAATGC ATTCCAA 171 35% 236 62.91 bI0455F01R CAAGAGCAAATGC ATTCCAA GCATGCAAAGGCA CTCAGTA 171 35% 137 62.91 bI0415F05R TCTGAGCTGCATTT GTGACC GCTGGTTCTGAAT CCCCATA 249 236 62.98
bI0688H06R GCATCTTTGCATG AGCCATA CATTGGCTAGAGA GAAGAGAAACA 189 236 63.02 bI0666E01R CCTCCGGACACTA CTTCCAA CAAAGACACACGC TGAGGAA 221 236 63.05 bI0374A03R CAAATGCCAGGTG GTGAAAT CCATTTTCTGAGAA GGGGTCT 192 236 bI0415F05F AGCAATGGAAAAG CAACTGG CGGGAACTCCTCT GCTGTT 212 236 bI0688H06F ATGTTTGCACATTA TGCCTTT ACTGCAGGCCATT CTGACTT 234 236 63.67 SW1856 TTGTATGGTATCCT GTGATGCC TCATTCCAAACAC ACAGAGTCC 42% 361 bI0586C11R GCTGAGTTGATGC TTGACCA CCCACTTGGGCAA AGTAAAG 193 236 63.70 bI0222C06F TCCCGACTACAGA CCAAAGG GCATTCGATAGCA ATTTGGAA 199 236 63.70 bI0374A03F TGGGTGCAAAAAG TTTCCAG AGAGCGACCCAAG AAAGTGA 151 236 bI0834F10R AGGCTCCAGGCAA GAGAAG GAGAGGAGGTTTG CCAGAGA 247 236 bI0492A07R GGCATTTGATGCT GACACAC CATTCGGGGATAG CGTTTTA 153 236 63.70 bI0834F10F AACTCTGCTTCCC AGTGCAT TAGGCTGCAGGCC TTTTCTA 222 236 bI0586C11F ACCTTGGACGAAG TCCCTCT GACATCCAGCATC AGCTCAA 207 236
Arrow number 5 on figure 2
bI0223C10R CTTGGGCAAGGCT GATAGAC CATTCCATAGTCG GGTGTTTTT 168 236 58.03 bI0762H12R TGGCCCTAAAAAG ACCAAAA TGGACTGGGAAAC AACTTCC 176 236 57.78 bI0492A07F GGGCATCATCGTG TTCTTTT GGCACAACTTTGA CCTCATGT 240 236 57.69 bI0392B02R GATGGCCTGGTGG TTAAAGA AGTGAAAAATGCC ACCAACC 180 236 57.67 bI0223C10F TGTTCCAAAGGAA AATAGAACAAA AAAGCAGAAGTGA CCCAGCTA 227 236 57.65 bI0186F03R GGTGCGGTCAAAA ATGAAAA TAAAAATCCAGGG CCACTCA 187 236 57.58 RPCI44_0334P2 0R CCTCTGCCAGCCT CATTTAC GCTTCAGGGAAGG GGATTAG 144 57.56 bI0392B02F CTCCCTTGTGTCC ACTTGCT AGAGCACCACCCT TGAGAGA 206 32% 236 57.55 bI0877E01R CTCCCCCTCCTCA GCTAAAT TGAGGTTCACCGG ATCTTTC 195 34% 412 7444 57.52 bI0877E01F GGCCATTTGCAGT GTCTTTT AAGCCTCAGGAAC AATGCTG 164 7444 57.39 RPCI44_0334P2 0F TCCCCCTTTGTTTC TTCCTT CACGCAAATCAGA AGATGGA 195 57.38 bI0297A11R CAGAATGCCAAGA GGGAGAG CAGAATGCCAAGA GGGAGAG 161 7444 57.36 PRIM2A CATAGCTTCGGAA AGGAAGG CTTGGTGGATTGG TGAGGAT 57.29 bI0297A11F CCACTGCCACTGA CTCTTCA TCAATGCAATCCC TGTCAAA 266 425 7444 0.00 bI0229F01F CTGAGGGGAAGCC TAGACAG CAGGAATACAGCC CCTACCA 227 41% 1421 57.12 BAG2 CGCCTGTTCTTCC GAGGT GCATTTCTACGCC ATTATTTCAAG 255 39% 432 57.15 bI0229F01R TGCCACGGCATAT ATTTTCA CTACACCAGAGCC ACAGCAA 202 1421 bI0192A07F CCGACTAGGATCC ATGAGGA CCTTTTTAGGGCT GCACTTG 198 1421 bI0192A07R ACCCACTGATCGA CGTTAGG GTGGTTGGAATTT GGCACTT 209 1421 56.86
bI0783E01R GAGGGCCTCTTAG ATGCTGA CACCCATAAGGCT TCCTCTG 260 38% 458 1421 bI0697C09R TTATCACTGCTGTG GCTTGG TCCCTCCCTATTG CTTCCTT 213 35% 479 bI0697C09F ATGAGGCGAAACG AAATGAC CAATGACTCGTGC TGGTTTG 191 25% 507 1421 56.67 bI0135F11R CCCTCTGACAACC ACCAGTT GCAACATGGAGGG ACCTAGA 163 56.68 bI0135F11F TTGACCCTGTCGA CTGCTTT CAACACAGTGGTT GAACGTTTT 185 bT220O06SP6 TGAGAGGCCTCGT GGATTAC TTGGAGGTGGCTC AGAACTT 155 56.58 DST TGTCAGGTTTTCTT TTGCTTGA GGGACACGTTTTA TTTCATAGCTT 106 32% 538 56.58 bI0105B03F TCAGGGCACTTTC TGCTGTA GCTGGGAGTTTGG GGTTAGT 183 bI0105B03R TCAGTTGGAGCTG AAAAACTCA AAACCACAAAAGC CAAACCA 226 56.47 bT220O06T7 GAATGGGAGGAGG AAGTGGT CAGCTAAAGGACG GACGAAC 228 56.44 bI0032D02F TCTGTGTACCACC CCACTCA CCATGGCTGGTAT TTGAACC 257 56.15 bI0032D02R AGGGGCCTGTTTA CGTCTTT CACCTTGACGTCT CATCAGC 120 COL21A1 TGCATGCTTTCATT TTCCAT TGTTCCTTAACAAC GAAGCATT 204 37% 56.03
Arrow number 2 on figure 2
VPS52 CAAGAAGCACAAG CCCAACT GGGACCCAGCTTA TCCTGA 190 39% 557 33.33 RPS18 CTGCAGCCATGGT AAGAGTT GTCTTCACGACAC AACACGA 350 38% 33.35 RAB2L AAGTGTCATCANG TCGTGTCC GCCCAGCGTAGCA GTAGAG 314 54% 578 33.37
Markers in bold belong to the framework RH map, whereas markers in italic are positioned at the most likely location. Other markers have been developed in the frame of the contig building. The arrows on the side represent the fragments conserved between the pig and human genomes. Primer sequences, retention fraction, RH map location on porcine map and human location are indicated.
Table 1: Porcine markers developed for RH mapping and BAC contig construction (Continued)
bT0079E18, bE0251O22, RPCI_440334P20 and bT220O06) on the international BAC map (Humphrey et al, in preparation, and [17] that were overlapping with BAC already selected. To check for the accuracy of the glo-bal contig, new markers were developed using BES. The overlapping of BAC derived from the different INRA con-tigs was tested by PCR on BAC clones (Table 1 and Figure 2).
The building of the complete BAC contig was also moni-tored regularly by the mapping of BAC end- markers on the IMNpRH2 RH panel, verifying that the order of the markers and the distances between them were consistent with the BAC contig results. In particular, markers found at the extremities of the 11 INRA contigs were mapped on the RH panel. For these 19 markers, an average retention frequency of 35% was observed. A 1000:1 framework map was then established, including previously mapped genes and 11 markers derived from BES. The 8 others BAC ends were mapped at their most likely location relatively to markers of the framework. This RH map covering 550 cR
is in total agreement with the BAC contig covering the whole region (Figure 2).
Analysis of BAC contig
The availability of BES from BAC located between PRIM2A (fragment 5) and GCLC (fragment 4) permitted characterization of the intermediate fragment in which no genes were mapped (Figure 2). All the significant homol-ogies detected with these BES show that this fragment cor-responds to fragment 6 located on HSA6 in the interval 57.50 – 63.5 Mb framing the centromere. Among BES anchored at this human region, bI0666E01F is highly homologous to an intron of KHDRBS2, demonstrating the presence of the gene in this porcine region. In addi-tion, the comparison of porcine BES produced from BAC bI0222C06, bI0223C10 and bI0819C05 revealed that these sequences share significant homology with 2 human fragments at a distance of 600 Kb, suggesting the presence of duplication in the human genome. A dot-plot of the human region 57.73 Mb-58.9 Mb on itself was per-formed with Dotter, using its default settings [18]. The dot-plot showed that this region contains many large
repeated sequences. A fragment of 290 Kb located at 57.74 Mb-58.03 Mb is duplicated in position 58.34 Mb-58.63 Mb, and a 50 Kb fragment from 58.07 Mb to 58.12 Mb is duplicated and turned over in position 58.73 Mb-58.77 Mb on HSA6 (results not shown). In the pig, this fragment covers ~40 cR, which corresponds to ~380 Kb suggesting that a single copy is present in the pig genome.
Finally, for BAC bI0688H06 and bI0046E05 mapped in the same region, hits obtained for the two BES of both clones were 650 Kb apart, which is not compatible with the size of a BAC. Analysis of this human region on ENSEMBL database [19] indicates that no porcine BES matches the human genome between 63.05 and 63.55 Mb, whereas BES were anchored in the surrounding region on average each 20 Kb. Altogether these results
sug-Porcine BAC contig with anchoring on porcine RH map and on human sequence after BAC end sequence analysis
Figure 2
Porcine BAC contig with anchoring on porcine RH map and on human sequence after BAC end sequence ysis. The full contig is presented including mainly INRA BAC. Some additional BAC where recruited on the international
anal-ysis available at http://www.sanger.ac.uk/cgi-bin/Projects/S_scrofa. The black circles represent sequenced BAC ends (BES) used for screening INRA BAC library. The white circles are BES for which a marker has been developed for a quality control of the contig by PCR on overlapping BAC (positive results are indicated with gray circles). The black boxes represent genes and mic-rosatellites used for screening INRA BAC library, the white boxes indicate additional BAC on which a positive result has been obtained by PCR with these markers. Markers in bold on the RH map belong to the framework map, whereas markers in italic are additional markers mapped at the most likely location (when two locations are as likely, the marker is indicated on the left side of the map and its possible locations are indicated with a line). The BES for which a significant homology has been identi-fied with sequence of HSA6 are illustrated by dotted lines. The large arrows represent the extent and the orientation of the different fragment conserved between pig and human genomes. The small arrows in fragment 5 represent the duplication iden-tified on the human. Finally, the white box in fragment 6 is the fragment absent on the pig genome.
SSC7 Human Seq u ence location (Mb) Porci ne RH ma p (cR) Porcine BA C con tig bI0392F02 33. 03 33. 28 33. 28 55. 93 55. 78 55. 72 55. 70 55. 67 55. 51 55. 36 55. 30 55. 30 55. 00 54. 90 54. 83 54. 82 54. 78 54. 55 54. 41 54. 31 54. 19 54. 17 53. 78 53. 77 62. 48 62. 50 62. 60 62. 73 62. 78 62. 90 62. 98 63. 02 63. 05 63. 66 63. 69 63. 69 58. 03 57. 78 57. 67 57. 65 57. 58 57. 56 57. 55 57. 52 57. 39 57. 38 57. 12 56. 86 56. 67 56. 68 56. 58 56. 43 56. 47 56. 15 33. 39 33. 78 33. 66 33. 51 bI0675A05 bI0842H05 bI0355A07 bI0797E02bI0615F10 bI0192E10bI0052B08 bI0884A08bI0872D06 bI0323A08 bI0159D05bI0438F07 bI1044F02 bI0547G12bI0285E03 bI1040H11 22 70 22 70 bI0444G04 bI0497A11bI0575E04 bI0072D11bI0243E12 bI0211F09bI0275B11 bI0879H07 bE251O22.p1 bT79e18.p1 bI0052D02 bI0748H09 bI0034C10 bI0407H07 bI0416C11 bI0625E07 bI0455F01 bI0624C02 13 7 13 7 bI0137B12 bI0586C11 bI1117A12 bI0913C02 bI0825B06 bI0481B05 bI0666E01 bI0415F05 bI0688H06 bI0843E04 bI0374A03 bI0046E05 bI0324D07 bI0222C06 bI0492A07 bI0223C10 bI0834F10 bI0819C05 bI0186F03 bI0893B11 bI0762H12 bI0392B02 23 6 23 6 bI0716B06 bI0717D05 bI0251G07 bI0123E02 bI0248H04 bI0895F12 bI0474F10 bI0187D03 bI0136E09 bI0069G09 bI0773C07 bI0759D02 bI0699B10 51 74 51 74 54 88 54 88 63 82 63 82 bE164a10.q1 RPCI44_470A18 bI0403D01 bE47o02.q1 bI0131F01 bI0894D06 bI0149F12 bI0444G09 bI0804F08 bI0590H01 bI0422E11 bI0704C03 bI0295F03 bI0639D09 11 78 11 78 59 90 59 90 33 02 33 02 bI0149A04 RPCI44_334P20bI0877E01 74 44 74 44 bI0421D09bI0297A11 bI0229F01bI0786H06 bI0192A07bI0219A05 bI0447E01bI0288A04 bI0783E01bI0870D07 bI0215H06bI0848G07 bI0162D01 bI0697C09 bI0135F11bI0311E12 bT220O06bI0105B03 bI0954H04 bI0466C09bI0434C02 bI0321A06 bI1013B06bI0565D04 bI1111D02bI1024C03 bI0237F09bI0554H12 bI0198B05bI0583C11 14 21 14 21 bI0032D02 bI0759A11bI0958B06 bI0156A05 94 46 94 46 33. 37 33. 35 HKE4 COL11A 2 HS D17B8 RING1 RXRB BMP5 895F12R 187D3R 136E9F HCRTR2 131F1R SW 2019 TINAG 704C3R 355A7F 872D6 F LAN O GCLC 285E 3R 879H7F 455F 1R 666E 1F S W 1856 PRIM2A 877E1R 229F 01R 297A11F BAG2 783H01R 697C09R 697C9F DS T COL21A 1 VPS52 899F 11R RPS18 209B5 F RAB2L DAXX 0 100 200 300 400 500 600 759D2R 392B2 F 1 1 44 66 55 22 57. 86
gest that a 500 Kb region (in which no genes have already been identified on the human genome) is missing in the pig genome.
From this analysis, an estimate can be made of the size of the rearranged region on the pig genome – considering that the size of this region on the porcine genome is sim-ilar to the size of human region also found on the porcine genome. The sizes of the three rearranged fragments are: ~2.5 Mb for fragment 4, 1.8 Mb for fragment 5 and 0.9 Mb for fragment 6. The whole rearranged fragment covers thus ~5.2 Mb of the porcine genome.
To confirm the reality of the rearrangements identified during the building of the BAC contig, we tried to identify a porcine BAC spanning each of the 4 breakpoints, with BES anchored on the 2 expected locations on human
genome (Figure 3). In order to increase the probability of identifying these BAC, we also selected from the interna-tional map [17] BAC overlapping INRA BAC close to syn-teny breaking points. For BAC with no significant homology, we used FASTA to detect any potential homol-ogy, using less stringent parameters. In pig, one BAC anchored on the 2 expected human locations was identi-fied, for the 4 breaking points A-B, C-D, E-F and G-H (bI0149A04 (33.03 Mb – 55.93 Mb), bT0141E11 (53.48 Mb-62.48 Mb), bI0222C06 (63.7 Mb – 57.85 Mb) and RPCI44_0428O15 (56.20 Mb – 33.35 Mb)) (Figure 3). Analysis of the anchorage on the human map of all BES available in these regions, allowed us to estimate more precisely the location of the 4 breakpoints on the human genome (Figure 3): A/H breakpoint is located at 33.26 – 33.35 Mb, I/C at 53.24 – 53.48 Mb, B/G at 55.93 – 56.01,
Description of the synteny breakpoints between SSC7 and HSA6
Figure 3
Description of the synteny breakpoints between SSC7 and HSA6. The arrows represent the various fragments of
conserved synteny. The small green arrows symbolize a human duplication of a fragment of 290 Kb. The white box represents a fragment of 500 Kb absent in the pig. Porcine BAC spanning each breakpoint are represented with anchoring of their ends on the human genome. Porcine BAC defining at best the localization of each breakpoint are shown with anchoring of their ends on the human genome.
F/D after 58.03 Mb and before 62.46 Mb (with human centromere located in this interval), E point after 63.78 Mb.
Multispecies comparison of the organization of the studied region
To compare the order of genes in this region between var-ious species, we identified the location on the genome of sequenced species of several genes representing each chro-mosomal fragment described previously: fragment 1 (RXRb, RING1), fragment 2 (VPS52, RPS18 and RAB2L), fragment 3 (ELOVL5), fragment 4 (GCLC, LANO, TINAG and BMP5), fragment 5 (COL21A1, DST and PRIM2A),
fragment 6 (KHDRBS2) and fragment 7 (GLULD1). Their locations were determined by blasting the porcine sequences against current genome assemblies: mouse sequence Build 33 assembly from NCBI, dog whole genome shotgun (WGS) assembly v1.0 (July 2004), and chicken galGal2 assembly. To enrich the set of data avail-able for the chicken genome, we developed markers for VPS52 and RAB2L which were not identified on the sequence of chicken genome with the ESTs available for these genes. We mapped these 2 markers on chickRH panel [20] and analyzed the results on ChickRH server [21].
Multi-species (Gallus gallus, Sus scrofa, Bos taurus, Canis familiaris, Mus musculus and Homo sapiens) comparative map
Figure 4
Multi-species (Gallus gallus, Sus scrofa, Bos taurus, Canis familiaris, Mus musculus and Homo sapiens) comparative map. Data concerning Canis familiaris, Gallus Gallus, Mus musculus, and Homo sapiens result respectively from Dog Jul. 2004
(canFam1) assembly, Chicken Feb. 2004 (galGal2) assembly, mouse Build 33 assembly by NCBI and human NCBI build 35. Data on chicken GGA 16 were not available on genome assembly, and were produced on ChickRH panel [20]. Maps concerning Sus scrofa and Bos taurus, are 1000:1 framework maps produced on RH panel (see Figure 2). Markers written in bold belong to the framework map and markers in italic are mapped at their most likely location. The different arrows represent conserved syn-teny group. White boxes framed in black represent fragments conserved between Gallus gallus, Canis familiaris, Mus musculus and Homo sapiens. Boxes framed in pink represent fragments conserved between Gallus gallus, Canis familiaris, Mus musculus, Homo sapiens and Bos taurus. Grey boxes represent fragments conserved between Canis familiaris, Mus musculus and Homo sapi-ens. Gallus gallus Mus musculus Canis familiaris Homo sapiens 1 1 1 1 1 GGA3 GGA16 RAB2L VPS52 83,5 84,5 85,5 86,5 Mb ELOVL5 GLULD1 KHDRBS2 PRIM2A DST COL21A1 BMP5 GCLC TINAG PTP4A1 MMU1 31 32 33 34 GLULD1 KHDRBS2 PRIM2A DST PTP4A1 76 77 78 BMP5 GCLC ELOVL5 MMU9 TINAG LANO 31 32 RAB2L VPS52 RING1 RXRB MMU17 31,50 Mb Sus scrofa 3 Bos taurus 2 0 CFA12 GCLC BMP5 COL21A1 DST PRIM2A KHDRBS2 GLULD1 23 25 27 29 RING1 VPS52 RAB2L RXRB 55 57 Mb ELOVL5 TINAG PTP4A1 HSA6 BMP5 COL21A1 DST PRIM2A 53,5 54,5 55,5 56,5 57,5 GCLC 62,5 63,5 58,5 KHDRBS2 GLULD1 ELOVL5 RXRB RING1 VPS52 RAB2L 33 TINAGLANO PTP4A1 Mb 33,5 52,5 PHF3 DMA LMP7 KHDRBS2 PRIM2A COL21A1 TINAG LANO RAB2L VPS52 0 50 100 150 200 250 ELOVL5 BTA23 BTA9 PHF3 PTP4A1 cR DMA LMP7 SSC7 1000 COL21A1 KHDRBS2 ELOVL5 GLULD1 PTP4A1 SSC1 cR RING1 RAB2L VPS52 PRIM2A GCLC BMP5 RXRB TINAG LANO 0 100 200 300 400 500 600 5 5 4 4 2 2 3 3 1 1 5 5 4 4 2 2 3 3 1 1 55 4 4 2 2 3 3 1 1 5 5 4 4 2 2 3 3 1 1 5 5 4 4 1 1 3 3 2 2 5 5 4 4 2 2 3 3 6 6 7 7 77 77 7 7 7 7 7 7 6 6 6 6 6 6 6 6 6 6
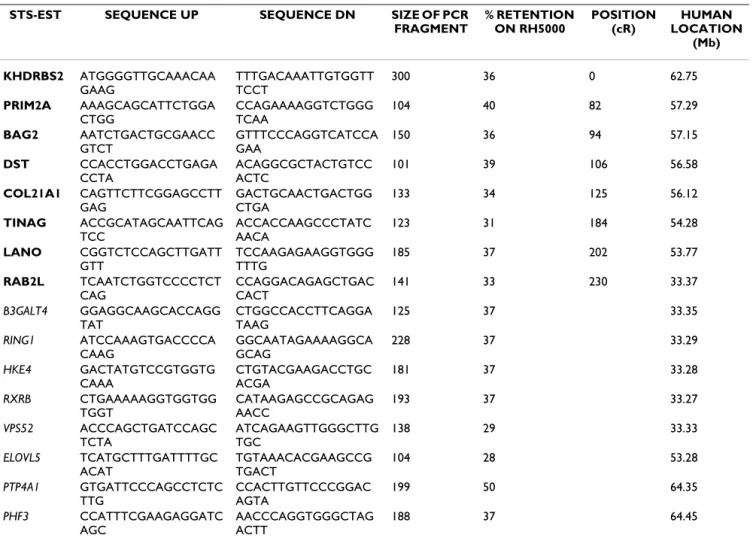
It was also important to include a species phylogenetically close to the pig in the comparison. We selected cattle, a species for which both detailed comparative mapping studies have been performed [22,23] and a partial genomic sequence is available. However, in the region of interest, the assembly of the bovine genome is by no means complete (each gene is found in a different scaffold after blasting the sequence of genes mapped in pig against the bovine genome) and available RH maps are insuffi-ciently detailed. This led us to develop a bovine RH map in this region. We used the ICCARE browser [13], to select bovine EST available for 16 genes of this region: RXRb, RING1, HKE4, HSD17B8, VPS52, RAB2L, ELOVL5, TINAG, LANO, COL21A1, DST, BAG2, PRIM2A, KHDRBS2, PHF3 and PTP4A1 (Table 2). We developed pairs of primers for each gene and we mapped them on the RH5000 bovine panel [22]. An average retention fre-quency of 36% was observed, ranging from 26% for GLO1 to 50% for PTP4A1. Vectors obtained for the 16 new genes were analyzed together with 31 markers
previ-ously available for BTA23 [22]. A 1000:1 framework map including 10 genes, was built with Carthagene software [14] in the region from PRIM2A to VPS52 (Figure 1B). In addition gene KHDRBS2 is linked with a LOD score 3.5 at the top of this map. Four additional genes HSD17B8, RXRb, RING1, and HKE4 were found totally linked and mapped at their most likely location relatively to markers of the framework (Figure 1B). ELOVL5 was found linked to markers previously mapped in a distal position. PHF3 and PTP4A1 were found significantly linked together (LOD = 13.2), but totally unlinked to other genes. In the dog genome, all the selected genes are grouped into two large fragments (fragments 3, 4, 5, 6 and 7 and frag-ments 1 and 2) located on chromosome 12 (Figure 4). In the mouse genome, the same region is similarly split into 3 conserved fragments (Figure 4): fragments 5, 6 and 7 are located on MMU1; fragments 3 and 4 on MMU9; and ments 1 and 2 on MMU17. In chicken, a conserved frag-ment containing fragfrag-ments 3, 4, 5, 6 and 7 is located on Table 2: Bovine markers developed for RH mapping
STS-EST SEQUENCE UP SEQUENCE DN SIZE OF PCR
FRAGMENT % RETENTION ON RH5000 POSITION (cR) HUMAN LOCATION (Mb) KHDRBS2 ATGGGGTTGCAAACAA GAAG TTTGACAAATTGTGGTT TCCT 300 36 0 62.75 PRIM2A AAAGCAGCATTCTGGA CTGG CCAGAAAAGGTCTGGG TCAA 104 40 82 57.29 BAG2 AATCTGACTGCGAACC GTCT GTTTCCCAGGTCATCCA GAA 150 36 94 57.15 DST CCACCTGGACCTGAGA CCTA ACAGGCGCTACTGTCC ACTC 101 39 106 56.58 COL21A1 CAGTTCTTCGGAGCCTT GAG GACTGCAACTGACTGG CTGA 133 34 125 56.12 TINAG ACCGCATAGCAATTCAG TCC ACCACCAAGCCCTATC AACA 123 31 184 54.28 LANO CGGTCTCCAGCTTGATT GTT TCCAAGAGAAGGTGGG TTTG 185 37 202 53.77 RAB2L TCAATCTGGTCCCCTCT CAG CCAGGACAGAGCTGAC CACT 141 33 230 33.37 B3GALT4 GGAGGCAAGCACCAGG TAT CTGGCCACCTTCAGGA TAAG 125 37 33.35 RING1 ATCCAAAGTGACCCCA CAAG GGCAATAGAAAAGGCA GCAG 228 37 33.29 HKE4 GACTATGTCCGTGGTG CAAA CTGTACGAAGACCTGC ACGA 181 37 33.28 RXRB CTGAAAAAGGTGGTGG TGGT CATAAGAGCCGCAGAG AACC 193 37 33.27 VPS52 ACCCAGCTGATCCAGC TCTA ATCAGAAGTTGGGCTTG TGC 138 29 33.33 ELOVL5 TCATGCTTTGATTTTGC ACAT TGTAAACACGAAGCCG TGACT 104 28 53.28 PTP4A1 GTGATTCCCAGCCTCTC TTG CCACTTGTTCCCGGAC AGTA 199 50 64.35 PHF3 CCATTTCGAAGAGGATC AGC AACCCAGGTGGGCTAG ACTT 188 37 64.45
Markers in bold belong to the framework RH map whereas markers in italic are positionned with the best likelihood. Primer sequences, retention fraction, RH map location on bovine map and human location are indicated.
GGA3. Two other genes, VPS52 and RAB2L (fragment 2), are mapped in a linkage group that also contains markers derived from chicken MHC region located on GGA16 (Figure 4). No information is available for RXRB and RING1 (fragment 1). If the order of genes is thus globally conserved in these species, a very different situation is observed on the bovine genome (Figure 4): 14 of the 16 selected genes are localized on BTA23, but in an order very different from the generally conserved order, and 2 others genes (PHF3 and PTP4A1 representing fragment 7) are located on chromosome 9.
The analysis of these results shows that the whole frag-ment (comprising fragfrag-ments 4, 5 and 6) inserted on the pig genome between fragments 1 and 2 (RING1 and VPS52) seems very well conserved in chicken, dog, mouse and human. In cattle and pig, belonging both to the clade of Cetartiodactyles, fragments 4, 5 and 6 are found at a dif-ferent location. However, in this 5.2 Mb large fragment, a total conservation of gene order was observed between human and cattle genomes. A global analysis of the chro-mosomal rearrangements that occurred during evolution was carried out using GRIMM. [24]. The results obtained are summarized on Figure 4.
Discussion
The study of porcine chromosome 7 is of particular inter-est due to the presence of many QTL affecting traits of eco-nomic importance and of MHC [1,2]. One approach to study this chromosome is to identify all the genes located on this chromosome and to compare their order relatively to that in the human genome. Previously, a strong conser-vation of gene order was found between a large fragment of porcine SSC7 and human HSA6 p arm [9,10]. We had highlighted the existence of a fragment estimated to be less than 4 Mb rearranged between SSC7 and HSA6 [11]. This fragment defined by 3 genes (LANO previously named FLJ10775, BMP5 and BAG2) located on HSA6p12.1-6p11.2 is found in the pig genome between genes located on HSA6p21.32 [11]. The building of a BAC contig in the chromosomal region surrounding SLA com-plex provided additional information, even if the contig remained incomplete [12]. This study describes a situa-tion that is even more complex, suggesting the presence of VPS52 (previously named SACM2L) within the rear-ranged region. In the pig genome, this rearrear-ranged chro-mosomal region is included in the region where the QTL of interest is mapped, between markers Sw1856 and NFY (Demeure et al, JAS, in press). In order to identify all can-didate genes that may be responsible for the QTL effects, it was particularly important to establish a detailed com-parative mapping analysis of this region.
We first built a dense porcine RH map (Figure 1A) using the high resolution IMNpRH212000rad panel, allowing us
to order unambiguously genes at distances of 100 to 600 Kb [7]. Our data confirmed the shift of the rearranged fragment and its precise location in the pig genome between RING1 and VPS52 genes (previously called SACM2L) (fragments 1 and 2). In contrast to Barbosa et al [12], we show that VPS52 is located close to RAB2L in both species. We also determined more precisely the extent of the fragment rearranged between the human and pig genomes. The upper frontier of this fragment is located between ELOVL5 (previously named HELO1) and GCLC, located respectively at 53.28 and 53.43 Mb on HSA6. The lower boundary of the fragment is defined by the first gene located on HSA6q also mapped on SSC1. This first gene was previously designated as FLJ13159, and was located at 71.53 Mb on HSA6 [11]. We showed that GLULD1, located at 64.05 Mb on HSA6, also mapped on SSC1 and constitutes the limit currently identified in this fragment.
The gene-based RH map (Figure 1A) that we built allowed us to define 3 sub-fragments of this region arranged differ-ently on the pig and human genomes. Two of these sub-fragments are delimited by genes: BMP5 and GCLC for the first one (fragment 4), and PRIM2A and COL21A1 for the second (fragment 5). No genes were identified in the third fragment (fragment 6), which contains the anonymous microsatellite Sw1856. This map greatly refines the inter-nal rearrangements suggested by our previous work [11]. The sum of the sizes of fragments 4 and 5 is ~4.3 Mb and is similar to the orthologous human region. Fragment 6 covers 1.4 Mb in the human map, whereas the size of this fragment in the porcine RH map suggests a size of approx-imately 900 Kb which would indicate that a fragment of 500 Kb is absent in the porcine genome. The fragment containing Sw1856 on the pig genome might thus be orthologous to part of the region flanking the centromere of HSA6, but at that step it remained to be proved (Figure 1A).
To confirm the order of genes suggested by RH mapping and study this region in more detail, we built a contig of BAC covering the entire region (Figure 2). The availability of elementary contigs resulting from the fingerprinting of clones from the INRA BAC library and sequences of extremities of 35000 of these BAC (BES) (Chardon et al, in preparation) greatly facilitated the establishment of this complete contig. Our work completes the studies begun by Barbosa et al [12], who presented 4 small contigs. The analysis of porcine BES anchoring on the human genome demonstrates that the fragment 6 containing porcine marker Sw1856 corresponds to a fragment framing the centromere of HSA6 (6p11.1-6q11.1). Taking into account the average distance between two hits of porcine BES on human genome, we can say that if additional frag-ments from other human chromosomes are located in
this rearranged region of the porcine genome, they should measure <50 Kb.
Analysis of the anchoring of porcine BES on the human genome highlighted also additional results: 1) It was indeed possible to define the position of the 3 synteny breakpoints (Figure 3). On the human genome, these syn-teny breakpoints (A-H, I-C and B-G) are situated between
genes RING1-VPS52, ELOVL5-GCLC and
BMP5-COL21A1. Each of these 3 synteny breakpoints are local-ized in a interval of ~100–200 Kb, between the human positions 33.26 Mb-33.35 Mb, 53.24 Mb-53.48 Mb and 55.93 Mb-56.01 Mb. 2) The fourth synteny breakpoint (E-F on the pig genome and (E-F-D on the human genome) was identified thanks to the anchoring of the BES in the human genome: the two fragments framing HSA6 centro-mere were found in a different order on the pig genome without the presence of a centromere (Figure 3). 3) For several BES, alignment on the human genome showed 2 possible positions with similar likelihood. This result sug-gested the existence of duplicated sequences close to the human centromere, which was confirmed by a dot plot on itself of the sequence of this human region. Phylogeny studies of human chromosome 6 demonstrated the repo-sitioning of this centromere among primate species in a region equivalent to 6p22.1 in Eulemur macaco, Callithrix jacchus and Lagothrix lagothrica, to 6q22 in Macaca fascicu-laris and Presbytis cristata, and to 6p12 in the great apes [25]. The repeated sequences we highlighted might then correspond to sequences of an ancestral centromere posi-tioned in HSA6p22.1 [25]. 4) Lastly, in silico analysis of the BES alignments on the human genome provided evi-dence of the absence from the pig genome of a fragment of ~400–500 Kb found in human genome. One can argue that the 2 BES of BAC bI0688H06 match on the human genome with sequences distant of 650 Kb (at 63.02 Mb and 63.67 Mb). The absence of anchoring of other BES between 63.05 Mb and 63.55 Mb, whereas one hit is found for each 20 Kb in the surrounding region, con-firmed that this fragment is absent from the pig genome. This region appears to be heavily rearranged between the porcine and human genomes. We wanted to determine if these rearrangements are specific of suines or Cetartiodac-tyles, or occur in many other species. To identify gene order in other species, we used the genomic sequence when available. For Gallus gallus, the assembly of the genome has not been totally completed; this is why we enriched information obtained from the sequence by RH mapping data when it was necessary (Figure 4). The order of genes seems to be conserved between the chicken and human genomes except for the RXRb and RING1 genes (belonging to fragment 1). These 2 genes which may not exist in the chicken genome are located in other species in the extended class II region of MHC. The chicken MHC,
named the B locus, is a 92 Kb DNA sequence containing 19 genes [26,27]. It defines a minimal essential set of MHC genes conserved over 200 million years of diver-gence between birds and mammals [27].
As the available assembly of the cow genome consists of many independent sequence scaffolds, we determined the gene order by RH mapping [22] (Figure 1B). Our results reveal that genes from GCLC to KHDRBS2 (fragments 4, 5 and 6) are similarly ordered on the human and bovine genomes in this region, which suggests that the internal rearrangements of these 3 fragments, comparing the human and porcine genomes, are specific to the evolution of the suine family. Everts-van der Wind et al. [18] reported that 12 cattle chromosomes are entirely similar to a complete human chromosome arm, and in particular, that p and q arms of HSA6 are homologs of BTA23 and BTA9. Our study modifies slightly this report, in that KHDRBS2 (belonging to fragment 6), the first gene local-ized on the long arm of human chromosome 6, is proba-bly located on bovine chromosome 23. As the number of genes in this region, as in other species, is very limited; it is difficult to develop and map markers in this region. The end of BTA23 might thus signal the location of the centro-mere in the ancestors of Cetartiodactyles, in which the fis-sion between the 2 chromosomal arms occurred. In this region, a further comparison of the bovine genomic sequence with the human sequence will be of interest. We compared the gene order in the pig (Sus scrofa) and cattle (Bos Taurus) with the situation in the genomic sequence of Mus musculus, Canis familiaris, Gallus gallus and Homo sapiens (Figure 4). We observed at first that on the pig genome, a large fragment (comprising fragments 4, 5 and 6) of ~5.2 Mb is shifted between RING1 and VPS52, 2 genes belonging to the extended class II region of the MHC. If MHC is one of the most dynamic regions of the genome [28], a high level of conservation of genome organization provides evidence in this region of extended class II genes [29]. Fourteen genes occur in this region between RING1 and the VPS52 in dog, cat, human and mouse genomes, which only differs in the presence of processed pseudogenes [29]. This small fragment of 500 Kb containing RING1 and VPS52 is thus dynamically involved in chromosomal evolution. It is interesting to note that the translocation of the 5.2 Mb fragment occurs in this region. In this region, the genomic organization of the fragment and its flanking regions is similar in mouse, human, dog and chicken, whereas translocation is observed in pig and cattle. This suggests that this genomic reorganization occurred after the divergence of the com-mon ancestor of Cetartiodactyles from the Ferungulates ancestor between 94 to 62 million years ago [30]. The gene order observed in pig for the 5.2 Mb fragment is dif-ferent from the one identified in other species, indicating
that these internal rearrangements occurred after rumi-nant-suine speciation. We identified a situation really dif-ferent from the map presented by Everts-van der Wind et al. for the proximal part of BTA23 close to the centromere [23]. Further study of the rearrangements that occurred in ruminants in this region of extended class II of the MHC complex is clearly needed.
We used GRIMM to compare the different maps available and to present a possible evolution of this region between the various species [24]. The unrooted tree we obtained (Figure 4) presents a very different view from a classical phylogenic tree [31,32], highlighting a high rate of rear-rangements in this region that have occurred recently in Cetartiodactyles. The study of local rearrangements also provides a view different from the recent multispecies comparison of this region [33]. In order to filter out noise induced by mapping errors, this analysis from Murphy et al only took into account fragments >3 Mb, defined by three genes. Among other results, they documented the reuse of evolutionary breakpoint regions identified between conserved homologous synteny blocks. Our study indicates that such a study should be redone on a more detailed scale, when the accuracy of mapping data is adequate.
Conclusion
A QTL affecting fattening and growth had been mapped in the porcine region SSC 7q1.2. As we had shown that a small fragment is translocated between porcine and human genome, it was important to establish a final com-parative map of this region. The RH map and the BAC contig we developed in this region allowed us to attest that the translocated fragment is approximately 5.2 Mb long. It consists in three blocks, found in HSA6 between 53.45 and 63.5 Mb, one of these blocks containing a few genes, framing the centromere on the human chromo-some. The multispecies study allowed us to confirm that the translocation of this 5.2 Mb fragment occurred in the common ancestor of pig and ruminants, whereas internal rearrangements are found only in the pig genome. The exact knowledge of the genomic content of this region permits us now to establish a list of all possible candidate genes that may affect the growth and fattening of pigs.
Methods
Markers and PCR amplification
The ICCARE (Interspecific Comparative Clustering and Annotation foR Ests) tool available at [13] allowed us to select 16 genes in the region between RXRB and RAB2L, for which a porcine EST sequence is available (Table 1). In addition, 88 markers have been developed from INRA BAC ends. Several result from personal sequencing using the BigDye Terminator V3.1 cycle sequencing kit (Applied Biosystems) on the ABI 3700 automatic sequencer; these
sequences were submitted to EMBL Nucleotide Sequence Database (AM156864 to AM156903) [34]. Others come from BAC ends sequences available on ENSEMBL [19]. Primers have been chosen using Primer3 software [35]. PCR was performed in a 15 µl reaction volume containing 25 ng template DNA, 200 µM dNTP, 0.25 µM specific primer pair and 0.5 U Taq polymerase (GoTAQ) in the reaction buffer supplied by the manufacturer. Amplifica-tions were carried out on a Gene-Amp System 9700 (Applied Biosystems) thermocycler. Thermal cycling parameters were defined as follows: denaturation at 94°C for 5 min, followed by 32 cycles of (1) 94°C for 45 sec, (2) annealing temperature for 45 sec, (3) 72°C for 45 sec, and a final extension was performed at 72°C for 5 min. PCR products were analyzed on a 2% agarose gel, and visual-ized after ethidium bromide staining.
RH mapping
Markers were mapped on the IMpRH panel [6] and IMNpRH2 panel [7] according to the INRA protocols. For markers used on IMpRH panel, vectors were submitted to the IMpRH web server at [36] for an initial two-point assignment. Then, vectors obtained on IMpRH and IMNpRH2 were analyzed with Carthagene software [14]. A 1000:1 framework map was built with buildfw option using a stepwise locus adding strategy under an haploid model of fragment retention. The different provisional frameworks were checked using the simulated annealing algorithm to test inversion of the map fragments, and the flips algorithm to test all local permutations in a window of 6 markers. The resulting RH map was drawn with Map-chart 2.0 [37]. An RH map was also established for the bovine genome using the bovine RH panel RH5000 [22]. Several markers were also mapped on the chicken genome using ChickRH6 panel [20].
BAC screening and chromosome walking
The INRA BAC porcine library [12], was screened by PCR on BAC super pools and pools. The presence of the expected sequence in the identified BAC was checked by PCR on DNA from the isolated BAC clone. For the selected BAC that had been previously fingerprinted and incorporated in a primary INRA contig (Chardon et al in preparation), all BAC from this contig were selected from INRA BAC Server [38]. To confirm the BAC overlapping, markers developed from BES were tested against DNA of BAC belonging to its primary contig or BAC located at the extremities of adjacent contigs.
Multispecies comparison
In order to determine genes order in other species, 12 genes (RXRB, RING1, VPS52, RAB2L, ELOVL5, GCLC, BMP5, COL21A1, DST, PRIM2A, KHDBRS2, GLULD1) were located with Blast in human by using NCBI build 35 produced by the International Human Genome
Sequenc-ing Consortium, in mouse (Mus musculus) draft genome data was obtained from the Build 33 assembly by NCBI, in chicken (Gallus gallus) draft assembly was produced by the Genome Sequencing Center at the Washington Uni-versity School of Medicine in St. Louis, in dog (Canis familiaris) whole genome shotgun (WGS) assembly v1.0 was sequenced and assembled by the Broad Institute of MIT/Harvard and Agencourt Bioscience. We used the GRIMM software [24] to estimate the rearrangements between species and build a multispecies phylogenetic tree.
List of abbreviations
MHC major histocompatibility complex; QTL quantita-tive trait locus; SLA swine leucocyte antigen; RH radiation hybrid; BAC bacterial artificial chromosome; BES BAC end sequence, cR centi Ray; HSA human chromosome; SSC porcine chromosome; MMU murine chromosome; BTA bovine chromosome; GGA chicken chromosome; CFA dog chromosome; IMNpRH2 INRA Minnesota Nevada porcine Radiation Hybrid panel 2.
BAC bIxxxZxx are from INRA BAC library [12], BAC bExxxZxx are from CHORI242 library (P. de Jong, et al., unpubliched), BAC bTxxxZxx are from Roslin BAC library [39], RPCI44_xxxZxx are BAc clones from RPCI44 library (P. de Jong et al., unpublished).
Authors' contributions
JD built the complete contig using the INRA BAC library fingerprinting, did the genotyping of the porcine and bovine RH panels, made the in silico analyses and drafted the manuscript. JR supervised this work. KF took part in the development and the explanation of the techniques. MG provided DNA of bovine RH5000 panel and the vec-tors for the bovine markers previously mapped in the studied region. MM did the genotyping and the analyses on the chicken RH panel. CR performed some preliminary BAC screening. PC coordinated the fingerprinting of INRA BAC and the providing of all BAC necessary to the con-struction of the contig. DM conceptualized the investiga-tion, analyzed the RH data, and finalized the manuscript.
Acknowledgements
We would like thank Laurent Schibler, Anne Roig and Jean Claude Save for providing the fingerprints of BAC clones of INRA library, F. Puimi, and the CRB GADIE (Jouy en Josas, France) for providing the BAC clones. We also thank the CNS (Evry, France) for the BAC ends sequencing, and T. Faraut and P. Dehais for help in sequence comparison. JD is supported by a PhD grant from the FSE (Fonds Social Européen).
References
1. Milan D, Bidanel JP, Iannuccelli N, Riquet J, Amigues Y, Gruand J, Le Roy P, Renard C, Chevalet C: Detection of quantitative trait loci
for carcass composition traits in pigs. Genet Sel Evol 2002, 34:705-728.
2. Bidanel JP, Milan D, Iannuccelli N, Amigues Y, Boscher MY, Bourgeois F, Caritez JC, Gruand J, Le Roy P, Lagant H, Quintanilla R, Renard C,
Gellin J, Ollivier L, Chevalet C: Detection of quantitative trait
loci for growth and fatness in pigs. Genet Sel Evol 2001, 33:289-309.
3. Wada Y, Akita T, Awata T, Furukawa T, Sugai N, Inage Y, Ishii K, Ito Y, Kobayashi E, Kusumoto H, Matsumoto T, Mikawa S, Miyake M, Murase A, Shimanuki S, Sugiyama T, Uchida Y, Yanai S, Yasue H:
Quantitative trait loci (QTL) analysis in a Meishan x Gottin-gen cross population. Anim Genet 2000, 31:376-384.
4. Rattink AP, De Koning DJ, Faivre M, Harlizius B, van Arendonk JA, Groenen MA: Fine mapping and imprinting analysis for fatness
trait QTLs in pigs. Mamm Genome 2000, 11:656-661.
5. Malek M, Dekkers JC, Lee HK, Baas TJ, Prusa K, Huff-Lonergan E, Rothschild MF: A molecular genome scan analysis to identify
chromosomal regions influencing economic traits in the pig. II. Meat and muscle composition. Mamm Genome 2001, 12:637-645.
6. Yerle M, Pinton P, Robic A, Alfonso A, Palvadeau Y, Delcros C,
Hawken R, Alexander L, Beattie C, Schook L, Milan D, Gellin J:
Con-struction of a whole-genome radiation hybrid panel for high-resolution gene mapping in pigs. Cytogenet Cell Genet 1998, 82:182-188.
7. Yerle M, Pinton P, Delcros C, Arnal N, Milan D, Robic A:
Genera-tion and characterizaGenera-tion of a 12,000-rad radiaGenera-tion hybrid panel for fine mapping in pig. Cytogenet Genome Res 2002, 97:219-228.
8. Martins-Wess F, Milan D, Drogemuller C, Vobeta-Nemitz R, Brenig B, Robic A, Yerle M, Leeb T: A high resolution physical and RH
map of pig chromosome 6q1.2 and comparative analysis with human chromosome 19q13.1. BMC Genomics 2003, 4:20.
9. Genet C, Renard C, Cabau C, Rogel-Gaillard C, Gellin J, Milan D: In
the QTL region surrounding porcine MHC, gene order is conserved with human genome. Mamm Genome 2001, 12:246-249.
10. Tanaka M, Matsumoto T, Yanai S, Domukai M, Toki D, Hayashi T,
Kiuchi S, Yasue H, Uenishi H, Kobayashi E, Awata T: Conservation
of the syntenies between porcine chromosome 7 and human chromosomes 6, 14 and 15 demonstrated by radiation hybrid mapping and linkage analysis. Anim Genet 2003, 34:255-263.
11. Demeure O, Renard C, Yerle M, Faraut T, Riquet J, Robic A, Schiex T, Rink A, Milan D: Rearranged gene order between pig and
human in a QTL region on SSC 7. Mamm Genome 2003, 14:71-80.
12. Barbosa A, Demeure O, Urien C, Milan D, Chardon P, Renard C: A
physical map of large segments of pig chromosome 7q11-q14: comparative analysis with human chromosome 6p21.
Mamm Genome 2004, 15:982-995.
13. Muller C, Denis M, Gentzbittel L, Faraut T: The Iccare web server:
an attempt to merge sequence and mapping information for plant and animal species. Nucleic Acids Res 2004, 32:W429-34.
14. de Givry S, Bouchez M, Chabrier P, Milan D, Schiex T: CARHTA
GENE: multipopulation integrated genetic and radiation hybrid mapping. Bioinformatics 2005, 21:1703-1704.
15. UCSC GB: . [http://genome.ucsc.edu].
16. Rogel-Gaillard C, Bourgeaux N, Billault A, Vaiman M, Chardon P:
Construction of a swine BAC library: application to the char-acterization and mapping of porcine type C endoviral ele-ments. Cytogenet Cell Genet 1999, 85:205-211.
17. SANGER I: . [http://www.sanger.ac.uk].
18. Sonnhammer EL, Durbin R: A dot-matrix program with dynamic
threshold control suited for genomic DNA and protein sequence analysis. Gene 1995, 167:GC1-10.
19. ENSEMBL D: http://www.ensembl.org. .
20. Morisson M, Lemiere A, Bosc S, Galan M, Plisson-Petit F, Pinton P, Delcros C, Feve K, Pitel F, Fillon V, Yerle M, Vignal A: ChickRH6: a
chicken whole-genome radiation hybrid panel. Genet Sel Evol
2002, 34:521-533.
21. ChickRH WS: . [http://www.toulouse.inra.fr/lgc/chickrh/]. 22. Williams JL, Eggen A, Ferretti L, Farr CJ, Gautier M, Amati G, Ball G,
Caramorr T, Critcher R, Costa S, Hextall P, Hills D, Jeulin A, Kiguwa SL, Ross O, Smith AL, Saunier K, Urquhart B, Waddington D: A
bovine whole-genome radiation hybrid panel and outline map. Mamm Genome 2002, 13:469-474.
23. Everts-van der Wind A, Kata SR, Band MR, Rebeiz M, Larkin DM,
Everts RE, Green CA, Liu L, Natarajan S, Goldammer T, Lee JH, McKay S, Womack JE, Lewin HA: A 1463 gene cattle-human
Publish with BioMed Central and every scientist can read your work free of charge
"BioMed Central will be the most significant development for disseminating the results of biomedical researc h in our lifetime."
Sir Paul Nurse, Cancer Research UK Your research papers will be:
available free of charge to the entire biomedical community peer reviewed and published immediately upon acceptance cited in PubMed and archived on PubMed Central yours — you keep the copyright
Submit your manuscript here:
http://www.biomedcentral.com/info/publishing_adv.asp
BioMedcentral
comparative map with anchor points defined by human genome sequence coordinates. Genome Res 2004,
14:1424-1437.
24. Tesler G: GRIMM: genome rearrangements web server.
Bioin-formatics 2002, 18:492-493.
25. Eder V, Ventura M, Ianigro M, Teti M, Rocchi M, Archidiacono N:
Chromosome 6 phylogeny in primates and centromere repositioning. Mol Biol Evol 2003, 20:1506-1512.
26. Guillemot F, Billault A, Pourquie O, Behar G, Chausse AM, Zoorob R, Kreibich G, Auffray C: A molecular map of the chicken major
histocompatibility complex: the class II beta genes are closely linked to the class I genes and the nucleolar organ-izer. Embo J 1988, 7:2775-2785.
27. Kaufman J, Milne S, Gobel TW, Walker BA, Jacob JP, Auffray C,
Zoorob R, Beck S: The chicken B locus is a minimal essential
major histocompatibility complex. Nature 1999, 401:923-925.
28. Kelley J, Walter L, Trowsdale J: Comparative genomics of major
histocompatibility complexes. Immunogenetics 2005,
56:683-695.
29. Debenham SL, Hart EA, Ashurst JL, Howe KL, Quail MA, Ollier WE, Binns MM: Genomic sequence of the class II region of the
canine MHC: comparison with the MHC of other mamma-lian species. Genomics 2005, 85:48-59.
30. Springer MS, Murphy WJ, Eizirik E, O'Brien SJ: Placental mammal
diversification and the Cretaceous-Tertiary boundary. Proc
Natl Acad Sci U S A 2003, 100:1056-1061.
31. Bourque G, Pevzner PA, Tesler G: Reconstructing the genomic
architecture of ancestral mammals: lessons from human, mouse, and rat genomes. Genome Res 2004, 14:507-516.
32. Bourque G, Pevzner PA: Genome-scale evolution:
reconstruct-ing gene orders in the ancestral species. Genome Res 2002, 12:26-36.
33. Murphy WJ, Bourque G, Tesler G, Pevzner P, O'Brien SJ:
Recon-structing the genomic architecture of mammalian ancestors using multispecies comparative maps. Hum Genomics 2003, 1:30-40.
34. EMBL NSD: . [http://www.ebi.ac.uk/embl/].
35. Primer3 S: . [http://frodo.wi.mit.edu/cgi-bin/primer3/
primer3_www.cgi].
36. Milan D, Hawken R, Cabau C, Leroux S, Genet C, Lahbib Y, Tosser G, Robic A, Hatey F, Alexander L, Beattie C, Schook L, Yerle M, Gellin J: IMpRH server: an RH mapping server available on the
Web. Bioinformatics 2000, 16:558-559.
37. Voorrips RE: MapChart: software for the graphical
presenta-tion of linkage maps and QTLs. J Hered 2002, 93:77-78.
38. Server INRABACW: http://imprh.toulouse.inra.fr. .
39. Anderson SI, Lopez-Corrales NL, Gorick B, Archibald AL: A
large-fragment porcine genomic library resource in a BAC vector.