HAL Id: hal-01930879
https://hal.umontpellier.fr/hal-01930879
Submitted on 26 May 2021HAL is a multi-disciplinary open access
archive for the deposit and dissemination of sci-entific research documents, whether they are pub-lished or not. The documents may come from teaching and research institutions in France or abroad, or from public or private research centers.
L’archive ouverte pluridisciplinaire HAL, est destinée au dépôt et à la diffusion de documents scientifiques de niveau recherche, publiés ou non, émanant des établissements d’enseignement et de recherche français ou étrangers, des laboratoires publics ou privés.
region of Lagos (Nigeria)
Olusegun Adeaga, Gil Mahe, Claudine Dieulin, Françoise Elbaz-Poulichet,
Nathalie Rouche, Jean-Luc Seidel, Éric Servat
To cite this version:
Olusegun Adeaga, Gil Mahe, Claudine Dieulin, Françoise Elbaz-Poulichet, Nathalie Rouche, et al.. Quality of water resources in the Niger basin and in the region of Lagos (Nigeria). Bulletin of Geog-raphy. Physical Geography Series, Nicolaus Copernicus University in Torun, 2017, 13 (1), pp.51 - 60. �10.1515/bgeo-2017-0013�. �hal-01930879�
© 2017 Nicolaus Copernicus University. All rights reserved. © 2017 De Gruyter Open (on-line). ISSN 2080-7686
Bulletin of Geography. Physical Geography Series 2017. This is an Open Access article distributed under the terms of the Creative Commons Attribution- -NonCommercial 4.0 International License (http://creativecommons.org/licenses/by-nc/4.0/), permitting all non-commercial use, distribution, and reproduction in any medium, provided the original work is properly cited.
Bulletin of Geography. Physical Geography Series, No. 13 (2017): 51–60 http://dx.doi.org/10.1515/bgeo-2017-0013
Olusegun Adeaga
1*, Gil Mahe
2, Claudine Dieulin
2,
Francoise Elbaz-Poulichet
2, Nathalie Rouche
2, Jean-Luc Seidel
2,
Eric Servat
21 University of Lagos, Nigeria
2 HydroSciences Montpellier Laboratory, France
* Correspondence: Department of Geography, University of Lagos, Nigeria. E-mail: oadeaga@unilag.edu.ng
Abstract. Water quality studies in Nigeria are usually conducted at local scales and limited to a
re-stricted number of chemical contaminants, while reliable data on trace metal concentrations (including arsenic) are relatively scarce. This study focuses on the quality of available renewable water resourc-es in terms of major ion and trace element concentrations at selected sampling locations in the Low-er RivLow-er NigLow-er basin and part of the Lagos region. A screening of watLow-er contamination by arsenic and heavy metals was carried out through water sampling at selected locations using in situ meas-urement and laboratory testing to estimate heavy metal concentrations and water type. The analy-sis reveals moderate trace element contamination of the water resources, with the exception of Pb, while Mn and, to a lesser extent, Al exceeded WHO quality standards, but the Arsenic concentra-tions are within drinking water quality standards and are safe for consumption and irrigation, while the water type is Bicarbonate.
Quality of water resources in the Niger basin and
in the region of Lagos (Nigeria)
Key words: Niger Delta, River Niger, water quality, Arsenic
Introduction
Heavy metals are metallic elements present in both natural and contaminated environments due to dif-ferences in geography and geologies, as well as in anthropogenic activities (Berner and Berner 1987; Bricker and Jones 1995). Metals such as copper, zinc and chromium are nutritionally essential for a healthy life, while others such as lead, mercury, arsenic and cadmium are mostly poisonous to hu-mans due to their non-degradability, persistence
and bio-accumulation in the food chain. Thus, once deposited in the environment, for years they remain poisonous to humans through inhalation, ingestion and skin absorption.
Although heavy metals naturally occur at low concentrations with relatively short residence times in water, river catchments can become a source of concern if the level of heavy metals in them ex-ceeds health guideline concentrations. The sourc-es of heavy metal load include weathered soil or rocks, mining and metallurgical releases, and
in-dustrial emissions (Olatunji and Osibanjo 2012). Others include disposal of untreated and partial-ly treated effluents that contain toxic metals, metal chelates from various industries, and the indiscrim-inate use of heavy metals in the production of ag-ricultural and household goods, such as fertilisers and pesticides.
It should be noted that concentrated heavy metal loads potentially threaten the environment and eco-system because they can accumulate in the human body, causing damage to the nervous system and in-ternal organs, with many severe health implications (Salomon and Forestner 1984; Lee et al. 2007; Ad-elana et al. 2012).
In Nigeria, the sources of metal pollution in riv-ers are usually attributed as industrial discharges, corrosion of iron and steel materials in buildings, leachates from dumpsites and vehicles, among oth-ers (Ayenimo et al. 2005; Jaji et al. 2007). Studies on water quality in Nigeria are usually conducted at local scales and limited to a restricted number of chemical contaminants, while reliable data on trace metal concentrations (including arsenic) are relatively scarce, as pointed out in the synthesis of the British Geological Survey (2003). Animi et al. (2008) estimated that there is a probability of being more than 0.75 above the World Health Organiza-tion’s recommended arsenic concentration (10µg/l) in about 9% of the Nigerian drinking water resourc-es, due to increasing contamination, mostly from anthropogenic sources.
Studies on heavy metal concentrations within the River Niger basin system is therefore absolutely imperative, considering the health consequences of the various increased anthropogenic activities in the system over the years, especially in the lower sec-tion of the Niger basin. These activities include in-creased agricultural and industrial waste, as well as the deposition of untreated domestic and industri-al effluent. Thus, the objective of this study was to provide an update of trace metal and arsenic con-centrations in the waters of the Niger basin and the region of Lagos. It should be noted that this study is part of the BFP Niger programme.
Regional setting
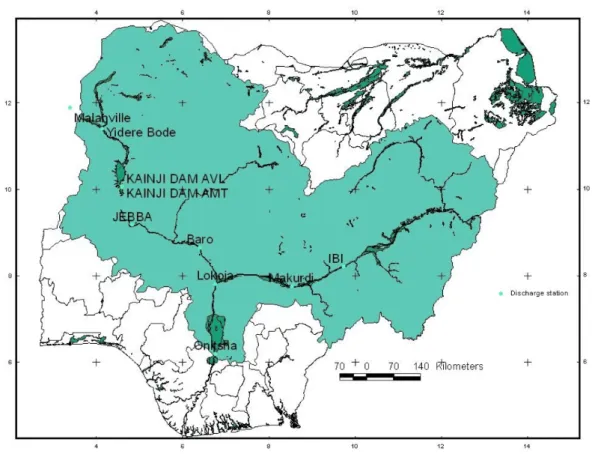
The lower Niger Basin system begins at the en-try point of the River Niger into Nigeria at about 162 km north of Lake Kainji and continues to the outlet into the Gulf of Guinea through the Niger Delta region (Fig. 1). The Sokoto River joins the Niger approximately 75 km downstream of the Ni-gerian border and extends upstream with a broad floodplain for about 387 km (Hughes and Hughes 1991). Other tributaries of the River Niger in Nige-ria include the rivers Rima, Kaduna, Gbako, Gurara and Anambra. In its lower course, the Niger forms a confluence with the Benue River at Lokoja, af-ter which the Benue River remains its major tribu-tary, as well as significant local precipitation, which strongly increase the flow. The tributaries of the Be-nue River include the Gongola, Taraba, Donga, Kat-sina-Ala and Mada Rivers.
The lower Niger basin receives an annual rain-fall of between 1,000 and 4,000 mm with inter-an-nual rainfall variability ranging from 10% to 20%. The system has a drainage basin of about 629,545 km2 with a discharge contribution of about 117km3/
year, constituting about 64.3% of the River Niger’s total flow. The flooding of the upper and middle Ni-ger lasts from July to November, with the low-water period lasting from December to June. As the river receives tributaries from different climatic areas, the merging of the different flood regimes may produce a second peak, as in the North of Nigeria (Mahe et al. 2001; Niger-HyCOS 2006).
In addition, over the years the lower Niger has been experiencing a marked decrease in flow, with a mean flow of 6,055 m3s-1 (191 km3/year) for 1929–
1970 compared to 5,066 m3s-1 (160 km3/year) for
the period 1971–2001; a decrease of about 17%. Also recorded is a reduction in annual average discharge to about 20% downstream of the Kainji Dam, before dropping to 45% due to Bakolori, Kiri and Pankshin.
It should be noted that since the beginning of this century, the Niger River has been subjected to several natural and anthropogenic perturbations resulting from the Sahelian drought of the 1970s. In the lower Niger basin, especially downstream of the confluence at Lokoja, extensive environmen-tal pollution from increasing anthropogenic
activi-O. Adeaga et al. Quality of water resources in the Niger basin and in the region of Lagos (Nigeria)
Citation: Bulletin of Geography. Physical Geography Series 2017, 13, http://dx.doi.org/10.1515/bgeo-2017-0013 53
ties is all too evident, with untreated industrial and human effluent and waste. Dam-building and nu-merous irrigated perimeters have also modified the hydrological conditions of the Niger. Severe envi-ronmental problems in the lower Niger Basin, es-pecially downstream of the Onitsha station, include oil- and gas-related development activities, oil spills, refinery operations, oil transportation, gas flaring, dredging of canals and land taken for the construc-tion of facilities.
Methodology
Water sampling and sample pre-treatment
Water-contamination screening for arsenic and heavy metals was carried out in January 2009 in the lower part of the Niger and Benue Rivers and in the region of Lagos. Sampling was carried out on the water from the Niger, the Benue (Fadamas and well water) and the River Ogun (Lagos region).
‘Fada-ma’ is a Hausa name for irrigable land which usual-ly relates to low-usual-lying plains which are underlain by shallow aquifers and found along major river sys-tems in the alluvial plain of Northern Nigeria. This plain is a major year-round water resource source for fish farming, agriculture and stockbreeding ac-tivities.
The collecting of water samples entails traversing through New Bussa to Onitsha and the Ogun Riv-er using a local motor boat to access the sampling points along the river’s course. The sampling points (Stations LN, LB, OG1 & OG2) were selected along the River Ogun due to the fact that this river drains the largest portion of Lagos Mega city. The studied water resource (river, fadamas) drains a sedimenta-ry formation. In total, twelve sampling points were selected and they are described in Table 1.
The pH and temperature measurements of sam-pled water were carried out in the field using an in-situ device. Samples were later filtered on Nu-clepore polycarbonate membranes (0.22 µm) and stored in polyethylene bottles as a pre-treatment to proper analysis procedures. For trace element
pre-analysis, these bottles were carefully washed with nitric acid. Water sample analysis was carried out at the HSM Laboratory (Montpellier), France.
Water quality analysis procedure
At the HSM laboratory, samples for major cations (Ca2+, Mg2+, Na+, K+) and trace elements were
acid-ified to pH2 with HNO3 Merck Suprapur. Cations and major anions (Cl-, SO
42-) were then determined
using ionic chromatography. HCO3- and CO32- were
analysed using titration. Trace elements (Li, B, Al, V, Cr, Mn, Co, Ni, Cu, Zn, As, Pb, Rb, Sr, Mo, Cd, Ba, Pb and U) were quantified using ICP-MS.
Quantitative analyses of the sampled water were performed using a conventional external calibration procedure with Indium as an internal standard to correct for instrumental drift and possible matrix effects (Elbaz-Poulichet et al. 2006). Certified refer-ence materials from the National Research Coun-cil of Canada, i.e. SLRS-4 (freshwater sample), were also used to check analytical accuracy and precision of major and trace element concentrations in the waters of the lower Niger and Benue basins and of the region of Lagos.
For standardisation and comparison of the ma-jor and trace element concentrations in the waters of the Niger and Benue basins and of the region of Lagos, WHO maximum allowable concentrations in drinking water and mean annual European Qual-ity standards (EQS) for priorQual-ity metals in surface water as well as trace element concentrations in the Seine (Elbaz-Poulichet et al. 2006), Rhone
(El-baz-Poulichet et al. 1996), Thames (Neal et al. 2000) and Lena River (Martin et al. 1993) are provided for comparison.
For Cd and Cd-compound concentrations, com-parison with the European Quality standards (EQS) was based on the water hardness, as defined by the five following classes:
Class 1: <40 mg CaCO3/L, Class 2: 40–50 mg CaCO3/L, Class 3: 50–100 mg CaCO3/L, Class 4: 100–200 mg CaCO3/L, Class 5: ≥200 mg CaCO3/L.
In addition, the Piper diagram was adapted to reveal the hydrochemical regime of sampled water with respect to the presence of ions and identifica-tion of the designated water type. A Piper diagram consists of a geometrical combination of two out-er triangles and a middle or innout-er diamond-shaped quadrilateral. Water types are designated accord-ing to the zones in which these points fall on the middle quadrilateral plot (Piper 1944; Manoj et al. 2013).
Results and discussion
pH and water temperature distribution
Water temperature at the sampled stations var-ies from 25°C (Station LN and LB) to 30.8°C (Sta-tion OG1 and OG2) while there is an average of 26.3°C within the Niger Rivers and part of Lagos. It should be noted that water temperature in most
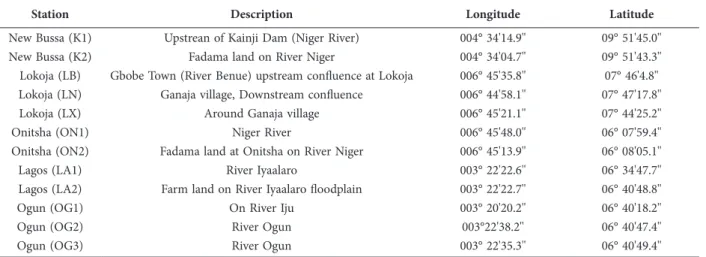
riv-Table 1. Description of water sampling station
Station Description Longitude Latitude
New Bussa (K1) Upstrean of Kainji Dam (Niger River) 004° 34'14.9'' 09° 51'45.0'' New Bussa (K2) Fadama land on River Niger 004° 34'04.7'' 09° 51'43.3'' Lokoja (LB) Gbobe Town (River Benue) upstream confluence at Lokoja 006° 45'35.8'' 07° 46'4.8'' Lokoja (LN) Ganaja village, Downstream confluence 006° 44'58.1'' 07° 47'17.8'' Lokoja (LX) Around Ganaja village 006° 45'21.1'' 07° 44'25.2''
Onitsha (ON1) Niger River 006° 45'48.0'' 06° 07'59.4''
Onitsha (ON2) Fadama land at Onitsha on River Niger 006° 45'13.9'' 06° 08'05.1'' Lagos (LA1) River Iyaalaro 003° 22'22.6'' 06° 34'47.7'' Lagos (LA2) Farm land on River Iyaalaro floodplain 003° 22'22.7'' 06° 40'48.8''
Ogun (OG1) On River Iju 003° 20'20.2'' 06° 40'18.2''
Ogun (OG2) River Ogun 003°22'38.2'' 06° 40'47.4''
O. Adeaga et al. Quality of water resources in the Niger basin and in the region of Lagos (Nigeria)
Citation: Bulletin of Geography. Physical Geography Series 2017, 13, http://dx.doi.org/10.1515/bgeo-2017-0013 55
ers in Nigeria ranged between 24 and 28°C (26.17 ± 1.47°C), with the lowest temperature measured dur-ing the wet season.
The pH values of the sampled waters range from 6.13 (station OG1) (slightly acidic) to 8 (station LN) (slightly alkaline), with an average of 7.1 (almost neutral). It should be noted that water that pass-es through the urbanised region with high human population density and low regolith buffer capaci-ty are slightly acidic, as evident in sampled stations (ON2, LA1, LA2, OG1). In comparison with the water from the sampled river, pH along the low-er Rivlow-er Niglow-er ranges from 6.9 to 7.2 (7.1 ± 0.12) (Onwugbuta-Enyi et al. 2008) while the average val-ues for the Rivers Seine, Rhine and Thames and the World Health Organization (WHO) drinking wa-ter quality standard are 8.10, 8.10 and 8.15 (slightly basic), and (8.2–8.8), respectively. Thus, the pH val-ue of the sampled water along the lower Niger Riv-er basin and part of the Lagos region falls within
> Cd. The average concentrations (mg/L) of the heavy metals in the water are: Mn (150.25), Al (70), Sr (69.83), Ba (51.08), Co (40.55), B (26.31), Zn (14.01), Rb (8.17), Li (1.83), Cu (1.73), V (1.42), Ni (1.29), Pb (0.60), As (0.36), Cr (0.33), Mo (0.19), U (0.06) and Cd (0.05). The level of Mn was not-ed to be the most abundant of all the metals test-ed for during the study, followtest-ed by Al. Meanwhile, Cd had the lowest concentration among the metals determined in water samples from the River Niger and part of the Lagos region.
Concentrations of major and trace elements in the sampled water were generally below the maxi-mum allowable concentrations defined by the WHO for drinking water, with the exception of Mn (up to 506 <mg/L) and, to a lower extent, Al (up to 399.3<mg/L) (Table 2). The magnesium (Mn) con-centration (506 < 419 mg/L) at the ON2, LA1 and LA2 stations exceeded the WHO allowable stand-ard, while concentrations at the LA1, LA2, OG2 OG3 and ON2 stations (506 < 61 mg/L) exceeded EU quality standards for surface water (EC 2005). The consumption of this water resource might be dangerous, since manganese is a neurotoxic metal (Centeno et al. 2004). Elevated Mn concentrations at these stations might be from the application of fertiliser and from industrial effluents. An elevated aluminum concentration is recorded at the LN sta-tion followed by the ON1 stasta-tion, while stasta-tion ON2 had the lowest concentaration (Fig. 4). Aluminum makes up around 8% of the Earth’s surface, making it the third most common element. It can be selec-tively leached from rock and soil to enter any water source, as well as from disposed-of unsorted waste, most especially cans and waste alloys; its concen-trations increase with increasing water depth.
Ex-Figure 2. Surface water temperature and pH distribution at the se-lected stations
the acceptable WHO and EU standard for drinking water quality. The relationship between temperature and pH of sampled stations is shown in Figute 2.
The water quality index estimation based on sampled water temperature shows that stations K1, K2 and ON1 had excellent surface water quality, while stations LB, LN and LX were good, and LA1, LA2, OG1, OG2 and OG3 stations were mendium (fair) (Fig. 3).
Heavy metal concentration hydrochemistry of the sampled water
The availability of metals, as shown in Table 2, is in the order: Mn > Al > Sr > Ba > Co > B > Zn >
Table 2. Distribution of major trace elements in the lower Niger River basin and part of the Lagos region Ite m / μ g/ L Li B A l V Cr M n C o N i Cu Zn As Rb Sr M o C d Ba Pb U N ew B us sa (K l) 0. 22 4. 9 45 .6 1. 02 0. 12 5. 4 0. 09 3 0. 65 2. 98 6. 2 0. 35 3. 9 53 0. 08 7 0. 02 7 46 0. 73 0. 03 N ew B us sa (k 2) 6. 61 2. 3 3. 2 6. 4 0. 15 1. 3 0. 05 0. 67 2. 55 22 .9 0. 07 0. 3 14 4 0. 15 6 0. 02 5 71 0. 44 0. 32 6 Lo ko ja (L B) 0. 12 2. 2 29 .5 1. 92 0. 1 1. 1 0. 03 2 0. 23 0. 79 1. 4 0. 11 2. 4 61 0. 18 6 0. 00 3 30 0. 11 0. 05 4 Lo ko ja (L N ) 0. 24 4. 1 39 9. 3 1. 2 0. 42 2. 4 0. 08 4 0. 56 0. 78 1. 2 0. 25 3. 5 47 0. 14 6 0. 00 1 38 0. 16 0. 05 7 Lo ko ja (L X) 0. 13 3. 7 60 .2 0. 91 0. 09 1. 8 0. 04 2 0. 44 0. 8 0. 8 0. 2 3. 5 48 0. 10 1 0. 00 1 36 0. 12 0. 05 1 O ni tsh a ( O N I) 0. 27 3. 7 11 9. 1 1. 26 0. 21 16 0. 09 3 0. 47 2. 23 3. 4 0. 23 3. 4 48 0. 11 7 0. 01 4 34 0. 15 0. 03 4 O ni tsh a ( 0N 2) 0. 49 7. 8 2. 3 0. 11 0. 07 46 9 3. 15 7 0. 99 1. 4 15 .8 0. 29 10 .7 63 0. 00 9 0. 02 2 62 0. 02 0. 01 La go s ( LA I) 6. 52 12 3 51 .7 0. 74 0. 98 25 9 2. 43 5 4. 65 1. 81 33 .9 1. 03 24 .6 88 0. 47 0. 21 9 59 2. 56 0. 01 6 La go s ( LA 2) 5. 75 13 7 46 .8 0. 67 1. 23 50 6 3. 28 5. 7 3. 48 54 .5 1. 18 33 .9 13 8 0. 66 0. 25 1 10 9 2. 22 0. 03 O gu n ( 06 1) 0. 59 7. 8 17 0. 22 0. 08 41 9 47 7 0. 05 0. 48 17 .1 0. 19 5. 9 37 0. 08 8 0. 00 1 33 0. 02 0. 00 4 O gu n ( 0G 2) 0. 52 9. 6 31 .5 1. 26 0. 22 61 0. 17 8 0. 45 1. 63 10 .7 0. 21 2. 9 55 0. 11 4 0. 01 5 47 0. 33 0. 05 3 O gu n ( 0G 3) 0. 53 9. 6 33 .8 1. 34 0. 29 61 0. 19 3 0. 59 1. 82 0. 22 0. 22 3 56 0. 12 0. 01 9 48 0. 36 0. 05 4 Av er ag e 1. 83 26 .3 1 70 .0 0 1. 42 0. 33 15 0. 25 40 .5 5 1. 29 1. 73 14 .0 1 0. 36 8. 17 69 .8 3 0. 19 0. 05 51 .0 8 0. 60 0. 06 St d. D ev ia tio n 2. 70 48 .6 0 10 8. 17 1. 64 0. 38 20 3. 49 13 7. 45 1. 84 0. 95 16 .5 1 0. 36 10 .3 5 35 .4 8 0. 19 0. 09 22 .2 5 0. 86 0. 09 W H O n. d. 50 0 20 0 n. d. 50 40 0 70 20 00 30 00 10 n. d. n. d. 70 3 70 0 10 15 EU n. d. 10 00 20 0 n. d. 50 50 20 10 00 n. d. 10 n. d. n. d. n. d. 5 70 0 10 n. d. A A-EQ S n. d. n. d. n. d. n. d. n. d. n. d. n. d. 20 n. d. n. d. n. d. n. d. n. d. n. d. n. d. n. d. 7. 2 n. d. M AC -E Q S n. d. n. d. n. d. n. d. n. d. n. d. n. d. 20 n. d. n. d. n. d. n. d. n. d. n. d. n. d. n. d. 7. 2 n. d. Ri ve r S ei ne n. d. 38 .3 - 8 7 n. d. n. d. n. d. 0. 46 -1 4. 4 n. d. n. d. 0. 49 -3 .4 7 0. 36 -1 .2 8 n. d. n. d. 0. 05 -2 .1 5 0. 00 8 2 .4 4 24 .3 0. 07 3 1 .2 1 n. d. Ri ve r R hi ne n. d. n. d. n. d. n. d. n. d. n. d. n. d. 1. 6 2. 2 0. 19 1. 95 n. d. n. d. n. d. 0. 03 3 n. d. 0. 08 3 n. d. Ri ve r Th am es n. d. 21 4 n. d. n. d. n. d. 10 0 n. d. n. d. 4. 3 2. 9 n. d. n. d. 3. 2 n. d. n. d. 0. 4 n. d. Ri ve r L en a n. d. n. d. n. d. n. d. n. d. n. d. n. d. 0. 3 0. 2-0. 6 0. 35 0. 15 n. d. n. d. n. d. 0. 00 3-0. 00 8 n. d. 0. 01 7 n. d. n.d. - no data
O. Adeaga et al. Quality of water resources in the Niger basin and in the region of Lagos (Nigeria)
Citation: Bulletin of Geography. Physical Geography Series 2017, 13, http://dx.doi.org/10.1515/bgeo-2017-0013 57
cess exposure to Al is related to nerve damage and allergies, and is believed to be carcinogenic.
Cd concentrations at all sampled stations were below the maximum allowable values in drink-ing water. Upstream of the Niger and Benue River confluence, before the Lokoja station, the sampled water was weakly contaminated by most trace el-ements except by Pb (2.56 < 0.02 mg/L), as com-pared to the Lena River, which is considered to be one of the most pristine of the large rivers. The con-tamination is probably due to the use of Pb as an anti-knock additive in gasoline. The use of leaded petrol in vehicles, disposal of vehicles and dry dep-osition of particulate lead in water bodies – most-ly from untreated industrial effluents – are also common sources of Pb in the Nigerian water sys-tem (Galadima et al. 2011). The use of Pb has been banned in most Northern countries, but persists in the South (Nriagu et al. 2008).
Downstream of the confluence of the River Ni-ger at Lokoja stations LB, LN and LX, the increase in metal concentrations was more prominent. For example, Kakulu and Osibanjo (1992) reported higher concentrations of heavy metals in the
War-ri and Calabar Rivers – both tWar-ributaWar-ries to the Riv-er NigRiv-er. Meanwhile, the Lagos region (Ogun RivRiv-er) displays the highest concentrations of several trace elements (B, Cr, Ni, Zn, As, Mo, Cd and Pb) at the Lagos stations LA1 and LA2, with particular-ly high concentrations of nitrate (5.7 < 4.65 mg/L) and Boron (137 < 123 mg/L) as compared to oth-er stations. The occurrence of these contaminants reflects the contamination of this water resource by domestic effluents (Rabiet et al. 2006). Boron is released from rocks and soils through weathering, and subsequently ends up in the water through in-adequately sealed domestic landfills. It serves as a typical indicator compound for the presence of oth-er hazardous substances, and high boron concentra-tions in water may be toxic to fish species. Boron is largely used as a bleaching agent in laundry wash-ing products.
Hydrochemistry of the sampled water
The dominant hydrochemical mechanisms that ac-count for the compositional variations of the
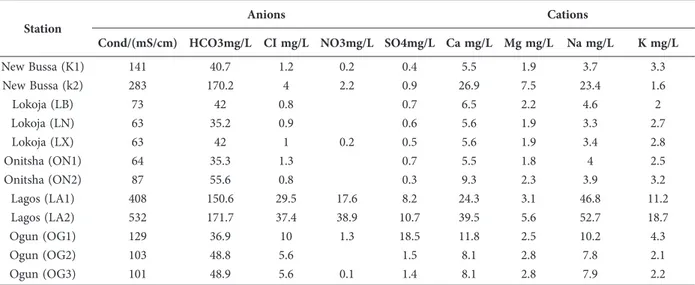
ical profile of the sampled water of the lower Niger Basin and part of the Lagos region shows that ma-jor chemical variations are reflected in the range of conductivity (63–532 µS/cm) with total cations charge (1.6mg/L<∑+<14.31mg/l) and total anions (6mg/L<∑+<14.31mg/l) (Table 3).
Ion concentrations, as measured from the con-ductivity of the sampled water, ranges from 63 to 532 (mS/cm) with an average of 170.58 (mS/cm). Stations with relatively high conductivity include Lagos (LA1, LA2) and New Bussa (K1, K2), and this is due to the presence of more ions and prob-ably indicative of the presence of more pollutants than at the other stations.
The concentrations of major anions and cati-ons in the sampled staticati-ons’ waters were in the fol-lowing order of abundance HCO3 > NO3 > Cl > SO4 and Ca2+ > Na+ > K+ > Mg
2+, respectively. The
only exception is the Lagos stations (LA1 & LA2), where elevated Na+ might be due to seawater
in-trusion along coastal areas, waste deposition, leak-ing landfills and natural saline seeps. The highest concentration of calcium in water is its natural oc-currence in the earth’s crust; it is an important de-terminant of water hardness and functions as a pH stabiliser because of its buffering qualities, as well as improving the water’s taste.
Calcium (Ca2+), sodium (Na+), potassium (K+)
and magnesium (Mg2+) account for about 40.47%,
34.72%, 13.76% and 11.05% of the total cation. The average concentrations of the cations in the sampled water were: calcium (13.06 mg/l), sodium (14.31 mg/l), potassium (7.48 mg/l) and magnesium (2.67
mg/l). the concentration of Ca2+ may reflect the
chemical weathering of silicates and the common occurrence of calcium carbonate (Langmuir 1997). For calcium (Ca2+), the dominant concentrations
ranges from 5.5 to 39.5 mg/l. Sodium (Na+)
con-centration ranges from 3.3 to 52.7 mg/l. Other cat-ions, potassium (K+) and magnesium (Mg
2+) have
ranges of 1.6–18.7 mg/l and 1.8–7.5 mg/l, respec-tively. Potassium occurs in various minerals, from which it may be dissolved through weathering pro-cesses. Sources of potassium include domestic waste landfills and synthetic fertilisers and it is essential-ly an indicator for the presence of other toxic com-pounds in groundwater. Magnesium on the other hand is usually washed from rocks and subsequent-ly ends up in water.
Table 3: Distribution of major anions and cations in the lower Niger River basin and part of the Lagos region
Station Anions Cations
Cond/(mS/cm) HCO3mg/L CI mg/L NO3mg/L SO4mg/L Ca mg/L Mg mg/L Na mg/L K mg/L
New Bussa (K1) 141 40.7 1.2 0.2 0.4 5.5 1.9 3.7 3.3 New Bussa (k2) 283 170.2 4 2.2 0.9 26.9 7.5 23.4 1.6 Lokoja (LB) 73 42 0.8 0.7 6.5 2.2 4.6 2 Lokoja (LN) 63 35.2 0.9 0.6 5.6 1.9 3.3 2.7 Lokoja (LX) 63 42 1 0.2 0.5 5.6 1.9 3.4 2.8 Onitsha (ON1) 64 35.3 1.3 0.7 5.5 1.8 4 2.5 Onitsha (ON2) 87 55.6 0.8 0.3 9.3 2.3 3.9 3.2 Lagos (LA1) 408 150.6 29.5 17.6 8.2 24.3 3.1 46.8 11.2 Lagos (LA2) 532 171.7 37.4 38.9 10.7 39.5 5.6 52.7 18.7 Ogun (OG1) 129 36.9 10 1.3 18.5 11.8 2.5 10.2 4.3 Ogun (OG2) 103 48.8 5.6 1.5 8.1 2.8 7.8 2.1 Ogun (OG3) 101 48.9 5.6 0.1 1.4 8.1 2.8 7.9 2.2
O. Adeaga et al. Quality of water resources in the Niger basin and in the region of Lagos (Nigeria)
Citation: Bulletin of Geography. Physical Geography Series 2017, 13, http://dx.doi.org/10.1515/bgeo-2017-0013 59
Furthermore, the hydrochemical regime of the sampled water with respect to the presence of ions shows that the sampled water type was Ca-bicar-bonate as revealed by the Piper diagram (Fig. 5). It should be noted that bicarbonate water is predomi-nantly within the pH range 6.36–10.25 in fresh wa-ter (Adeaga et al. 2013).
Conclusion
The water resource from the Niger and Benue Ba-sins is moderately contaminated upstream of their confluence excepted for Pb. Downstream of their confluence, and in the vicinity of Lagos, drinking water exceeds the WHO quality standards for Mn and, to a lesser extent, Al. Manganese is neurotox-ic and can provoke Parkinson’s disease (Centeno et al. 2005).
The study has also shown that Cd occasionally displays values that are higher than the European quality standards in surface water (EQS-MA). Arse-nic concentrations are lower than the drinking wa-ter quality standards and are safe for consumption and irrigation. Nevertheless, further analyses would be necessary in water draining other type of rocks in Nigeria (in the northeast and northwest) and also in the Niger delta, where some of the geologic con-ditions that are usually responsible for the geogen-ic contamination of water by arsengeogen-ic are present.
Acknowledgments: this study was funded by the cooperation between the French Embassy in Nige-ria, HSM Laboratory in Montpellier and BFP Ni-ger project (CGIAR Challenge Program on Water and Food).
References
ADEAGA O., MAHÉ G., DIEULIN C., ELBAZ-POU-LICHET F., ROUCHÉ N., SEIDEL J.L., SERVAT E., 2013, Analysis of surface water quality upstream Niger delta system. [in:] Young G., Perillo G.M.E., Aksoy H., Bogen J., Gelfan A., Mahé G., Marsh P., Savenije H., Deltas: landforms, ecosystems and human activ-ities: proceedings of HP1, IAHS-IAPSO- IASPEI as-sembly. Wallingford: AISH, 358: 124-125.
ADELANA S.M.A., OLASEHIND P.I., VRBKA P., 2006, Isotope and geochemical characterization of surface and subsurface waters in the Semi-arid Sokoto basin, Nigeria, African Journal of Science and Technology (AJST) Science and Engineering Series, 4, 2: 80–89. AMADI A. N., YISA J., OGBONNAYA I.C.,
DAN-HAS-SAN, M. A., JACOB J. O., ALKALI Y. B., 2012, Quality Evaluation of River Chanchaga Using Metal Pollution Index and Principal Component Analysis. Journal of Geography and Geology, 4, 2.
ANIMI M., ABBASPOUR K., BERG M., WINKEL L., HUG S.J., HOEHN E., YANG H., JOHNSON C.A., 2008, Statistical Modeling of global geogenic arsenic contamination in groundwater. Environmental Sci-ence and Technology, 42: 3669–3675.
AYENIMO J.G., ADEYINWO C.E., AMOO I.A., ODUKUDU, F., 2005, A preliminary investigation of heavy metals in periwinkles from Warri River, Nige-ria. Journal of Applied Polymer Science, 5, 5: 813–815. BERNER E.K., BERNER R.A., 1987, The global water
cycle: Geochemistry and Environment: Englewood Cliffs, NJ: PrenticeHall, Inc.: 142–155.
BRICKER O.P., JONES B.F., 1995, Main factors affecting the composition of natural waters. [in:] Salbu Ch. 1, B., Steines E. [eds], Trace Metals in Natural Waters, CRC Press: 1–19.
CENTENO J., MULLICK F., ISHAK K., ET AL., 2005, Environmental pathology. [in:] Selimus et al., [eds], Essential of medical Geology, Elsevier: 563–594. EC, 2005, Commission Regulation (EC). 78/2005 of 19
January 2005.
ELBAZ-POULICHET F., GARNIER J.M., GUAN D.M., MARTIN J. M., THOMAS A. J., 1996, The conserv-ative behaviour of trace metals (As, Cd, Cu, Ni and Pb) in the surface plume of stratified estuaries: ex-ample of the Rhone river (France). Estuarine Coastal and Shelf Science, 42: 289–310.
ELBAZ-POULICHET F., SEIDEL J.L., CASIOT C., TUS-SEAU-VILLEMIN M.H., 2006, Short-term variabil-ity of dissolved trace element concentrations in the Marne and Seine Rivers near Paris. Science of the To-tal Environment, 367: 278–287.
GALADIMA A., GARBA Z.N., LEKE L., ALMUSTAPHA M.N., ADAM, I.K., 2011, Domestic Water Pollution among Local Communities in Nigeria; Causes and Consequences. European Journal of Scientific Re-search, 52,4: 592–603.
HUGHES, R.H., HUGHES J.S., 1991, A directory of Af-rican wetlands, IUCN, Gland, Switzerland.
JAJI M.O., BAMGBOSE O., ODUKOYA O.O., AROW-OLO T.A., 2007, Water quality assessment of Ogun River, South West Nigeria. Environmental Monitoring Assessment, 33, 1–3: 473–482. DOI: 10.1007/s10661-006-9602-1.
KAKULU S.E., OSIBANJO O., 1992, Pollution studies of Nigerian rivers: Trace metal levels of surface waters in the Niger Delta. International Journal of Environ-mental Studies, 41: 287–292.
LANGMUIR D.A., 1997, Aqueous Environmental Ge-ochemistry; Prentice-Hall, Upper Saddle River, NJ: 600.
Lee, C.S.L., Li, X.D., Zhang, G., Li, J., Ding, A.J., Wang, T., 2007. Heavy metals and Pb isotopic composition of aerosols in urban and suburban areas of Hong Kong and Guangzhou, South China Evidence of the long-range transport of air contaminants. Environ-mental Pollution, 41, 2: 432–447.
MAHE G., L’HOTE Y., OLIVRY J.C., WOTLING G., 2001, Trends and discontinuities in regional rainfall of west and central Africa – 1951–1989. Hydrological Sciences Journal, 46, 2: 211–226.
MANOJ K., GHOSH S., AND PADHY P.K., 2013, Char-acterization and classification of hydrochemistry using multivariate graphical and hydrostatistical tech-niques, Research Journal of Chemical Sciences, 3, 5: 32–42.
Martin J.M., Guan D.M., Elbaz-Poulichet F., Thomas, A.J., Gordeev, V.V., 1993, Preliminary assessment of the distribution of some trace elements (As, Cd, Cu, Fe, Ni, Pb and Zn) in a pristine aquatic environment: the Lena River estuary (Russia). Marine Chemistry, 43, 1/4: 185–199.
NEAL C., JARVIE H., WHITTON B., GEMMELL J., 2000, The water quality of the River Wear, north-east
England. Science of the Total Environment, 251/252: 153–172.
NIGER-HYCOS, 2006, An information system for water resources assessment and management of the Niger Basin, a Sub-regional component of the WHYCOS Project Document – July 2006.
NRIAGU J., AFEICHE M., LINDER A., AROWOLO T,. ANA G., SRIDHAR M.K., OLORUNTOBA E.O., OBI E., EBENEBE J.C., ORISAKWE O.E., ADESINA A., 2008, Lead poisoning associated with malaria in chil-dren of urban areas of Nigeria. International Journal of Hygiene and Environmental Health, 211: 591–605. OLATUNJI O.S., OSIBANJO O., 2012, Determination of
selected heavy metals in inland fresh water of lower River Niger drainage in North Central Nigeria. Afri-can Journal of Environmental Science and Technolo-gy, 6, 10: 403–408.
ONWUGBUTA-ENYI J., ZABBEY N., ERONDU E.S., 2008, Water Quality of Bodo Creek in the Lower Ni-ger Delta basin. Advances in Environmental Biolo-gy 2, 3: 132–136.
PIPER A.M., 1944, A graphic procedure in the geochem-ical interpretation of water analyses, Transaction of American Geophysical Union, 25: 914–928.
Rabiet M., Togola A., Brissaud F., Seidel J.-L., Budzin-ski H., Elbaz-Poulichet F., 2006, Consequences of treated water recycling as regards pharmaceuticals and drugs in surface and ground waters of a medi-um-sized Mediterranean catchment. Environmental Science and Technology, 40: 5282–5288.
SALOMON W., FORSTNER U., 1984, Metals in the Hy-drocycle. Berlin, Springer: 349.
Received 16 May 2017 Accepted 17 November 2017


![The origin and evolution of a recent agricultural weed: population genetic diversity of weedy populations of sunflower ([i]Helianthus annuus[/i] L.) in Spain and France](data:image/gif;base64,R0lGODlhAQABAIAAAP///wAAACH5BAEAAAAALAAAAAABAAEAAAICRAEAOw==)