HAL Id: hal-01424510
https://hal.archives-ouvertes.fr/hal-01424510
Submitted on 5 Jan 2017HAL is a multi-disciplinary open access archive for the deposit and dissemination of sci-entific research documents, whether they are pub-lished or not. The documents may come from teaching and research institutions in France or abroad, or from public or private research centers.
L’archive ouverte pluridisciplinaire HAL, est destinée au dépôt et à la diffusion de documents scientifiques de niveau recherche, publiés ou non, émanant des établissements d’enseignement et de recherche français ou étrangers, des laboratoires publics ou privés.
Mechanistic Details of Early Steps in Coenzyme Q
Biosynthesis Pathway in Yeast
Laurie-Anne Payet, Mélanie Leroux, John Willison, Akio Kihara, Ludovic
Pelosi, Fabien Pierrel
To cite this version:
Laurie-Anne Payet, Mélanie Leroux, John Willison, Akio Kihara, Ludovic Pelosi, et al.. Mechanistic Details of Early Steps in Coenzyme Q Biosynthesis Pathway in Yeast. Cell Chemical Biology, Cell Press, 2016, 23 (10), pp.1241 - 1250. �10.1016/j.chembiol.2016.08.008�. �hal-01424510�
Mechanistic Details of Early Steps in Coenzyme Q Biosynthesis Pathway in Yeast.
Laurie-Anne Payet1,2,3, Mélanie Leroux3,4†, John C. Willison4, Akio Kihara5, Ludovic Pelosi1,2, Fabien Pierrel1,2*
1 Univ. Grenoble Alpes, Laboratoire Technologies de l’Ingénierie Médicale et de la Complexité – Informatique, Mathématiques et Applications (TIMC-IMAG), F-38000 Grenoble, France. 2 Centre National de Recherche Scientifique (CNRS), TIMC-IMAG, F-38000 Grenoble, France.
3These authors contributed equally to this work
4 CEA-Grenoble, DRF-BIG-CBM, UMR5249, F-38000 Grenoble, France.
5 Faculty of Pharmaceutical Sciences, Hokkaido University, Kita 12-jo, Nishi 6-chome, Kita-ku, Sapporo 060-0812, Japan.
* Correspondence : [email protected]
†
Present address: Centre National de Recherche Scientifique (CNRS) - Univ. Grenoble Alpes, CERMAV, UPR 5301, F-38000 Grenoble, France.
Running title: yeast pathway from tyrosine to coenzyme Q Manuscript 1 2 3 4 5 6 7 8 9 10 11 12 13 14 15 16 17 18 19 20 21 22 23 24 25 26 27 28 29 30 31 32 33 34 35 36 37 38 39 40 41 42 43 44 45 46 47 48 49 50 51 52 53 54 55 56 57 58 59 60 61
SUMMARY
Coenzyme Q (Q) is essential for the bioenergetics of heterotrophic eukaryotic cells. However, some aspects of Q biosynthesis are poorly understood, including how 4-hydroxybenzoic acid (4-HB), the precursor of Q, is made. We show that in the yeast Saccharomyces cerevisiae grown under conditions limiting for para-aminobenzoic acid, most Q originates from the shikimate pathway or from exogenous tyrosine via a common intermediate, 4-hydroxyphenylpyruvate (4-HPP). We characterize two of the steps from tyrosine to 4-HB: the deamination of tyrosine to HPP, which is catalyzed by the Aro8 and Aro9 proteins, and the oxidation of 4-hydroxybenzaldehyde to 4-HB, which is catalyzed by the aldehyde dehydrogenase Hfd1. Inactivation of the hfd1 gene in yeast resulted in Q deficiency, which was rescued by the human enzyme ALDH3A1. This suggests that ALDH3A1 may play a role in Q biosynthesis in humans and is a potential target for mutations in patients with undefined Q deficiency.
1 2 3 4 5 6 7 8 9 10 11 12 13 14 15 16 17 18 19 20 21 22 23 24 25 26 27 28 29 30 31 32 33 34 35 36 37 38 39 40 41 42 43 44 45 46 47 48 49 50 51 52 53 54 55 56 57 58 59 60 61
INTRODUCTION
Heterotrophic eukaryotic cells produce most of their energy via oxidative phosphorylation in mitochondria. The electrochemical gradient used for ATP synthesis is generated by the respiratory chain in which the redox lipid coenzyme Q (Q) transfers electrons between membrane-embedded multiprotein complexes responsible for proton pumping (Genova and Lenaz, 2014; Wang and Hekimi, 2016). Q also functions as a membrane antioxidant and a cofactor of uncoupling proteins (Bentinger et al., 2010). Q is composed of a conserved fully-substituted benzoquinone ring which is attached to a polyisoprenyl tail of various length (six isoprenyl units in Saccharomyces cerevisiae, ten units in humans). The initial reaction of Q biosynthesis is catalyzed by the Coq2 protein (Ashby et al., 1992; Forsgren et al., 2004), which conjugates the polyprenyl-pyrophosphate tail with 4-hydroxybenzoic acid (4-HB), the precursor of the benzoquinone ring of Q (Olson and Rudney, 1983) (Figure S1A). Multiple Coq proteins (Coq3-Coq9 in S. cerevisiae, Figure S1A) localized in the mitochondrial matrix then modify the aromatic ring of prenyl-4-HB in order to yield Q (Tran and Clarke, 2007; Wang and Hekimi, 2012). Abrogation of Q biosynthesis results in the incapacity of S.
cerevisiae to grow on media containing non-fermentable carbon sources (Johnson et al., 2005)
and is embryonically lethal in mammals (Laredj et al., 2014; Wang and Hekimi, 2012). Human primary coenzyme Q deficiency is caused by mutations in nine genes required for Q biosynthesis and results in clinically heterogeneous diseases which are often improved by Q supplementation (Freyer et al., 2015; Quinzii and Hirano, 2011; Salviati et al., 2012). Q is also used as a dietary supplement and ongoing biotechnological efforts aim at improving Q biosynthesis in various microorganisms (Cluis et al., 2011; Lu et al., 2015; Moriyama et al., 2015; Xu et al., 2016).
Although the synthesis of Q from 4-HB is reasonably well understood (Gonzalez-Mariscal et al., 2014; Wang and Hekimi, 2016), the pathway that produces 4-HB in eukaryotes has remained elusive (Kawamukai, 2016). Tracer experiments performed fifty years ago suggested that animals derive 4-HB from tyrosine and phenylalanine (Phe), although Phe may first be converted into tyrosine (Olson, 1966; Olson et al., 1965). Since then, neither enzymes nor intermediates have been assigned to the pathway from tyrosine to 4-HB. Bacteria are known to employ chorismatases like UbiC or XanB2 to synthesize 4-HB from chorismic acid, an intermediate of the shikimate pathway (Siebert et al., 1994; Zhou et al., 2013) which is widespread in microorganisms (Bentley, 1990). The yeast S. cerevisiae possesses the shikimate pathway and is thus believed to synthesize 4-HB from tyrosine and chorismic acid (Clarke, 1 2 3 4 5 6 7 8 9 10 11 12 13 14 15 16 17 18 19 20 21 22 23 24 25 26 27 28 29 30 31 32 33 34 35 36 37 38 39 40 41 42 43 44 45 46 47 48 49 50 51 52 53 54 55 56 57 58 59 60 61
2000) (Figure S1A). However, no homologs of UbiC or XanB2 have been identified in S.
cerevisiae; thus a direct conversion of chorismic acid into 4-HB is hypothetical in this organism
(Figure S1A). A recent study in the plant Arabidopsis thaliana demonstrated that Phe and tyrosine independently contribute to the synthesis of 4-HB, but only the pathway originating from Phe has been partially characterized and shown to involve -oxidation in peroxisomes (Block et al., 2014). Overall, the metabolic pathway from tyrosine to 4-HB appears to be common to eukaryotes, yet it remains uncharacterized to date.
We and others discovered that S. cerevisiae synthesizes Q not only from 4-HB but also from para-aminobenzoic acid (pABA) (Marbois et al., 2010; Pierrel et al., 2010). pABA is a precursor in folate metabolism and is synthesized from chorismic acid via two reactions catalyzed by Abz1 and Abz2 (Figure S1A) (Botet et al., 2007). The use of pABA as a precursor of Q may be restricted to S. cerevisiae since Escherichia coli, A. thaliana and human cells do not incorporate pABA into Q (Block et al., 2014; Xie et al., 2015). pABA is a constituent of the widely used YNB synthetic growth medium and may thereby confer normal Q levels to S.
cerevisiae cells deficient in 4-HB. In the present study, we used YNB culture medium depleted
of pABA to study the pathway from tyrosine to 4-HB. By combining isotopic labelling, chemical analogues supplementation, and forward and reverse genetics, we have elucidated the first and last reactions of this pathway in S. cerevisiae and have identified the associated enzymes.
RESULTS
Tyrosine but not Phe is a precursor of Q in S. cerevisiae
We previously showed that addition of pABA or 4-HB to YNB medium depleted of pABA increased the Q content of S. cerevisiae cells, which demonstrated that endogenously synthesized pABA and 4-HB are limiting for Q biosynthesis (Pierrel et al., 2010). Addition of tyrosine to the growth medium increased the level of Q (Figure S1B), supporting that tyrosine is used as a precursor. Indeed, the mass spectrum of Q from cells grown in the presence of 15N13C
9-tyrosine was consistent with the incorporation of the 6 aromatic carbon atoms of tyrosine into Q (Figure S1C) and 78% of the Q pool was labelled (Figure 1A). In contrast to A.
thaliana (Block et al., 2014), S. cerevisiae did not convert 13C9-Phe to Q (Figure 1A), demonstrating the absence of a pathway from Phe to 4-HB in yeast.
4-HPP is an intermediate in the biosynthesis of 4HB 1 2 3 4 5 6 7 8 9 10 11 12 13 14 15 16 17 18 19 20 21 22 23 24 25 26 27 28 29 30 31 32 33 34 35 36 37 38 39 40 41 42 43 44 45 46 47 48 49 50 51 52 53 54 55 56 57 58 59 60 61
We then evaluated the impact of mutations in the shikimate pathway (Figure S1A). We found that products of the shikimate pathway compete with exogenous 15N13C
9-tyrosine for Q biosynthesis since the labelling of Q increased in Δaro2 and Δtyr1 strains (Figure 1A). Aro8 and Aro9 are two aminotransferases that catalyze the last reaction of the biosynthesis of tyrosine, the conversion of 4-HPP into tyrosine (Figure S1A) (Urrestarazu et al., 1998). We assessed whether Aro8 and Aro9 may catalyze the reverse reaction in vivo, the deamination of tyrosine to 4-HPP. The labelling of Q from 15N13C9-tyrosine diminished drastically in the Δaro8Δaro9 strain compared to WT (Figure 1A), supporting the idea that 4-HPP produced by Aro8 and Aro9 is an intermediate in the biosynthesis of 4-HB. Accordingly, inactivation of both branches of 4-HPP biosynthesis, as in Δaro8Δaro9Δtyr1 and Δaro8Δaro9Δaro2 cells, diminished Q levels (Figure 1B). These results establish that 4-HPP, originating from the shikimate pathway and from the deamination of tyrosine by Aro8 and Aro9, is an intermediate in the production of 4-HB that is used for Q biosynthesis.
The S241L mutation in hfd1 causes Q deficiency in Δaro2 cells
Next, we reasoned that the inactivation of the shikimate pathway together with a disruption of the biosynthesis of 4-HB from exogenous tyrosine should result in Q deficiency. We therefore used the Δaro2 strain in a forward genetic screen with lactate-glycerol (LG) medium, growth on which requires Q. After mutagenesis, we isolated a Δaro2-mutA clone that grew poorly on LG medium unless 4-HB was added (Figure S1D). The Q content of
Δaro2-mutA cells was very low compared to that of Δaro2 cells and was increased by 4-HB but not
by tyrosine (Figure 1C), a result consistent with the inactivation of the tyrosine to 4-HB pathway. Addition of pABA to the growth medium increased Q levels in Δaro2 and
Δaro2-mutA cells (Figure S1E) but to levels slightly lower than those obtained with 4-HB (Figure 1C).
Genetic analysis revealed that the mutation of a single gene caused the phenotype of
Δaro2-mutA cells (see Supplemental Experimental Procedures). In order to identify the defective gene,
the Δaro2-mutA strain was transformed with a S. cerevisiae genomic library and the resulting clones were tested for growth on LG medium. The growth was totally recovered with a plasmid carrying the HFD1 gene whereas plasmids expressing COQ2-MVD1 or ARO2 suppressed only partially the phenotype (Figure 1D). COQ2-MVD1 increased the Q content of Δaro2-mutA cells, whereas ARO2 was without an effect (Figure S1F). DNA sequencing of the HFD1 locus identified a C722T mutation in the Δaro2-mutA strain, causing a S241L mutation in the Hfd1 protein. This result establishes that the HFD1 gene complements the phenotype of the 1 2 3 4 5 6 7 8 9 10 11 12 13 14 15 16 17 18 19 20 21 22 23 24 25 26 27 28 29 30 31 32 33 34 35 36 37 38 39 40 41 42 43 44 45 46 47 48 49 50 51 52 53 54 55 56 57 58 59 60 61
mutA strain, whereas COQ2-MVD1 and ARO2 behave as high copy suppressors, in agreement
with the partial recovery of the respiratory growth (Figure 1D).
Hfd1 belongs to the aldehyde dehydrogenase family (Nakahara et al., 2012) and the importance of S241 for Hfd1 function is supported by its presence within a LELGGKSP sequence that is conserved in several family members (Figure S2A). The LELGGKSP sequence connects the catalytic and NAD binding domains of human ALDH2 and ALDH3A1 (Lang et al., 2012; Parajuli et al., 2014) and we found a similar topology in our homology model of Hfd1 (Figure S2B).
Inactivation of hfd1 results in Q deficiency
Δhfd1 cells were deficient in growth on LG medium unless it was supplemented with 4-HB (Figure 2A). Q levels were decreased ~7 fold in Δhfd1 cells compared to WT and increased strongly with 4-HB but not with tyrosine (Figure 2B). Q levels also increased with addition of pABA (Figure 2B). Expression of Hfd1, but not Hfd1-S241L, restored respiratory growth and the Q content of the Δhfd1 strain (Figures 2A and 2B), confirming the deleterious effect of the S241L mutation. High copy COQ2-MVD1 increased the Q content of Δhfd1 cells, although not to WT levels, whereas ARO2 had no effect (Figure 2C). Only 7% of Q was labelled in Δhfd1 cells grown with 15N13C
9-tyrosine (Figure 2D), showing that exogenous tyrosine cannot efficiently supply Q biosynthesis in Δhfd1 cells contrary to WT cells (Figure 1A).
S. cerevisiae lacks a chorismatase to convert chorismic acid into 4-HB
Δhfd1 cells have a functional shikimate pathway since they are prototrophic for aromatic amino acids (data not shown). Nevertheless, they are deficient in Q (Figure 2B), suggesting that chorismic acid does not supply sufficient 4-HB or pABA for Q biosynthesis (Figure S1A). Indeed, we found that expression of the E. coli UbiC protein, which catalyzes the direct aromatization of chorismic acid into 4-HB, robustly increased Q in WT and Δhfd1 cells, but not in Δaro2Δhfd1 cells that do not produce chorismic acid (Figure 2B). As expected, 15N13C9 -tyrosine did not label Q produced by Δhfd1 + ubiC cells (Figure 2D). These results demonstrate that S. cerevisiae lacks a functional chorismatase enzyme and explain that hfd1 cells are
deficient in Q despite their ability to synthesize chorismic acid.
Endogenous pABA is the predominant precursor of Q in the absence of hfd1
The relative influx of pABA and 4-HB into the Q biosynthetic pathway is revealed in a Δcoq6 strain overexpressing Coq8, which does not synthesize Q but instead accumulates 1 2 3 4 5 6 7 8 9 10 11 12 13 14 15 16 17 18 19 20 21 22 23 24 25 26 27 28 29 30 31 32 33 34 35 36 37 38 39 40 41 42 43 44 45 46 47 48 49 50 51 52 53 54 55 56 57 58 59 60 61
hexaprenyl-4-aminophenol (4-AP) or 3-hexaprenyl-4-hydroxyphenol (4-HP) depending on whether the precursor used is pABA or 4-HB, respectively (Ozeir et al., 2011; Xie et al., 2012). 4-HP decreased in Δcoq6Δhfd1 cells compared to Δcoq6 cells (Figure 2E), reflecting a diminished influx of 4-HB caused by the deletion of hfd1. The major contribution to Q biosynthesis of 4-HB over pABA was restored by expression of HFD1 or ubiC which diminished 4-APand increased 4-HP(Figure 2E). Taken together, our results demonstrate that the inactivation of hfd1 diminishes the pool of 4-HB available for Q biosynthesis whereas that of pABA remains unaffected. We conclude that Hfd1 acts upstream of 4-HB in the metabolic pathway from tyrosine, since E. coli UbiC, which produces 4-HB directly from chorismic acid, increased the levels of both Q (Figure 2B) and 4-HB, as indirectly assessed by measuring 4-HP (Figure 2E). Interestingly, expression of E. coli UbiC was also recently found to increases Q level in Schizosaccharomyces pombe (Moriyama et al., 2015).
Hfd1 oxidizes 4-Hbz to 4-HB
Hfd1 was recently shown to catalyze the oxidation of hexadecanal to hexadecanoic acid as part of the degradation pathway of the sphingoid base dihydrosphingosine (Nakahara et al., 2012), which is converted to hexadecanal by Dpl1 in the endoplasmic reticulum (Kihara, 2014) (Figure S3A). Q levels were normal in Δdpl1 cells (Figure S3B), indicating that dihydrosphingosine degradation is independent from Q biosynthesis. Because of its aldehyde dehydrogenase activity and its partial localization at the mitochondrial outer membrane (Zahedi et al., 2006), we hypothesized that Hfd1 might catalyze the dehydrogenation of 4-Hbz to form 4-HB for mitochondrial Q biosynthesis (Figure S3C). 4-Hbz efficiently increased Q in WT but not in Δhfd1 cells (Figure 3A), showing that the use of 4-Hbz as a precursor of Q requires Hfd1. Dehydrogenation of 4-Hbz or decanal was diminished in cellular extracts from Δhfd1 cells and was increased in Δhfd1+HFD1 (Figures S3D and S3E). The 4-Hbz dehydrogenase activity was mainly associated with the membrane fraction (Figure S3F) and mitochondria from WT or Δhfd1+HFD1 cells showed a robust oxidation of 4-Hbz into 4-HB, unlike those from Δhfd1 cells (Figure 3B). We further verified the capacity of Hfd1 to synthesize 4-HB from 4-Hbz in a heterologous system, the E. coli ΔubiC strain, which is impaired in 4-HB biosynthesis (Siebert et al., 1994). Addition of 4-HB complemented the Q deficiency of the E. coli ΔubiC strain (Figure 3C), whereas efficient complementation by 4-Hbz required the expression of a functional Hfd1 protein (Figure 3C). Finally, we purified Hfd1 fused to the maltose binding protein (Figure S3G). MBP-Hfd1 oxidized benzaldehyde and 4-Hbz (Figure 3D), and preferred 1 2 3 4 5 6 7 8 9 10 11 12 13 14 15 16 17 18 19 20 21 22 23 24 25 26 27 28 29 30 31 32 33 34 35 36 37 38 39 40 41 42 43 44 45 46 47 48 49 50 51 52 53 54 55 56 57 58 59 60 61
NAD to NADP as a co-substrate (Figure S3H). Collectively, these data demonstrate that Hfd1 oxidizes 4-Hbz to 4-HB to supply Q biosynthesis in mitochondria.
4-Hbz is the last intermediate in the Tyr to 4-HB pathway
Next, we quantified 4-Hbz in yeast cellular extracts and found an increase upon addition of tyrosine to the culture medium (Figure S3I). 15N13C9-tyrosine yielded a +7 m/z increment in 4-Hbz, demonstrating that all carbon atoms of 4-Hbz were labelled (Figure S3J). The labelling of the 4-Hbz pool was comparable in WT and Δhfd1 cells but decreased in Δaro8Δaro9 cells (Figure 3E). Together, these results establish that 4-Hbz is located downstream of 4-HPP in the pathway that converts tyrosine into 4-HB.
Human ALDH3A1 oxidizes 4-Hbz to 4-HB in S. cerevisiae
Humans possess 19 aldehyde dehydrogenases (Jackson et al., 2011) and a phylogenetic analysis revealed that Hfd1 clustered with the four members of subfamily 3 (Figure S4). Since the defect of Δhfd1 cells in dihydrosphingosine degradation was complemented by human
ALDH3A2 and ALDH3B1 (Kitamura et al., 2013), it was of interest to verify if any of the four
members of subfamily 3 may oxidize 4-Hbz to 4-HB. All four proteins were expressed at similar levels in yeast Δhfd1 cells (Kitamura et al., 2013) (Figure 4A), but only extracts containing ALDH3A1 oxidized 4-Hbz in vitro (Figure 4A). ALDH3A1 increased Q levels in Δhfd1 cells when 4-Hbz was added to the culture medium (Figure 4B), showing the ability of ALDH3A1 to oxidize 4-Hbz to 4-HB in vivo.
DISCUSSION
Hfd1 fulfills two independent functions in sphingolipid and Q metabolisms
Our results demonstrate that Hfd1 is required for coenzyme Q biosynthesis by oxidizing 4-Hbz to 4-HB. Hfd1 was also shown to oxidize aliphatic aldehydes like hexadecanal, an intermediate in a degradation pathway of the sphingoid base dihydrosphingosine (Nakahara et al., 2012). We believe that the defects of Δhfd1 cells in sphingolipid and Q metabolisms are independent. Indeed, Δdpl1 cells which cannot degrade dihydrosphingosine (Nakahara et al., 2012) have a normal Q content (Figure S3B), showing that a disruption of the degradation pathway of dihydrosphingosine does not perturb Q biosynthesis. Furthermore, human ALDH3A2 and ALDH3B1 complemented the hexadecenal dehydrogenase defect of Δhfd1 cells (Kitamura et al., 2013) but did not restore Q biosynthesis (Figure 4B), whereas ALDH3A1 1 2 3 4 5 6 7 8 9 10 11 12 13 14 15 16 17 18 19 20 21 22 23 24 25 26 27 28 29 30 31 32 33 34 35 36 37 38 39 40 41 42 43 44 45 46 47 48 49 50 51 52 53 54 55 56 57 58 59 60 61
complemented the Q defect (Figure 4B) but not the dihydrosphingosine degradation defect (Kitamura et al., 2013), demonstrating the independence of both cellular processes. Human ALDH3A1 and ALDH3A2 may have evolved restricted substrate specificities compared to Hfd1 which combines dehydrogenase activities on aliphatic aldehydes like hexadecenal and aromatic aldehydes like 4-Hbz. Hfd1 is dually localized in the endoplasmic reticulum and in mitochondria (Zahedi et al., 2006) and each pool may specifically contribute to a particular metabolism since hexadecanal is synthesized by Dpl1 in the ER whereas Q biosynthesis occurs in mitochondria (Ikeda et al., 2004; Tran and Clarke, 2007)(Figure 5).
The supply of aromatic precursors for Q biosynthesis in S. cerevisiae
S. cerevisiae utilises 4-HB and pABA as aromatic precursors of Q (Marbois et al., 2010;
Pierrel et al., 2010), yet their endogenous levels are limiting for Q biosynthesis since addition of either molecule to pABA-depleted growth medium increased the Q content of WT cells (Pierrel et al., 2010). Thus, the use of pABA-depleted medium was a prerequisite for the success of our forward genetic approach which revealed the requirement of Hfd1 for Q biosynthesis. Inactivation of hfd1 diminished the influx of 4-HB but not pABA into Q biosynthesis (Figure 2E), but the endogenous pABA pool was insufficient to compensate the shortage of 4-HB since we showed that Δhfd1 cells were profoundly deficient in Q (Figure 3A). Endogenous pABA may thus be predominantly used for folate biosynthesis (Figure S1A). We observed a partial restoration of Q levels in Δhfd1 cells overexpressing COQ2-MVD1 (Figure 2C). Therefore, we think that endogenous pools of pABA and 4-HB may be more efficiently redirected towards Q biosynthesis upon overexpression of the 4-HB/pABA polyprenyltransferase Coq2. Altogether, we conclude that WT cells use 4-HB as the main precursor of Q under our growth conditions and that 4-HB is synthesized from the shikimate pathway and from exogenous tyrosine via a common intermediate, 4-HPP (Figure 5). Inactivation of either branch of 4-HPP synthesis maintained, and even increased Q levels in the case of Δtyr1 cells (Figure 1), reflecting compensatory mechanisms that might be linked to the extensive regulation of the shikimate pathway (Braus, 1991).
The pathway from tyrosine to 4-HB and its potential conservation in higher eukaryotes Altogether, our results reveal several steps of the metabolic pathway from tyrosine to 4-HB and establish 4-HPP and 4-Hbz as the first and last intermediates, respectively. How the side chain of 4-HPP is shortened remains to be elucidated. However, contrary to what was previously hypothesized (Clarke, 2000; Turunen et al., 2004), β-oxidation is probably not 1 2 3 4 5 6 7 8 9 10 11 12 13 14 15 16 17 18 19 20 21 22 23 24 25 26 27 28 29 30 31 32 33 34 35 36 37 38 39 40 41 42 43 44 45 46 47 48 49 50 51 52 53 54 55 56 57 58 59 60 61
involved, since it would form directly 4-HB but not 4-Hbz (Figure 5) (Widhalm and Dudareva, 2015), whereas we have demonstrated that Q biosynthesis requires the oxidation of 4-Hbz by Hfd1. The hydration of 4-coumaric acid and a subsequent retro-aldol reaction to yield 4-Hbz is a more likely scenario for the shortening of the side chain (Clarke, 2000) (Figure 5) since S.
cerevisiae was recently shown to incorporate 4-coumaric acid into Q, although not efficiently
(Xie et al., 2015).
About half of 4-HB used for Q biosynthesis in the plant A. thaliana originates from tyrosine through an unknown metabolic pathway (Block et al., 2014). The final reaction may be the oxidation of 4-Hbz since aromatic aldehyde dehydrogenase activities with broad substrate specificities were reported in developing seeds of A. thaliana and in hairy roots of
Daucus carota (Ibdah et al., 2009; Sircar et al., 2011). Tyrosine also supports Q biosynthesis
in animals (Olson, 1966) and it will be important to verify whether mammalian 4-HB biosynthesis shares similarities with the yeast pathway. Tyrosine aminotransferase (TAT) catalyzes the deamination of tyrosine in the liver and is mutated in tyrosinemia type II (Dietrich, 1992; Scott, 2006). Measurements of Q levels in patients will indicate if TAT is required for Q biosynthesis. Animals may also rely on the oxidation of 4-Hbz to generate 4-HB because radiolabelled 4-Hbz was incorporated into Q when injected to rats (Ranganathan and Ramasarma, 1975) and when added to rat kidneys in vitro (Parson and Rudney, 1964). Since a deficit in 4-HB biosynthesis is expected to cause Q deficiency, our work calls for patients with genetically unassigned Q deficiency to be screened for mutations in aldehyde dehydrogenase genes, especially ALDH3A1.
SIGNIFICANCE
Coenzyme Q is a redox lipid that is central for energetic metabolism of eukaryotes. The biosynthesis of Q from the aromatic precursor 4-hydroxybenzoic acid (4-HB) is conserved and requires multiple catalytic reactions and associated proteins. Mutations in corresponding genes cause primary coenzyme Q deficiencies and result in various severe human diseases which are often improved by coenzyme Q supplementation. However, the hydrophobicity of coenzyme Q and therefore its poor bioavailability is thought to limit the efficiency of the treatment. In eukaryotes, biosynthesis of 4-HB from tyrosine has been suspected for forty years, yet, the pathway from tyrosine to 4-HB has remained elusive to date. We partially solved the long-standing problem of the biosynthesis of the aromatic precursor of coenzyme Q by providing a molecular understanding of the first and last reactions of the pathway in the yeast S. cerevisiae, namely the deamination of tyrosine to 4-hydroxyphenylpyruvate by Aro8 and Aro9 and the 1 2 3 4 5 6 7 8 9 10 11 12 13 14 15 16 17 18 19 20 21 22 23 24 25 26 27 28 29 30 31 32 33 34 35 36 37 38 39 40 41 42 43 44 45 46 47 48 49 50 51 52 53 54 55 56 57 58 59 60 61
oxidation of 4-hydroxybenzaldehyde to 4-HB by Hfd1. Whereas part of 4-HB is also provided by the shikimate pathway in S. cerevisiae, the importance of the tyrosine to 4-HB pathway for Q biosynthesis is likely to be more preponderant in higher eukaryotes which lack the shikimate pathway. We found that inactivation of hfd1 resulted in coenzyme Q deficiency which was efficiently complemented by the addition of exogenous 4-HB. Our demonstration that human ALDH3A1 is able to oxidize 4-hydroxybenzaldehyde to 4-HB represent the first stage in assessing the conservation of the tyrosine to 4-HB pathway from yeast to humans. Mutations in genes of the tyrosine to 4-HB pathway may lead to coenzyme Q deficiencies in humans. In such cases, Q levels might be restored in patients by supplementation with 4-HB, a hydrophilic compound that might prove more bioavailable than exogenous Q which is normally used to treat coenzyme Q deficiencies.
EXPERIMENTAL PROCEDURES
Plasmids and strains. Plasmids and strains used in this study are detailed in Supplemental Information.
Yeast culture conditions. Yeast strains were grown at 30 °C and 200 rpm shaking in YPD (1% (w/v) yeast extract, 2% (w/v) peptone and 2% (w/v) glucose) or in YNB-p (YNB without pABA and without folate, MP Biomedicals) supplemented with 10 mg/L folate, 10 µM FeCl3, 2% (w/v) carbon source (glucose, galactose or lactate-glycerol (LG)) and nutrients to cover the strains auxotrophies in quantities described in (Sherman, 2002). We note that exogenously added folate is unlikely to be imported in yeast (Nguyen and Clarke, 2012). When necessary, aromatic amino acids were added at a final concentration of 20 mg/L for tryptophane, 50 mg/L for phenylalanine and 15-60 mg/L for tyrosine as indicated (Sherman, 2002). For labelling experiments, 30 mg/L 15N13C9-tyrosine or 50 mg/L 13C9-phenylalanine were added in replacement of the unlabelled amino acid. Only L-isomers of amino acids were used. YNB-p 2% galactose liquid cultures were performed by inoculating fresh medium with an aliquot of a 24 h culture grown in YNB-p 2% galactose 0.2% glucose. Bacto-agar (Euromedex) was added at 1.6% (w/v) for solid media.
Analysis of coenzyme Q content. Yeast cells were grown to OD600 = 1 in YNB-p galactose medium unless otherwise stated and cooled down on ice prior to collection by centrifugation and determination of the cells wet weight (Ozeir et al., 2015). Lipid extraction and Q analysis by HPLC-electrochemical detection (ECD) including MS detection or not was performed as previously described (Ozeir et al., 2015). Total Q was calculated from the ECD signal, unlabelled-Q and labelled 13C6-Q were quantified by integrating the peaks obtained at the
1 2 3 4 5 6 7 8 9 10 11 12 13 14 15 16 17 18 19 20 21 22 23 24 25 26 27 28 29 30 31 32 33 34 35 36 37 38 39 40 41 42 43 44 45 46 47 48 49 50 51 52 53 54 55 56 57 58 59 60 61
retention time of Q for the positive ions m/z 591.2 and 597.2, respectively. E. coli cells grown overnight in M9 medium containing 100 µg/mL ampicillin for plasmid selection as needed, were inoculated at OD600 = 0.05 in M9 medium containing 30 µM isopropyl β-D-1-thiogalactopyranoside (IPTG) and supplemented or not with 4-HB or 4-Hbz. Cells were grown at 37 °C, 200 rpm shaking until OD600 = 0.8 and analyzed for Q content by HPLC-ECD as previously described (Aussel et al., 2014).
4-Hbz dehydrogenase activity assays. For yeast extract activity assays, cell pellets (10 mL of yeast culture collected at OD600 = 1) were resuspended in 1 mL PIPES 100 mM pH 7.1 with 2 pellet-volumes of glass beads and vortexed during 10 min. Cell homogenates were pipetted to eliminate the glass beads and centrifuged at 15,000 rpm, 4 °C during 5 min; resulting supernatants, corresponding to soluble fractions were collected, and pellets, corresponding to membrane fractions were resuspended in 500 µL PIPES 100 mM pH 7.1. Cell homogenates collected prior to centrifugation corresponded to total extracts. Protein content was measured by the BCA method. 20 µL of each fraction was assayed for 4-Hbz dehydrogenase activity by incubation at 30 °C for 1 h in a total volume of 100 µL PIPES 50 mM pH 7.1, 500 µM NAD+, 100 µM 4-Hbz . Mitochondrial fractions (20 µL in PIPES 100 mM pH 7.1 mannitol 1.2 M, protein concentration ~1.5 µg/µL) were assayed similarly except that the assay buffer contained 0.6 M mannitol. The reaction was stopped by adding 2 µL pure formic acid. 4-HB and 4-Hbz were extracted as described elsewhere (Villas-Bôas et al., 2005). Briefly, 500 µL cold methanol was added to samples together with 10 µL of 10 µM vanillic acid (VA) used as an internal standard. The mixture was frozen in liquid nitrogen, stored if necessary at -80 °C, then thawed on ice and centrifuged at 770 g during 20 min at 4 °C. The supernatant was collected and evaporated under nitrogen at 60 °C. Samples were resuspended in water containing 0.25% (v/v) acetic acid and analyzed by HPLC (U3000 Dionex) on a NUCLEODUR® PFP column (Macherey-Nagel, 3 µm, 2 x 150 mm). Two mobile phases were used for elution at a flow rate of 0.25 mL/min: 0.25% (v/v) acetic acid in water (A) and methanol (B). The linear gradient profile was 0-2 min, 5% B; 2-12 min, 5-30% B; 12-18 min, 30% B; 18-20 min, 30-5% B; 20-24 min, 5% B. 4-HB, VA and 4-Hbz were detected by a diode array detector which recorded the absorbance at 260 nm (4-HB and VA) and 290 nm (4-Hbz). The recovery of VA was typically 75% and was used to correct 4-HB values for loss during extraction.
Mitochondrial preparation and Western blotting. Purification of mitochondria and immunodetection were conducted as described previously (Ozeir et al., 2015). Monoclonal anti-Flag M2 antibody (F1804, Sigma, dilution 1/3,000) and polyclonal anti-Anc2 antibody (dilution 1 2 3 4 5 6 7 8 9 10 11 12 13 14 15 16 17 18 19 20 21 22 23 24 25 26 27 28 29 30 31 32 33 34 35 36 37 38 39 40 41 42 43 44 45 46 47 48 49 50 51 52 53 54 55 56 57 58 59 60 61
1/1,500) were detected with HRP-coupled anti-mouse IgG and HRP-coupled protein A, respectively.
Extraction and GC-MS analysis of 4-Hbz. Cells were cultured until OD600 ~ 2 in 50 mL YNB-p galactose suYNB-pYNB-plemented or not with aromatic amino acids and 30 mg/L 15N13C9-tyrosine, transferred into precooled 50 mL falcon tubes, and centrifuged for 1 min at 4,000 rpm, 4 °C. The cell pellet was resuspended in 10 mL ice cold PBS and centrifugation was repeated. The supernatant was eliminated and the cells were vortexed in 5 mL acetonitrile/methanol/water (2/2/1, v/v) precooled at -20 °C. The suspension was stored at -80 °C until further use. The suspension was then allowed to thaw at room temperature for 30 min and was centrifuged for 2 min at 4,000 rpm, 20 °C. The supernatant was transferred into a 50 mL falcon tube using Pasteur pipette and was supplemented with 5 mL water, 1% (v/v) acetic acid, 2 g NaCl, and 100 ng VA as an extraction standard. The mixture was homogenized by vortexing, 10 mL ethyl acetate was added and vortex was repeated. After phase separation, the upper ethyl acetate phase was taken and the extraction was repeated with 10 mL ethyl acetate. The ethyl acetate phases were combined and dried in a water bath at 37 °C under a stream of nitrogen. The sample was dissolved in 1.2 mL ethanol and centrifuged for 2 min at 13,000 rpm at room temperature. The resulting supernatant was transferred to Eppendorf tubes, dried under nitrogen and stored at -80 °C. On the day of the analysis, samples were dissolved in 50 µL of O-methoxyamine-HCl (20 mg/mL in pyridine) and incubated at 60 °C for 30 min; 50 µL of BSTFA-TMCS (99:1, Macherey Nagel) was then added and samples were further incubated at 60 °C for 30 min. Samples were centrifuged at 13,000 rpm for 1 min. Derivatized samples were analysed by Gas Chromatography-Mass Spectrometry (GC-MS) using an Agilent 5973 Mass Selective Detector coupled to an HP6890 GC system equipped with an Optima-17-MS capillary column (30 m x 0.25 mm x 0.25 µm; Macherey-Nagel). The carrier gas was helium and the injection volume was 2.5 µl with an inlet temperature of 250 °C, with a split ratio of 50:1 for full scan detection and 20:1 for SIM, at an inlet temperature of 250 °C. The initial oven temperature was 75 °C for 3 min, then increased to 250 °C at a rate of 12 °C/min, held for 1 min then increased to 300 °C at 10 °C/min and held for 5 min. The MSD transfer line heater, MS source and MS quad temperatures were set at 280 °C, 230 °C and 150 °C, respectively. The mass range used for full scan detection of 4-Hbz was m/z 204-234 with an abundance threshold set at 150. The mass ions and windows used for SIM were as follows: 4Hbz, 208 (M+-CH3), 215 (13C7M+-CH3), 223 (M+), 230 (13C7M+) from 5 to 12 min; VA, 223 (M+-CH3-TMS-H), 253 (M+-Si(CH3)2-H), 267 (M+-(CH3)3) and 297 (M+-CH3) from 12 min to 15 min. Standards containing 20 ng VA and 4-Hbz were analyzed in similar conditions and used for quantification. Sample loss during 1 2 3 4 5 6 7 8 9 10 11 12 13 14 15 16 17 18 19 20 21 22 23 24 25 26 27 28 29 30 31 32 33 34 35 36 37 38 39 40 41 42 43 44 45 46 47 48 49 50 51 52 53 54 55 56 57 58 59 60 61
extraction was corrected by calculating the recovery of VA in the different samples (typically 80-95%) and quantities of 4-Hbz were normalized to OD values of the harvested cells. Labelling of 4-Hbz was calculated by averaging the ratios of the abundance of the unlabelled/labelled ion pairs 208/215 and 223/230.
Bioinformatics methods. Sequence alignments were generated with Clustal Omega (http://www.ebi.ac.uk/Tools/msa/clustalo/). The homology model of Hfd1 was constructed with Phyre2 (Kelley et al., 2015) used in intensive mode. The program selected the aldehyde dehydrogenase 3A1 from Rattus norvegicus (PDB code 1AD3) as template. For the phylogenetic analysis, the protein sequences were retrived from NCBI and were aligned using the MUSCLE software (http://www.ebi.ac.uk/Tools/msa/muscle/). The resulting sequence alignment file was then processed with the latest version of the PHYLIP package (http://evolution.genetics.washington.edu/phylip), which comprises the PROTDIST program to compute a matrix distance and the DRAWGRAM program to plot the phylogenetic tree constructed with the Neighbor-Joining method.
Statistical methods. Results are presented as mean ± s.e.m. Data sets were compared by unpaired two-tailed t-test or an analysis of variance (ANOVA) using GraphPad Prism 6 software.
SUPPLEMENTAL INFORMATION
Supplemental Information includes Supplemental Experimental Procedures and four figures.
AUTHOR CONTRIBUTIONS
L.-A.P., M.L, L.P., J.C.W. and F.P. designed research, performed experiments, analyzed and interpreted the data; A.K. contributed reagents; F.P. supervised the project and wrote the manuscript; all authors discussed the results and commented on the manuscript.
ACKNOWLEDGMENTS
We thank Laurent Loiseau for constructing the pBADKI-UBIC vector, Dr Joël Gaffé for assistance with the phylogenetic analysis, Dr Pavel Sindelar, Dr Vassilis Vassiliou and Ulrika Forsman for discussions. This work was supported by the Fondation pour la Recherche Médicale (FRM), grant number «DPM20121125553» to F. Pierrel.
1 2 3 4 5 6 7 8 9 10 11 12 13 14 15 16 17 18 19 20 21 22 23 24 25 26 27 28 29 30 31 32 33 34 35 36 37 38 39 40 41 42 43 44 45 46 47 48 49 50 51 52 53 54 55 56 57 58 59 60 61
REFERENCES
Ashby, M.N., Kutsunai, S.Y., Ackerman, S., Tzagoloff, A., and Edwards, P.A. (1992). COQ2 is a candidate for the structural gene encoding para-hydroxybenzoate:polyprenyltransferase. J. Biol. Chem. 267, 4128-4136.
Aussel, L., Loiseau, L., Hajj Chehade, M., Pocachard, B., Fontecave, M., Pierrel, F., and Barras, F. (2014). ubiJ, a New Gene Required for Aerobic Growth and Proliferation in Macrophage, Is Involved in Coenzyme Q Biosynthesis in Escherichia coli and Salmonella enterica Serovar Typhimurium. J. Bacteriol. 196, 70-79.
Bentinger, M., Tekle, M., and Dallner, G. (2010). Coenzyme Q-biosynthesis and functions. Biochem. Biophys. Res. Commun. 396, 74-79.
Bentley, R. (1990). The shikimate pathway--a metabolic tree with many branches. Crit. Rev. Biochem. Mol. Biol. 25, 307-384.
Block, A., Widhalm, J.R., Fatihi, A., Cahoon, R.E., Wamboldt, Y., Elowsky, C., Mackenzie, S.A., Cahoon, E.B., Chapple, C., Dudareva, N., et al. (2014). The Origin and Biosynthesis of the Benzenoid Moiety of Ubiquinone (Coenzyme Q) in Arabidopsis. Plant Cell 26, 1938-1948.
Botet, J., Mateos, L., Revuelta, J.L., and Santos, M.A. (2007). A chemogenomic screening of sulfanilamide-hypersensitive Saccharomyces cerevisiae mutants uncovers ABZ2, the gene encoding a fungal aminodeoxychorismate lyase. Eukaryot Cell 6, 2102-2111.
Braus, G.H. (1991). Aromatic amino-acid biosynthesis in the yeast Saccharomyces cerevisiae: a model system for the regulation of a eukaryotic biosynthetic pathway. Microbiological Reviews 55, 349-370.
Clarke, C.F. (2000). New advances in coenzyme Q biosynthesis. Protoplasma 213, 134-147. Cluis, C.P., Ekins, A., Narcross, L., Jiang, H., Gold, N.D., Burja, A.M., and Martin, V.J. (2011). Identification of bottlenecks in Escherichia coli engineered for the production of CoQ(10). Metab. Eng., in press.
Dietrich, J.B. (1992). Tyrosine aminotransferase: a transaminase among others. Cell. Mol. Biol. 38, 95-114.
Forsgren, M., Attersand, A., Lake, S., Grunler, J., Swiezewska, E., Dallner, G., and Climent, I. (2004). Isolation and functional expression of human COQ2, a gene encoding a polyprenyl transferase involved in the synthesis of CoQ. Biochem. J. 382, 519-526.
Freyer, C., Stranneheim, H., Naess, K., Mourier, A., Felser, A., Maffezzini, C., Lesko, N., Bruhn, H., Engvall, M., Wibom, R., et al. (2015). Rescue of primary ubiquinone deficiency due to a novel COQ7 defect using 2,4-dihydroxybensoic acid. J Med Genet.
Genova, M.L., and Lenaz, G. (2014). Functional role of mitochondrial respiratory supercomplexes. Biochim. Biophys. Acta 1837, 427-443.
Gonzalez-Mariscal, I., Garcia-Teston, E., Padilla, S., Martin-Montalvo, A., Pomares-Viciana, T., Vazquez-Fonseca, L., Gandolfo-Dominguez, P., and Santos-Ocana, C. (2014). Regulation of coenzyme Q biosynthesis in yeast: A new complex in the block. IUBMB Life 66, 63-70. Ibdah, M., Chen, Y.T., Wilkerson, C.G., and Pichersky, E. (2009). An Aldehyde Oxidase in Developing Seeds of Arabidopsis Converts Benzaldehyde to Benzoic Acid. Plant Physiol.
150, 416-423.
Ikeda, M., Kihara, A., and Igarashi, Y. (2004). Sphingosine-1-phosphate lyase SPL is an endoplasmic reticulum-resident, integral membrane protein with the pyridoxal 5 '-phosphate binding domain exposed to the cytosol. Biochem. Biophys. Res. Commun. 325, 338-343. Jackson, B., Brocker, C., Thompson, D.C., Black, W., Vasiliou, K., Nebert, D.W., and Vasiliou, V. (2011). Update on the aldehyde dehydrogenase gene (ALDH) superfamily. Human genomics 5, 283-303. 1 2 3 4 5 6 7 8 9 10 11 12 13 14 15 16 17 18 19 20 21 22 23 24 25 26 27 28 29 30 31 32 33 34 35 36 37 38 39 40 41 42 43 44 45 46 47 48 49 50 51 52 53 54 55 56 57 58 59 60 61
Johnson, A., Gin, P., Marbois, B.N., Hsieh, E.J., Wu, M., Barros, M.H., Clarke, C.F., and Tzagoloff, A. (2005). COQ9, a new gene required for the biosynthesis of coenzyme Q in
Saccharomyces cerevisiae. J. Biol. Chem. 280, 31397-31404.
Kawamukai, M. (2016). Biosynthesis of coenzyme Q in eukaryotes. Bioscience Biotechnology and Biochemistry 80, 23-33.
Kelley, L.A., Mezulis, S., Yates, C.M., Wass, M.N., and Sternberg, M.J. (2015). The Phyre2 web portal for protein modeling, prediction and analysis. Nat. Protoc. 10, 845-858.
Kihara, A. (2014). Sphingosine 1-phosphate is a key metabolite linking sphingolipids to glycerophospholipids. Biochim. Biophys. Acta 1841, 766-772.
Kitamura, T., Naganuma, T., Abe, K., Nakahara, K., Ohno, Y., and Kihara, A. (2013). Substrate specificity, plasma membrane localization, and lipid modification of the aldehyde dehydrogenase ALDH3B1. Biochim. Biophys. Acta 1831, 1395-1401.
Lang, B.S., Gorren, A.C., Oberdorfer, G., Wenzl, M.V., Furdui, C.M., Poole, L.B., Mayer, B., and Gruber, K. (2012). Vascular bioactivation of nitroglycerin by aldehyde dehydrogenase-2: reaction intermediates revealed by crystallography and mass spectrometry. J. Biol. Chem.
287, 38124-38134.
Laredj, L.N., Licitra, F., and Puccio, H.M. (2014). The molecular genetics of coenzyme Q biosynthesis in health and disease. Biochimie 100, 78-87.
Lu, W., Ye, L., Lv, X., Xie, W., Gu, J., Chen, Z., Zhu, Y., Li, A., and Yu, H. (2015).
Identification and elimination of metabolic bottlenecks in the quinone modification pathway for enhanced coenzyme Q production in Rhodobacter sphaeroides. Metab. Eng.
Marbois, B., Xie, L.X., Choi, S., Hirano, K., Hyman, K., and Clarke, C.F. (2010). para-aminobenzoic acid is a precursor in coenzyme Q(6) biosynthesis in Saccharomyces
cerevisiae. J. Biol. Chem. 285, 27827-27838.
Moriyama, D., Hosono, K., Fujii, M., Washida, M., Nanba, H., Kaino, T., and Kawamukai, M. (2015). Production of CoQ10 in fission yeast by expression of genes responsible for CoQ10 biosynthesis. Biosci. Biotechnol. Biochem. 79, 1026-1033.
Nakahara, K., Ohkuni, A., Kitamura, T., Abe, K., Naganuma, T., Ohno, Y., Zoeller, R.A., and Kihara, A. (2012). The Sjogren-Larsson syndrome gene encodes a hexadecenal
dehydrogenase of the sphingosine 1-phosphate degradation pathway. Mol. Cell 46, 461-471. Nguyen, T.P., and Clarke, C.F. (2012). Folate status of gut microbiome affects Caenorhabditis elegans lifespan. BMC Biol 10, 66.
Olson, R.E. (1966). Biosynthesis of ubiquinones in animals. Vitam Horm 24, 551-574. Olson, R.E., Dialameh, G.H., Bentley, R., Springer, C.M., and Ramsey, V.G. (1965). Studies on coenzyme Q - Pattern of labeling in coenzyme Q9 after adminstration of isotopic acetate and aromatic amino acids to rats. J. Biol. Chem. 240, 514-&.
Olson, R.E., and Rudney, H. (1983). Biosynthesis of ubiquinone. Vitam. Horm. 40, 1-43. Ozeir, M., Muhlenhoff, U., Webert, H., Lill, R., Fontecave, M., and Pierrel, F. (2011). Coenzyme Q biosynthesis: Coq6 Is required for the C5-hydroxylation reaction and substrate analogs rescue Coq6 deficiency. Chem. Biol. 18, 1134-1142.
Ozeir, M., Pelosi, L., Ismail, A., Mellot-Draznieks, C., Fontecave, M., and Pierrel, F. (2015). Coq6 Is Responsible for the C4-deamination Reaction in Coenzyme Q Biosynthesis in Saccharomyces cerevisiae. J. Biol. Chem. 290, 24140-24151.
Parajuli, B., Fishel, M.L., and Hurley, T.D. (2014). Selective ALDH3A1 inhibition by benzimidazole analogues increase mafosfamide sensitivity in cancer cells. J. Med. Chem. 57, 449-461.
Parson, W.W., and Rudney, H. (1964). Biosynthesis of benzoquinone ring of ubiquinone from p-hydroxybenzaldehyde + p-hydroxybenzoic acid in rat kidney azotobacter vinelandii + bakers yeast. Proc. Natl. Acad. Sci. U. S. A. 51, 444-450.
1 2 3 4 5 6 7 8 9 10 11 12 13 14 15 16 17 18 19 20 21 22 23 24 25 26 27 28 29 30 31 32 33 34 35 36 37 38 39 40 41 42 43 44 45 46 47 48 49 50 51 52 53 54 55 56 57 58 59 60 61
Pierrel, F., Hamelin, O., Douki, T., Kieffer-Jaquinod, S., Muhlenhoff, U., Ozeir, M., Lill, R., and Fontecave, M. (2010). Involvement of mitochondrial ferredoxin and para-aminobenzoic acid in yeast coenzyme Q biosynthesis. Chem. Biol. 17, 449-459.
Quinzii, C.M., and Hirano, M. (2011). Primary and secondary CoQ(10) deficiencies in humans. BioFactors 37, 361-365.
Ranganathan, S., and Ramasarma, T. (1975). Regulation of biosynthesis of ubiquinone in rat. Biochem. J. 148, 35-39.
Salviati, L., Trevisson, E., Rodriguez Hernandez, M.A., Casarin, A., Pertegato, V., Doimo, M., Cassina, M., Agosto, C., Desbats, M.A., Sartori, G., et al. (2012). Haploinsufficiency of
COQ4 causes coenzyme Q10 deficiency. J Med Genet 49, 187-191.
Scott, C.R. (2006). The genetic tyrosinemias. Am J Med Genet C Semin Med Genet 142C, 121-126.
Sherman, F. (2002). Getting started with yeast. Methods Enzymol. 350, 3-41. Siebert, M., Severin, K., and Heide, L. (1994). Formation of 4-hydroxybenzoate in Escherichia coli: characterization of the ubiC gene and its encoded enzyme chorismate pyruvate-lyase. Microbiology 140 ( Pt 4), 897-904.
Sircar, D., Mukherjee, C., Beuerle, T., Beerhues, L., and Mitra, A. (2011). Characterization of p-hydroxybenzaldehyde dehydrogenase, the final enzyme of p-hydroxybenzoic acid
biosynthesis in hairy roots of Daucus carota. Acta Physiologiae Plantarum 33, 2019-2024. Tran, U.C., and Clarke, C.F. (2007). Endogenous synthesis of coenzyme Q in eukaryotes. Mitochondrion 7, S62-71.
Turunen, M., Olsson, J., and Dallner, G. (2004). Metabolism and function of coenzyme Q. Biochim. Biophys. Acta 1660, 171-199.
Urrestarazu, A., Vissers, S., Iraqui, I., and Grenson, M. (1998). Phenylalanine- and tyrosine-auxotrophic mutants of Saccharomyces cerevisiae impaired in transamination. Mol Gen Genet
257, 230-237.
Villas-Bôas, S.G., Højer-Pedersen, J., Akesson, M., Smedsgaard, J., and Nielsen, J. (2005). Global metabolite analysis of yeast: evaluation of sample preparation methods. Yeast 22, 1155-1169.
Wang, Y., and Hekimi, S. (2012). Molecular genetics of ubiquinone biosynthesis in animals. Crit. Rev. Biochem. Mol. Biol.
Wang, Y., and Hekimi, S. (2016). Understanding Ubiquinone. Trends in Cell Biology 26, 367-378.
Widhalm, J.R., and Dudareva, N. (2015). A Familiar Ring to It: Biosynthesis of Plant Benzoic Acids. Molecular Plant 8, 83-97.
Xie, L.X., Ozeir, M., Tang, J.Y., Chen, J.Y., Kieffer-Jaquinod, S., Fontecave, M., Clarke, C.F., and Pierrel, F. (2012). Over-expression of the Coq8 kinase in Saccharomyces cerevisiae coq null mutants allows for accumulation of diagnostic intermediates of the Coenzyme Q6 biosynthetic pathway. J. Biol. Chem. 287, 23571-23581.
Xie, L.X., Williams, K.J., He, C.H., Weng, E., Khong, S., Rose, T.E., Kwon, O., Bensinger, S.J., Marbois, B.N., and Clarke, C.F. (2015). Resveratrol and para-coumarate serve as ring precursors for coenzyme Q biosynthesis. J. Lipid Res. 56, 909-919.
Xu, W., Yuan, J., Yang, S., Ching, C.B., and Liu, J. (2016). Programming Saposin-Mediated Compensatory Metabolic Sinks for Enhanced Ubiquinone Production. ACS Synth Biol. Zahedi, R.P., Sickmann, A., Boehm, A.M., Winkler, C., Zufall, N., Schonfisch, B., Guiard, B., Pfanner, N., and Meisinger, C. (2006). Proteomic analysis of the yeast mitochondrial outer membrane reveals accumulation of a subclass of preproteins. Mol. Biol. Cell 17, 1436-1450. Zhou, L., Wang, J.Y., Wang, J.H., Poplawsky, A., Lin, S.J., Zhu, B.S., Chang, C.Q., Zhou, T.L., Zhang, L.H., and He, Y.W. (2013). The diffusible factor synthase XanB2 is a
1 2 3 4 5 6 7 8 9 10 11 12 13 14 15 16 17 18 19 20 21 22 23 24 25 26 27 28 29 30 31 32 33 34 35 36 37 38 39 40 41 42 43 44 45 46 47 48 49 50 51 52 53 54 55 56 57 58 59 60 61
bifunctional chorismatase that links the shikimate pathway to ubiquinone and xanthomonadins biosynthetic pathways. Mol. Microbiol. 87, 80-93.
1 2 3 4 5 6 7 8 9 10 11 12 13 14 15 16 17 18 19 20 21 22 23 24 25 26 27 28 29 30 31 32 33 34 35 36 37 38 39 40 41 42 43 44 45 46 47 48 49 50 51 52 53 54 55 56 57 58 59 60 61
FIGURE LEGENDS
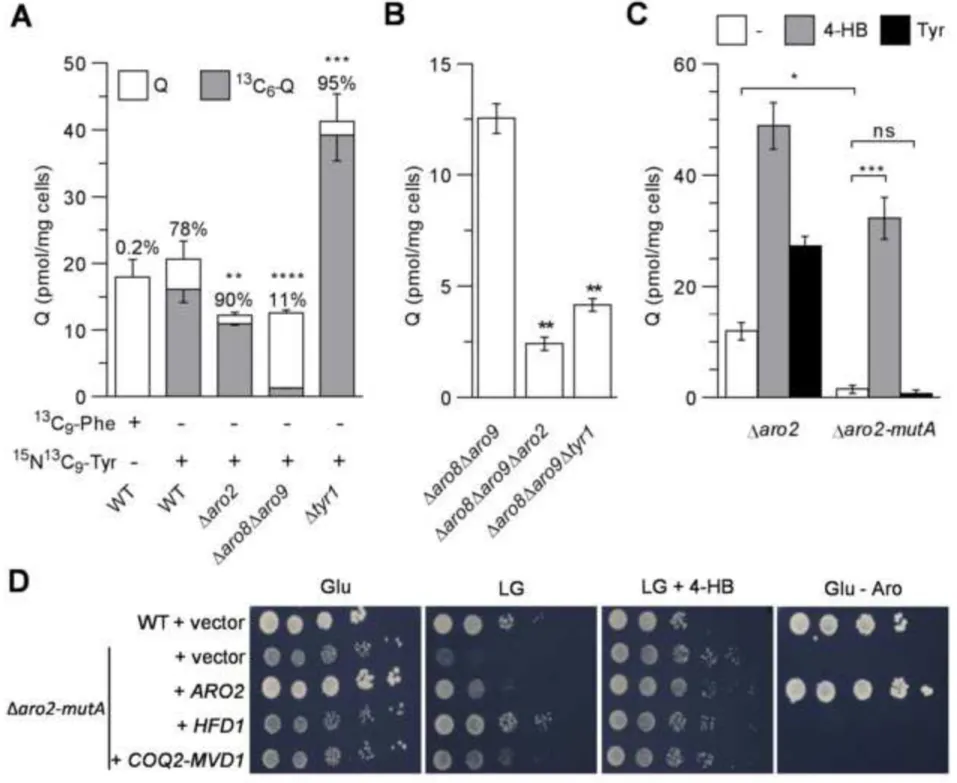
Figure 1: A genetic defect in the metabolism of tyrosine decreases Q.
A, Quantification of 13C6-Q and unlabelled Q in cells grown with 15N13C9-Tyr or 13C9-Phe. n=3 (Δaro8Δaro9), n=4 (WT, Δaro2 and Δtyr1). Mean + s.e.m. of total Q (upper error bar), mean - s.e.m. of 13C6-Q (lower error bar). The average percentage of 13C6-Q is indicated on top of each bar, P value in comparison to WT + 15N13C9-Tyr. B, Q content of cells grown in medium with aromatic amino acids. Mean ± s.e.m.; n=6. C, Q content of cells grown in glucose medium with aromatic amino acids (Tyr 15 mg/L) supplemented with 10 µM 4-HB or 60 mg/L tyrosine. Mean ± s.e.m.; n=2 (+ Tyr), n=3 (± 4-HB). D, Growth of strains containing the indicated YEp352 plasmids on medium without aromatic amino acids (– Aro) or with Phe, Trp and 15 mg/L Tyr, containing either glucose (Glu) or lactate-glycerol (LG) and supplemented or not with 10 µM 4-HB. Representative images from one of three independent experiments are shown. ns: no significant difference, *: P< 0.05, **: P<0.01, ***: P<0.001, ****: P<0.0001, unpaired two-tailed t test (A, B), One-way ANOVA test (C). n, number of independent experiments.
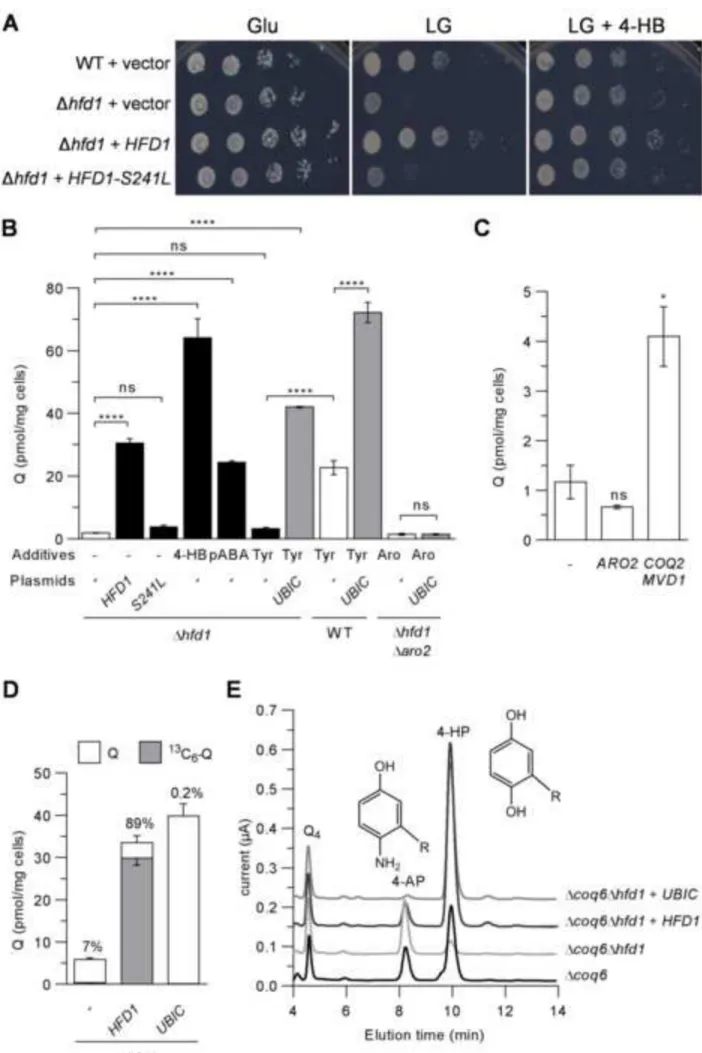
Figure 2: Cells lacking HFD1 are deficient in Q biosynthesis.
A, Growth of WT and Δhfd1 strains containing the indicated pRS415 plasmids on medium without aromatic amino acids containing either glucose (Glu) or lactate-glycerol (LG) supplemented or not with 10 µM 4-HB. Representative images from one of three independent experiments are shown. B, Q content of cells containing an empty vector (-), pRS415-HFD1, pRS415-HFD1-S241L, or pRS426-UBIC grown in medium supplemented or not with 10 µM 4-HB, 10 µM pABA, 30 mg/L Tyr or aromatic amino acids (Aro) as indicated. Mean ± s.e.m.;
n=4 (except for Δhfd1 with pABA, n=3). C, Q content of Δhfd1 cells containing the indicated
YEp352 plasmids and grown in medium supplemented with 15 mg/L Tyr. Mean ± s.e.m.; n=3. D, Quantification of 13C6-Q and unlabelled Q in cells grown in medium containing 30 mg/L 15N13C
9-Tyr (n=9). Mean + s.e.m. of total Q (upper error bar), mean - s.e.m. of 13C6-Q (lower error bar). The average percentage of 13C6-Q is indicated on top of each bar. E, Superimposition of HPLC-ECD chromatograms of lipid extracts of the indicated strains containing the pCOQ8 plasmid. Q4, internal standard; 4-AP, aminophenol and 4-HP, 3-hexaprenyl-4-hydroxyphenol (structures shown). Representative chromatograms from one of four independent experiments are shown. ns: no significant difference, *: P< 0.05, ****: P<0.0001, One-way ANOVA test (B), unpaired two-tailed t test (C). n, number of independent experiments.
Figure 3: Hfd1 oxidizes 4-Hbz to 4-HB that is used for Q biosynthesis.
A, Q content of cells grown in the presence or not of 10 µM Hbz. Mean ± s.e.m.; n=4. B, 4-Hbz dehydrogenase activity measured on mitochondria purified from WT, Δhfd1 and Δhfd1 cells transformed with pRS415-HFD1. Mean ± s.e.m.; n=5. C, Q content of E. coli WT or ΔubiC cells containing pMAL-c2-HFD1 or pMAL-c2-HFD1-S241L grown in M9 medium supplemented or not with 10 µM 4-HB or 10 µM 4-Hbz. Mean ± s.e.m.; n=4. D, Dehydrogenase activity of MBP-Hfd1 with 4-Hbz or benzaldehyde (Bz). Mean ± s.e.m.; n=6 (4-Hbz), n=3 (Bz). E, Quantification of labelled and unlabelled 4-Hbz in cells grown in YNB-p galactose medium 1 2 3 4 5 6 7 8 9 10 11 12 13 14 15 16 17 18 19 20 21 22 23 24 25 26 27 28 29 30 31 32 33 34 35 36 37 38 39 40 41 42 43 44 45 46 47 48 49 50 51 52 53 54 55 56 57 58 59 60 61
containing Trp, Phe and 30 mg/L 15N13C
9-Tyr (n=4). Mean + s.e.m. of total 4-Hbz (upper error bar), mean - s.e.m. of 13C7-4-Hbz (lower error bar). The average percentage of 13C7-4-Hbz is indicated on top of each bar, P value in comparison to WT. ns: no significant difference, *:
P<0.05, ****: P<0.0001, unpaired two-tailed t test. n, number of independent experiments.
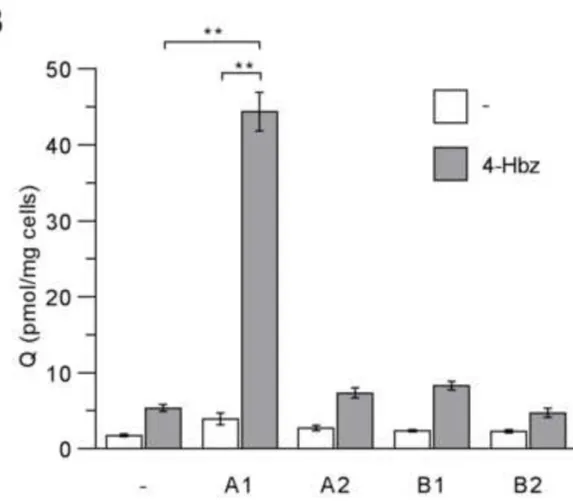
Figure 4: Human ALDH3A1 oxidizes 4-Hbz to 4-HB in S. cerevisiae.
A, 4-Hbz dehydrogenase activity measured on total cellular extracts of Δhfd1 cells transformed with YEp352 (-), pNK10 (3xFLAG-ALDH3A1), pNK5 (3xFLAG-ALDH3A2), pNK12 (3xFLAG-ALDH3AB1) or pNK14 (3xFLAG-ALDH3AB2). Mean ± s.e.m.; n=3. Immunodetection of ALDH3 proteins with anti-FLAG antibody; Anc2 was used as a loading control. B, Q content of Δhfd1 cells described in 4A, grown in the presence or not of 10 µM 4-Hbz. Mean ± s.e.m.; n=3 . **: P<0.01, unpaired two-tailed t test. n, number of independent experiments.
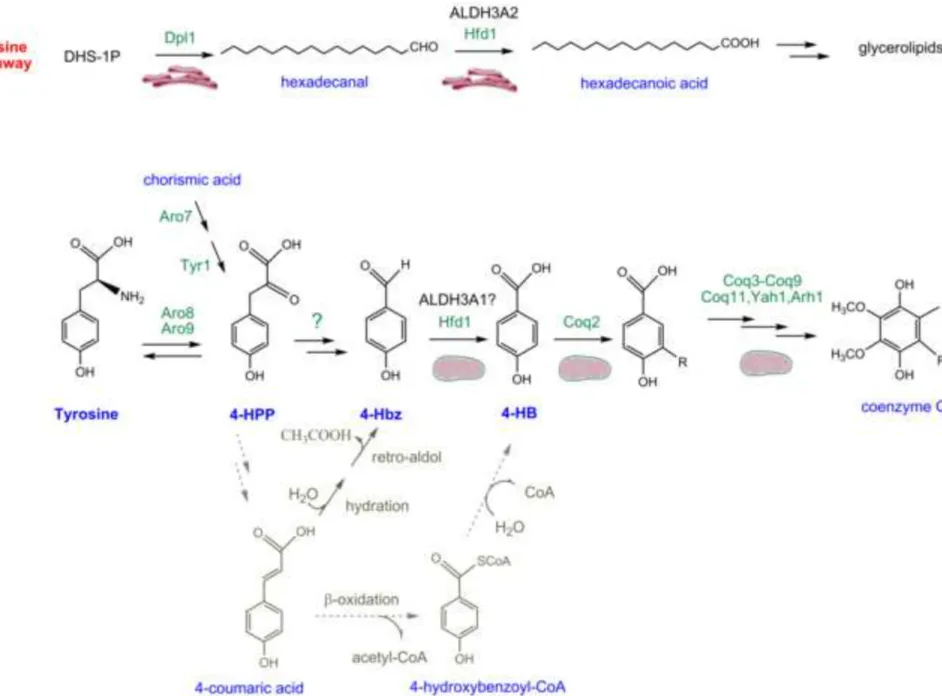
Figure 5: Reactions catalyzed by Hfd1 in Q biosynthesis and in the dihydrosphingosine degradation pathway in S. cerevisiae.
Hfd1 and human ALDH3A2 catalyze the oxidation of hexadecanal to hexadecanoic acid (Nakahara et al., 2012), which is likely to take place in the endoplasmic reticulum (Kihara, 2014; Zahedi et al., 2006). In mitochondria, Hfd1 oxidizes 4-Hbz into 4-HB which is prenylated by Coq2 and further metabolized to Q (R, polyprenyl tail). 4-HPP originates both from exogenous tyrosine via Aro8 and Aro9 and from chorismic acid via Aro7 and Tyr1. The shortening of the side chain of 4-HPP may proceed via hydration of 4-coumaric acid and a subsequent retro-aldol reaction (grey arrows) but is unlikely to involve β-oxidation (dashed grey arrows) which would yield 4-HB and not 4-Hbz.
1 2 3 4 5 6 7 8 9 10 11 12 13 14 15 16 17 18 19 20 21 22 23 24 25 26 27 28 29 30 31 32 33 34 35 36 37 38 39 40 41 42 43 44 45 46 47 48 49 50 51 52 53 54 55 56 57 58 59 60 61
SUPPLEMENTAL INFORMATION
Figure S1
Figure S1 Related to Figure 1: Metabolic origin of the aromatic ring of coenzyme Q in S. cerevisiae.
A C B 0 20 40 60 80 100 560 580 600 620 Relative intensity (%) m/z 15N13C 9-Tyr 582.3 597.2 608.2 614.1 591.2 D Δaro2 Δaro2-mutA Glu LG LG + 4-HB E 0 20 40 60 80 100 560 580 600 620 Relative intensity (%) m/z Aro 582.3 591.2 608.2 613.1 F
Supplemental Text & Figures
1 2 3 4 5 6 7 8 9 10 11 12 13 14 15 16 17 18 19 20 21 22 23 24 25 26 27 28 29 30 31 32 33 34 35 36 37 38 39 40 41 42 43 44 45 46 47 48 49 50 51 52 53 54 55 56 57 58 59 60 61
A, The shikimate pathway and its proposed connections to coenzyme Q biosynthesis at the beginning of our study. 4-hydroxybenzoic acid (4-HB) and para-aminobenzoic acid (pABA) are prenylated by Coq2 to form hydroxybenzoic acid (HHB) and hexaprenyl-aminobenzoic acid (HAB), respectively. R represents the hexaprenyl tail of Q. Coq3-Coq9, Coq11, Yah1 and Arh1 are required to synthesize Q from HHB or HAB. The focus of this study is the biosynthesis of 4-HB which may originate either from tyrosine (red arrows) – with 4-HPP as a hypothetical intermediate – or from chorismic acid via a chorismatase reaction (dashed arrow) as catalysed by UbiC in E. coli. The metabolic pathway from tyrosine to 4-HB which takes into account the findings of our study is shown in Figure 5. B, Q content of WT cells grown in YNB-p galactose medium supplemented or not with 10 µM 4-HB or 60 mg/L tyrosine. Mean ± s.e.m.; n=8. C, Mass spectra of Q from WT cells grown in YNB-p galactose containing Phe, Trp and Tyr (Aro) or Phe, Trp and 15N13C
9-Tyr. The ions at m/z= 591.2 and m/z= 608.2 correspond respectively to H+- and NH
4+-adducts of unlabeled Q (C39H58O4); those at m/z= 597.2 and m/z= 614.1 correspond to H+- and NH
4+-adducts of ring-labeled Q (13C6-12C33H58O4). Grey dots indicate the positions of the 13C isotope. The ion at m/z= 582.3 corresponds to an unidentified molecule which co-elutes with Q. Representative spectra from one of three independent experiments are shown. D, Plate growth assay of Δaro2 and Δaro2-mutA strains on YNB-p solid medium with aromatic amino acids (Tyr 15 mg/L) containing either glucose (Glu) or lactate-glycerol (LG) supplemented or not with 10 µM 4-HB. Representative images from one of three independent experiments are shown. E, Q content of Δaro2 and Δaro2-mutA cells grown in YNB-p galactose medium with aromatic amino acids (Tyr 15 mg/L) supplemented or not with 10 µM pABA. Mean ± s.e.m.; n=3. F, Q content of Δaro2-mutA cells containing the indicated YEp352 plasmids or empty vector (-), grown in YNB-p galactose medium with aromatic amino acids (Tyr 15 mg/L). Mean ± s.e.m.; n=2 (-), n=3 (ARO2 and COQ2-MVD1). ns: no significant difference, *: P<0.05, **: P<0.01, ****: P<0.0001, unpaired two-tailed t-test. n, number of independent experiments.
1 2 3 4 5 6 7 8 9 10 11 12 13 14 15 16 17 18 19 20 21 22 23 24 25 26 27 28 29 30 31 32 33 34 35 36 37 38 39 40 41 42 43 44 45 46 47 48 49 50 51 52 53 54 55 56 57 58 59 60 61
Figure S2
Figure S2 Related to Figure 2: Sequence conservation and structural model of Hfd1.
A, Sequence alignment of Hfd1 and Ald4 from S. cerevisiae (UniProt ID, Q04458, P46367, respectively) and ALDH2, ALDH3A1 from Homo sapiens (P05091, P30838, respectively). The conserved Ser241 of Hfd1 is highlighted in red. B, Homology model of S. cerevisiae Hfd1 showing the typical topology of aldehyde dehydrogenases with three domains: the dimerization domain (K103-I127 and H460-end) in green, the NAD binding domain in blue (M1-P102, S128-L237 and H430-S459) and the catalytic domain in yellow (K240-I429). The conserved LELGGKS sequence (L235-S241) that connects the NAD binding domain and the catalytic domain is shown in red.
1 2 3 4 5 6 7 8 9 10 11 12 13 14 15 16 17 18 19 20 21 22 23 24 25 26 27 28 29 30 31 32 33 34 35 36 37 38 39 40 41 42 43 44 45 46 47 48 49 50 51 52 53 54 55 56 57 58 59 60 61
Figure S3
Figure S3 Related to Figure 3: Oxidation of 4-hydroxybenzaldehyde by Hfd1.
A, Dihydrosphingosine degradation pathway in S. cerevisiae. B, Relative Q content as percentage of WT cells. Mean ± s.e.m.; n=6. C, Proposed reaction catalyzed by Hfd1. D, 4-Hbz dehydrogenase activity measured on total cellular extracts of WT, Δhfd1 cells transformed with pRS415-HFD1 or empty vector. Mean ± s.e.m.; n=3 (WT), n=6 (Δhfd1±HFD1). E, Decanal dehydrogenase activity measured on extracts described in S3D. C10:0, decanoic acid. Mean ± s.e.m.; n=3. F, Relative 4-Hbz dehydrogenase activity of soluble and membrane fractions as percentage of Δhfd1 cells transformed with pRS415-HFD1. Mean ± s.e.m.; n=4. G, SDS-PAGE of amylose resin eluate and gel filtration fractions containing pure MBP-Hfd1. H, Reduction of NAD+ or NADP+ by MBP-Hfd1 in the presence of 4-Hbz. n=3. I, 4-Hbz content of cells grown in YNB-p galactose medium containing or not 30 mg/L Tyr. Mean ± s.e.m.; n=3. J, GCMS spectra of 4-Hbz in extracts of WT cells grown in the presence of 30 mg/L Tyr or 15N 13C
9-Tyr. Representative spectra from one of three independent experiments are shown. ns: no significant difference, *: P< 0.05, **: P<0.01, unpaired two-tailed t test (B), One-way ANOVA test (I). n, number of independent experiments.
1 2 3 4 5 6 7 8 9 10 11 12 13 14 15 16 17 18 19 20 21 22 23 24 25 26 27 28 29 30 31 32 33 34 35 36 37 38 39 40 41 42 43 44 45 46 47 48 49 50 51 52 53 54 55 56 57 58 59 60 61
Figure S4
Figure S4 Related to Figure 4: Phylogeny of Hfd1.
Phylogenetic tree of Hfd1 and the 19 human aldehyde dehydrogenase proteins.
SUPPLEMENTAL EXPERIMENTAL PROCEDURES
Chemicals. 4-hydroxybenzoate (4-HB), 4-hydroybenzaldehyde (4-Hbz), para-aminobenzoic acid (pABA), benzaldehyde, decanal, decanoic acid, reduced and oxidized nicotinamide adenine dinucleotide (NADH and NAD+), NAD phosphate (NADPH and NADP+), methanol, acetonitrile, isopropanol, ethanol, n-heptane, trifluoroacetic acid, ethyl acetate, ethyl methanesulfonate (EMS), LC-MS grade formic acid and acetic acid were purchased from Sigma. 15N13C
9-L-Tyrosine and 13C9-L-Phenylalanine were purchased from Cortecnet. 4-HB, 4-Hbz were prepared in water to a final concentration of 1 mM and stored at -20 °C. Tyrosine and phenylalanine stock solutions were prepared in water at 500 mg/L and 10 g/L, respectively, and were sterile filtered and stored at 4 °C. Decanal was prepared in ethanol at a final concentration of 10 mM and stored at -20 °C.
Yeast strains. Saccharomyces cerevisiae strains used in this study are listed in the Supplemental Table below. The Δaro8Δaro9 strain was constructed by crossing Δaro8 and Δaro9 strains and by selecting for the presence of both mutations in a haploid strain after sporulation of the diploid strain according to a published procedure (Sherman, 2002) and tetrad dissection on a Nikon 50i microscope equipped with a micromanipulator. The Δaro8Δaro9Δaro2 and Δaro8Δaro9Δtyr1 strains were obtained by transforming the Δaro8Δaro9 strain with the HIS3 gene amplified by PCR from Saccharomyces kluyveri using respectively, Aro2-his3 5’ and Aro2-his3 3’ primers or Tyr1-his3 5’ and Tyr1-his3 3’ primers (see Supplemental Table) and by selecting His prototroph clones. The Δtyr1 strain was created similarly by transforming the BY4741 strain. The Δcoq6Δhfd1 strain was constructed by crossing Δcoq6 and Δhfd1 strains and by selecting for the
HFD1 ALDH3B1 ALDH3B2 ALDH3A1 ALDH3A2 ALDH6A1 ALDH4A1 ALDH7A1 ALDH16A1 ALDH5A1 ALDH8A1 ALDH9A1 ALDH1L1 ALDH1L2 ALDH2 ALDH1A3 ALDH1A2 ALDH1A1 ALDH18A1 Hfd1 1 2 3 4 5 6 7 8 9 10 11 12 13 14 15 16 17 18 19 20 21 22 23 24 25 26 27 28 29 30 31 32 33 34 35 36 37 38 39 40 41 42 43 44 45 46 47 48 49 50 51 52 53 54 55 56 57 58 59 60 61
presence of both markers associated to the respective deletions in a haploid strain after tetrad dissection. In all cases, the integration of the deletion cassette was verified by PCR amplification of the locus on the genomic DNA. Transformations were performed using the lithium acetate method (Burke et al., 2000). Supplemental Table: Yeast strains used in this study
Strain Genotype Source
BY4741 / WT Wild Type, MATa his3Δ1 leu2Δ0 met15Δ0 ura3Δ0 Euroscarf Δaro2 MATa his3Δ1 leu2Δ0 lys2Δ0 ura3Δ0 aro2::kanMX4 Euroscarf Δaro2 MATa his3Δ1 leu2Δ0 met15Δ0 ura3Δ0 aro2::kanMX4 Euroscarf
Δaro8 Δaro9
MATa his3Δ1 leu2Δ0 met15Δ0 ura3Δ0 aro8::kanMX4 MATa his3Δ1 leu2Δ0 lys2Δ0 ura3Δ0 aro9::kanMX4
Euroscarf Euroscarf Δaro8Δaro9 MATa his3Δ1 leu2Δ0 ura3Δ0 aro8::KanMX4 aro9::KanMX4
met15Δ0
This study
Δaro2-mutA MATa his3Δ1 leu2Δ0 met15Δ0 ura3Δ0 aro2::kanMX4 hfd1-C722T
This study
Δtyr1 MATa his3Δ1 leu2Δ0 met15Δ0 ura3Δ0 tyr1:: SkHIS3 This study Δaro8Δaro9Δaro2
Δaro8Δaro9Δtyr1
MATa his3Δ1 leu2Δ0 ura3Δ0 aro8::KanMX4 aro9::KanMX4 met15Δ0 aro2::SkHIS3
MATa his3Δ1 leu2Δ0 ura3Δ0 aro8::KanMX4 aro9::KanMX4 met15Δ0 Tyr1::SkHIS3
This study
This study Δhfd1 MATa his3Δ1 leu2Δ0 met15Δ0 ura3Δ0 hfd1::kanMX4 Euroscarf Δcoq6
MATα coq6::LEU2 trp1-1 can1-100 ura3-1 ade2-1 his3-11,15 (Gin et al., 2003) Δcoq6Δhfd1 MAT? ura- his- met- lys- trp? met? coq6::LEU2 hfd1::kanMX4 This study
Growth assay on plates. Overnight cultures in YNB-p 2% galactose were diluted in water to OD600 = 1 and ten-fold serial dilutions in sterile water were performed in 96 well plates. 5 µL of each dilution was spotted on YNB-p solid medium containing either glucose (Glu) or LG. Plates were imaged after incubation at 30 °C for three days (Glu) or five days (LG).
EMS mutagenesis and genetic analysis of Δaro2-mutA. EMS mutagenesis was carried out essentially as described (Winston, 2008). A culture of 10 mL of Δaro2 cells (MATa) in YNB-p LG medium at OD600 1.2, was centrifuged at 5,000 g for 30 sec. The cells were rinsed twice with water and resuspended in 2.5 mL 0.1 M sodium phosphate buffer pH 7.0. 80 µL EMS was added and the cells were incubated for 1 h at 30 °C, 200 rpm. The cells were harvested by centrifugation at 5,000 g for 30 sec, rinsed three times in 1 mL 5% (w/v) sodium thiosulfate and finally resuspended in 1 mL water. The cells were diluted 1,000 fold in water and 120 µL were spread on YPD plates. After two days, colonies (~1,000 / plate, ~50,000 colonies in total) were replica plated onto YNB-p glucose medium using sterile velvets and grown for 24 h at 30 °C. The cells were then replica plated onto YNB-p LG medium containing or not 10 µM 4-HB. After 4 days at 30°C, the plates were compared visually and clones that grew exclusively on YNB-p LG medium containing 1 2 3 4 5 6 7 8 9 10 11 12 13 14 15 16 17 18 19 20 21 22 23 24 25 26 27 28 29 30 31 32 33 34 35 36 37 38 39 40 41 42 43 44 45 46 47 48 49 50 51 52 53 54 55 56 57 58 59 60 61