HAL Id: hal-02618276
https://hal.inrae.fr/hal-02618276
Submitted on 25 May 2020HAL is a multi-disciplinary open access archive for the deposit and dissemination of sci-entific research documents, whether they are pub-lished or not. The documents may come from teaching and research institutions in France or abroad, or from public or private research centers.
L’archive ouverte pluridisciplinaire HAL, est destinée au dépôt et à la diffusion de documents scientifiques de niveau recherche, publiés ou non, émanant des établissements d’enseignement et de recherche français ou étrangers, des laboratoires publics ou privés.
Does board gender diversity influence firm profitability?
A control function approach
Rey Đặng, L’hocine Houanti, Krishna Reddy, Michel Simioni
To cite this version:
Rey Đặng, L’hocine Houanti, Krishna Reddy, Michel Simioni. Does board gender diversity influence firm profitability? A control function approach. Economic Modelling, Elsevier, 2020, 90, pp.168-181. �10.1016/j.econmod.2020.05.009�. �hal-02618276�
Does board gender diversity influence firm
profitability? A control function approach
Rey Dang
a, L’Hocine Houanti
b, Krishna Reddy
c,1and Michel Simioni
da ISTEC Paris, France
b La Rochelle Business School, La Rochelle, France
c Toi Ohomai Institute of Technology, Rotorua, New Zealand d INRA, UMR 1110 MOISA, Montpellier, France
ABSTRACT
We investigate the relation between board gender diversity and firm profitability using the control function (CF) approach recently suggested by Wooldridge (2015). The CF method takes account of the problem of endogenous explanatory variables that have potential to bias the results. Using a sample of firms that made up the S&P 500 over the period 2004-2015, we find that the presence of women on corporate boards (measured either by the percentage of female directors on corporate boards or the Blau index of heterogeneity) has a positive and significant (at the 1% level) effect on firm profitability (measured by the return on assets). We compare our results to more traditional approaches (such as pooled OLS or the fixed-effects model). Through this study, we shed light on the effect of women on corporate boards on firm performance, as it is still a controversial issue (Post and Byron, 2015).
JEL Classification: G30 G34 J1 Keywords: Women Board of directors Econometrics Control function Firm performance
Post-print version: Economic Modelling, vol. 90, August 2020, 168-181 https://doi.org/10.1016/j.econmod.2020.05.009
1 Corresponding author.
E-mail addresses:, [email protected] (R. Dang), [email protected] (L. Houanti),
1. Introduction
In recent years, board gender diversity (BGD) – or women on corporate boards (WOCB)2 – has been at the center of policy and academic research (Terjesen, Sealy and Singh, 2009). Previously considered to be an ethical issue (i.e. that it is wrong for individuals to be excluded from the highest echelons of organization purely on the grounds of gender), WOCB is in-creasingly perceived as a value-driver for organizations. Robinson and Dechant (1997) have suggested a “business case” for BGD, arguing that it may improve board decision-making, which, in turn, may influence firm performance (FP).
The academic literature puts forward several arguments in support of BGD, including en-hanced quality of decision-making (Milliken and Martins, 1996), a closer monitoring of boards’ strategic decisions (Nielsen and Huse, 2010), and board behavior (Adams and Ferreira, 2009), which, in turn, induce better firm performance. However, these claims have not been confirmed empirically. Despite a relatively large body of literature examining the relationship between WOCB and firm performance, the empirical evidence is somewhat mixed (Post and Byron, 2015). Some studies have found that WOCB add value (e.g. Campbell and Mínguez-Vera, 2008, Liu, Wei and Xie, 2014). Conversely, other studies have documented that WOCB decrease firm performance (e.g. Adams and Ferreira, 2009, Ahern and Dittmar, 2012). Finally, some studies have found that WOCB have no effect on firm per-formance (e.g. Carter, D'Souza, Simkins and Simpson, 2010, Rose, 2007).
Many reasons could explain such a mixed set of findings, with potential candidates includ-ing the use of different samples, time windows, empirical specifications, and methodologies (Adams, Haan, Terjesen and Ees, 2015, Ferreira, 2015). We believe that such empirical in-consistency may be due to a failure to take endogeneity problems into account (Adams, 2016). Establishing a causal relationship between BGD and firm performance might be chal-lenging, because board characteristics are not exogenous random variables. Board characteris-tics are endogenously chosen by firms to fulfill their operating and contracting environment (Adams, Hermalin and Weisbach, 2010, Sila, Gonzaleza and Hagendorff, 2016). Three sources of endogeneity may bias the effect of board structure and firm performance (Wintoki, Linck and Netter, 2012). First, omitted or unobserved firm characteristics (both fixed and time-varying) may simultaneously affect both the appointment of female directors and firm performance. A second problem is reverse causality: WOCB may affect firm performance, but it is also possible that financially healthy firms are more likely to appoint female directors. Finally, dynamic endogeneity may arise when current firm value and board structure are at-tributable to past firm performance. Accordingly, not fully addressing the endogeneity issue may induce erroneous inferences about a causal relationship between BGD and firm perfor-mance. We argue that the inconsistency in results mentioned by Post and Byron (2015) is due partly to this phenomenon. Furthermore, the mixed results indicate that more evidence is needed to increase the level of knowledge regarding the relationship between BGD and firm performance.
Various econometric approaches have been proposed and used to investigate the relation-ship between BGD and FP, some of which, such as the generalized method of moments (GMM), address the problem of endogeneity explicitly. The main contribution of this article is to re-examine this relationship using the control function (CF) suggested by Wooldridge (2015). Specifically, we combine a correlated random effects (CRE) approach (Chamberlain, 1984, Mundlak, 1978) with a CF approach (Wooldridge, 2015)3 to address the problem ex-plicitly of endogeneity in a panel data framework. The endogeneity issue due to the omission
2 We use both expressions in this study.
3 Recent applications of the CF approach can be found in Giles and Murtazashvili (2013) and López-Feldman
of time-invariant factors that are correlated to WOCB is usually addressed using fixed-effects (FE) modeling. However, the CRE approach has more benefits than the traditional FE estima-tor in panel data analysis. First, by including the vecestima-tor of time-averaged explanaestima-tory varia-bles, time-invariant unobserved heterogeneity can be controlled as with FE but without en-countering the incidental parameter problem that affects FE model estimation. Second, it ena-bles measuring the effect of time-invariant explanatory variaena-bles, which FE modeling does not allow (Wooldridge, 2010). Moreover, CRE can be easily combined with a CF approach, which addresses the potential endogeneity issue due to unobserved time-varying factors that are correlated with WOCB. The CF approach is inherently an instrumental variables (IV) method. Its implementation assumes the availability of variables that do not appear in the equation to be estimated, that is, excluded instrumental variables, and that explains the varia-tion of the endogenous explanatory variable, here WOCB. The exogenous variavaria-tion induced by excluded instrumental variables provides a separate variation in the residuals obtained from a reduced form, which serve as the control functions. By adding appropriate control functions, which are usually estimated in a first stage, the endogenous explanatory variable becomes appropriately exogenous in a second-stage equation. Accordingly, the CF approach enables testing the endogeneity of the explanatory variable by using a simple Hausman (1978) test. This test first can be corrected from having estimation errors coming from first-stage estimation of control functions using bootstrap techniques, and then can be easily made robust to heteroskedasticity and serial correlation in a panel data setting. In doing so, we make an econometric contribution by specifically taking into account the different facets of endogenei-ty through the CF approach (Wooldridge, 2015) that have not yet been used in the literature on WOCB.
Under this framework, the purpose of this article is to provide new evidence regarding the relationship between BGD and firm profitability by taking into careful consideration the issue of endogeneity through the CF method. Based on upper echelon theory (UET), we examine if WOCB positively influence firm profitability.
The remainder of the article is structured as follows. Section 2 presents the theoretical framework and the hypothesis developed. Section 3 outlines the research design (focusing on the CF method). The results and concluding remarks are offered in Sections 4 and 5, respec-tively.
2. Theoretical background
As Post and Byron (2015) point out, a large number of theories, such as agency theory (Fama and Jensen, 1983, Jensen and Meckling, 1976), resource dependence theory (Pfeffer and Salancik, 1978), social identity theory (Ashforth and Mael, 1989), and social categoriza-tion theory (Tajfel, 1981), have served as theoretical frameworks to examine the link between BGD and FP. Following Post and Byron (2015), we use UET (Hambrick, 2007, Hambrick and Mason, 1984) as our main theoretical framework in this study. Originally, UET focused on the top management team (TMT). However, the literature has applied this theory to boards of directors by considering the latter as “supra top management teams” (Finkelstein, Hambrick and Cannella Jr., 2009): 11). UET assumes that directors differ in terms of cogni-tive frames and that these cognicogni-tive differences significantly influence firm outcomes (Ham-brick, 2007). However, because directors’ cognitive frames are difficult to measure, the litera-ture proxies cognitive frames through observable characteristics of directors, such as gender or age (see (Dezsö and Ross, 2012).
Hambrick (2007) defines directors’ cognitive frames as their information-seeking and in-formation-evaluation processes. He argues that directors’ cognitive frames are linked to their own experiences, knowledge, and values and fundamentally shape how they seek and
inter-pret the information they receive. This also significantly influences decision-making process-es, thus firm outcomes. Following Hillman, Cannella and Harris (2002) and Singh, Terjesen and Vinnicombe (2008), we argue that female and male directors differ significantly regard-ing their cognitive frames and that gender diversity in the boardroom is likely to influence FP (e.g. Carpenter, 2002)
First, the literature has found that female directors bring different cognitive frames to a board due to variations in their experiences and knowledge compared to their male counter-parts. For instance, compared to male directors, females are more likely to possess a universi-ty degree and hold advanced degrees (e.g. Dang, Bender and Scotto, 2014, Singh et al., 2008). In terms of work experience, female directors are less likely to have been CEOs or COOs4 and are more likely to have come from non-business backgrounds (e.g. Dang et al., 2014, Singh et al., 2008).
In another vein, Daily, Certo and Dalton (1999) have suggested that WOCB are likely to bring to boards new insights and different understandings of market segmentation. A market segmentation strategy involves sound knowledge of the various market segments, as well as the different groups of consumers, in order to propose an attractive marketing mix (e.g. Dickson and Ginter, 1987, Smith, 1956). Accordingly, Daily et al. (1999) argue that WOCB expand perspectives to meet local and global needs, especially for firms operating in markets with a high concentration of female buyers (e.g. the luxury or automotive sector).
Second, owing to these differences in cognitive frames, we argue that a greater representa-tion of female directors is likely to influence the decision-making processes of a board (Post and Byron, 2015). Specifically, we contend that an increase in female representation on cor-porate boards significantly influences how decisions are made. Women’s leadership styles are said to be more participative, democratic, and communal (Eagly, Johannesen‐Schmidt and Van Engen, 2003) than those of men, who are more likely to be autocratic (Eagly and Johannesen‐Schmidt, 2001). This is supported by Bart and McQueen (2013), who find that female directors make fair decisions when competing interests are at stake by virtue of their cooperative decision-making.
The literature has shown that diverse groups have the potential to provide critical and valu-able information through bringing a greater range of perspectives to a board because of their experiences and differentiated knowledge (Hillman, Shropshire and Cannella, 2007). It is as-sumed that female directors have the capacity to exploit fully a firm’s capability to generate profits from its assets and investments (Carter et al., 2010, Miller and del Carmen Triana, 2009). In this context, Galbreath (2016) also argues that WOCB enable firms to meet the ex-pectations and demands of the various stakeholders, which, in turn, improves corporate social performance (Boulouta, 2013). Finally, by empowering a multitude of viewpoints and culti-vating deliberativeness in decision-making, WOCB might improve a firm’s decision-making processes and thus the quality of the results of that decision-making (Loyd, Wang, Phillips and Lount Jr, 2013, van Ginkel and van Knippenberg, 2008). Finally, in addition to these cognitive differences that female directors bring, they are more likely to be independent direc-tors (e.g. Dang et al., 2014, Singh et al., 2008) and to bring a different resources from that of men.
Consequently, we hypothesize that BGD is likely to be positively related to FP. According-ly, we assert the following:
Hypothesis: All else being equal, BGD is positively related to FP.
3. Research design
3.1. Sample
The initial sample included all companies listed on the Standard & Poor’s 500 (S&P 500) as of December 31, 2015. It covers the period from 2004 to 2015. This index represents a broad cross-section of the US equity market, including stock traded on the New York Stock Exchange (NYSE) and Nasdaq. The S&P 500 captures more than 80% of the total domestic US equity float-adjusted market capitalization. This index has already been used in previous studies (e.g. Anderson and Reeb, 2003, Carter et al., 2010). This study focused exclusively on large-sized companies because they are more likely to be under scrutiny from various stake-holders in regard to BGD (Hillman et al., 2007).5
Following standard practice, financial (SIC codes 6000-6999) and utility (SIC codes 4900-4999) firms were excluded due to their particular features (in terms of specific disclosure re-quirements and accounting regulations). Finally, observations with insufficient data were also excluded from the analysis. The final sample consisted of 369 firms and 3,332 firm-year ob-servations.
Finally, all variables except the dummy variables are winsorized at the 1% and 99% levels to reduce the potentially spurious effects of outliers.
3.2. Variables definition 3.2.1. Dependent variable
Consistent with Wintoki et al. (2012), our main measure of performance is return on assets (ROA), calculated as operating income before depreciation divided by total assets (Adams and Ferreira, 2009, Wintoki et al., 2012). ROA is an indication of the ability of a firm to gen-erate accounting-based revenues in excess of actual expenses from a given portfolio measured on a historical basis. As such, ROA represents an indication of the accounting income pro-duced for the shareholders (Carter et al., 2010).
Many studies that examine the relationship between BGD and FP have also used Tobin’s Q as a measure of performance (e.g. Adams and Ferreira, 2009). However, two reasons motivat-ed us to choose ROA as our measure of performance. First, Wintoki et al. (2012) argue that the use of Tobin’s Q as a measure of performance might be a proxy for growth opportunities. However, there are theoretical foundations suggesting that growth opportunities are a cause, rather than a consequence, of governance structures. Boone, Field, Karpoff and Raheja (2007) and Linck, Netter and Yang (2008), among others, provide empirical evidence to support this line of reasoning.
Second, in their meta-analysis of 100 studies examining the link between WOCB and FP, Post and Byron (2015) found that BGD is positively and significantly related to accounting returns (such as ROA). This suggests that firms with a greater proportion of WOCB have higher accounting returns. By contrast, these authors do not find any significant relationship between WOCB and market performance (such as Tobin’s Q). Venkatraman and Grant (1986) question if Tobin’s Q and ROA can be treated as equivalent, interchangeable measures of FP. 3.2.2. Independent variable
Following Adams and Ferreira (2009), BGD was measured through the percentage of WOCB calculated as the number of female directors divided by the total number of directors.
5 Consistent with the existing literature (e.g. Adams and Ferreira, 2009, Carter et al., 2010), this study focuses on
the US market because it is the largest market in the world and is more analyzed and commented on by the aca-demic literature, politics, and the press around the world.
3.2.3. Control variables
Following prior studies, such as Bebchuk and Cohen (2005) or Adams and Ferreira (2009), we controlled for firm and board characteristics that may affect our measure of performance.
Specifically, we first included Firm size (approximated using the natural logarithm of total assets; (Hillman et al., 2007). Firm size is a key driver of firm value and FP. Large firms are associated with higher costs of monitoring, because they are more complex to lead. Consistent with the existing literature, we expected a negative relationship between firm size and firm financial performance (e.g. Adams and Ferreira, 2009, Isidro and Sobral, 2015). Second, we included Leverage (calculated as the ratio of total debt to total assets; (Campbell and Mínguez-Vera, 2008). According to Shleifer and Vishny (1997), leverage is an important governance mechanism that forces managers to generate enough cash flow in order to pay the interest and the principal. This will then mitigate agency conflicts resulting from cash flow. As a result, we expected a negative relationship between leverage and firm financial perfor-mance (e.g. Campbell and Mínguez-Vera, 2008, Isidro and Sobral, 2015). Third, we included R&D Intensity (measured as the R&D-to-sales ratio; (Honoré, Munari and de La Potterie, 2015). Higher research and development (R&D) investment is usually associated with superi-or perfsuperi-ormance (e.g. Chan, Martin and Kensinger, 1990, Eberhart, Maxwell and Siddique, 2004). Hence, we expected R&D intensity to be positively related to FP. Fourth, we con-trolled for firm’s growth (defined as sales growth between t and t-1), because Green and Jame (2013) argue that a firm’s operational growth is an important vector of FP. Consistent with Isidro and Sobral (2015), we expected a positive relationship between firm growth and FP. Finally, we included Firm age (measured as the natural logarithm of the number of years since the firm’s inception; (Anderson and Reeb, 2003). Older firms are often associated with organizational rigidity and rent-seeking behavior by managers, which can cause FP to deterio-rate. Conversely, age may bring knowledge and skills. Green and Jame (2013) show that FP declines with firm age. Therefore, we expected a negative relationship between firm age and FP.
In our specification, we also included a set of control variables related to the BoD’s struc-ture, namely, board size, board independence, and board leadership structure. van den Berghe and Levrau (2004) argued that these three board mechanisms are the most commonly used in the literature. The empirical literature examining the relationship between BGD and FP has generally used these three control variables (e.g., Adams and Ferreira, 2009, Dezsö and Ross, 2012), as well as in the CG literature (e.g., Bebchuk and Cohen, 2005, Wintoki, Linck, and Netter, 2012). As pointed out by Adams, Hermalin, and Weisbach (2010), these board varia-bles enavaria-bles controlling both for the quality of CG and their possible effects on FP.6 First, we included Board size (measured as the logarithm of the number of directors on the board; (Wintoki et al., 2012). The arguments for a positive relationship between board size and FP stem from resource dependence theory, which posits that larger boards will have better infor-mation or greater knowledge due to the higher number of directors (e.g. Carter et al., 2010). However, proponents of agency theory posit a negative relationship (e.g. Yermack, 1996). Both theoretical and empirical evidence suggest that we should boar size in any specification, even if the direction of the relationship is not certain. Second, we considered Board independ-ence (measured as the proportion of outside – non-executive – directors on the board; (Wintoki et al., 2012). The effect of board independence on FP remains an open question in the literature (e.g. Adams and Ferreira, 2009, Bhagat and Bolton, 2008). Following Adams
6 Because the aim of this article is to compare our results from CF with the existing empirical literature, we did
not add any further control governance variables (such as ownership structure). However, we are aware that there are potentially other control governance variables. However, it is unclear, based on the existing literature, if adding these variables would significantly alter the relationship between BGD and FP (Adams, Almeida, and Ferreira, 2009, Adams et al., 2010).
and Ferreira (2009) and Carter et al. (2010), we included board independence as a control variable although the direction of the relationship is uncertain. Finally, we added CEO duality (measured as a dummy variable that is equal to 1 if the CEO is also the chair, 0 otherwise; (Wintoki et al., 2012). Existing studies have found that CEO duality is likely to have an im-pact on FP. Consequently, CEO duality is a double-edged sword on FP (Finkelstein and D'aveni, 1994).
3.3. Methodology
3.3.1. Endogeneity issues in estimating the relationship between board gender diversity and FP
According to Adams et al. (2010), there is no convincing reason to believe that board structure is exogenous. Indeed, there are both theoretical arguments and empirical evidence that suggest board structure is actually endogenous (e.g. Hermalin and Weisbach, 1988, 1998, 2003). For instance, Hermalin and Weisbach (1998) argue that board structure reflects an equilibrium resulting from a bargaining process between the CEO and the board. The CEO’s bargaining position stems from his or her ability (for which FP is a proxy). As such, board structure depends on past performance. Hermalin and Weisbach (2003) argue that board struc-ture and FP are jointly endogenous. Furthermore, Fama and Jensen (1983) and Coles, Daniel and Naveen (2008), among others, argue that board structure is a function of the scope and complexity of the firm.
The prospect that BGD is a conscious choice made by a firm must be taken into account when estimating the relationship between BGD and FP (Adams and Ferreira, 2009). Conse-quently, in this study, we specifically consider this endogeneity problem, following Hambrick (2007), who highlighted that this issue is “essential for gaining a grasp of the causal mecha-nisms that lie behind empirical associations” (p. 338).
However, in order to examine the relationship between BGD and FP accurately, two alter-native explanations must be considered: omitted/unobserved factors and reverse causality (Adams and Ferreira, 2009, Sila et al., 2016).
3.3.2. Omitted/unobserved factors
Omitted variable bias and unobserved heterogeneity are variables, other than those speci-fied in the model, that can provide an alternative or additional explanation to phenomena un-der study (Gippel, Smith and Zhu, 2015). According to Adams et al. (2009) and Adams (2016), this is a major problem, especially when estimating the relationship between BGD and FP, because a firm’s characteristics (both fixed and variable across time) may affect both the appointment of female directors and the governance choices made by an organization.
For instance, based on institutional theory (DiMaggio and Powell, 1983, Meyer and Ro-wan, 1977), the larger and more visible an organization is, the greater the pressure put on it to comply socially. Hillman et al. (2007) emphasize the fact that large listed companies are sub-ject to much attention and are particularly exposed to the scrutiny of a variety of stakeholders (e.g. employees, customers, investors, and communities) to increase female representation at all levels of the organization, especially in the boardroom. We also know that large firms be-have differently from small ones regarding gender diversity (Martín-Ugedo and Minguez-Vera, 2014). If we do not properly account for firm size, this factor could play a role in the observed correlation between BGD and corporate boards. Consequently, the eventual out-comes could suffer from omitted variable bias, making it difficult to determine the magnitude of the causal effect of gender diversity (Adams, 2016).
In the same vein, firms that are concerned about female representation on corporate boards may be more likely to appoint directors (the demand side) or may have a larger pool of female
candidates on which to draw for board positions (the supply side; see Gabaldon, Anca, Mateos de Cabo and Gimeno, 2015). On the demand side, socially responsible organizations may be more likely to be progressive and appoint WOCB, because female director appoint-ments are a means of displaying their legitimacy to stakeholders (Carleton, Nelson and Weisbach, 1998, Hillman et al., 2007). Within this framework, BGD is a component of corpo-rate social responsibility (CSR) and corpocorpo-rate social performance (CSP). Empirical studies have shown a positive association between BGD and CSR/CSP (e.g. Byron and Post, 2016). On the supply side, socially responsible organizations may appear to be very attractive in the eyes of female directors (Hillman et al., 2007, Turban and Greening, 1997). Indeed, social identity theory suggests that individuals seek to surround themselves with people who share similar perspectives and values, particularly as a basis for group membership (Dutton and Duncan, 1987, Tajfel and Turner, 1986). Adams and Funk (2012) find in their sample that female directors are more likely to possess what Eagly et al. (2003) labelled communal traits:7 universalism and benevolence, among others.
Firm-specific unobserved variables, that is, unobserved variables that represent time-invariant properties of firms, such as national institutional systems (Grosvold and Brammer, 2011) or cultural effects towards BGD (Carrasco, Francoeur, Labelle, Laffarga and Ruiz-Barbadillo, 2015), may significantly affect the relationship between BGD and FP. Indeed, Grosvold and Brammer (2011) and Carrasco et al. (2015) argue that country-level institutions play a significant role in the female representation on corporate boards, and cultural traits sig-nificantly affect a firm’s performance. However, these antecedents may be difficult to observe and measure so they are usually omitted from econometric specifications.
In this context, whatever the source of the omitted variable bias (which, moreover, can be cumulative), it is possible to observe a statistical relation between BGD and FP, even in the absence of a causal relationship between the two variables. In general, the literature deals with this issue by using panel data analysis and FE estimators, because these can take into account this bias under certain assumptions (Wooldridge, 2010). However, this treatment may not be sufficient because of a second explanation: reverse causality (Adams and Ferreira, 2009). 3.3.3. Reverse causality
Another problem associated with endogeneity is reverse causality (or simultaneity), which occurs when the dependent variable and the variable of interest are jointly determined (Gippel et al., 2015). There might be a source of endogeneity in the relationship between BGD and FP, because the match between corporate boards and female directors is likely to be a func-tion of both firm and individual characteristics (Adams, 2016). Specifically, any correlafunc-tion between corporate outcomes and BGD may be the result of both the effect of WOCB on out-comes and the effect of outout-comes on BGD. In performance specifications, WOCB may affect FP, but it is also possible that financially successful firms may be more likely to appoint fe-male directors (Adams and Ferreira, 2009). Not taking into account reverse causality in the specification might produce biased results, because the direction of causality could go both ways (Gippel et al., 2015). Beyond these two sources of endogeneity, Wintoki et al. (2012) categorized a third source of endogeneity: dynamic endogeneity.
3.3.4. Dynamic endogeneity
Generally, the term dynamic endogeneity refers to the type of endogeneity that arises when a firm’s current actions are correlated to its control environment and future performance (Wintoki et al., 2012). In a general framework of the relation between governance and per-formance, endogeneity could arise when the current corporate governance mechanisms,
con-7 In essence, communal traits encompass caring, sensitivity, honesty, understanding, compassion, and sympathy
trol characteristics, and FP are determined by the firm’s past performance. For instance, if a firm suffers from poor performance, it is likely that this situation will prompt shareholders to replace board members who will issue more stringent governance rules. This is likely to affect the firm’s current board structures, some control characteristics, and performance (Hermalin and Weisbach, 1998). Consequently, Wintoki et al. (2012) argue that corporate financial deci-sions are likely to be dynamic in nature. Raheja (2005) and Harris and Raviv (2008) hypothe-size that past performance has a direct influence on a firm’s innovation environment or poten-tial profits. All these factors (individually and collectively) might affect the optimal board structure, including female representation on corporate boards. Consequently, Wintoki et al. (2012) refer to this relationship as dynamic endogeneity. They find that, in the US market, a dynamic relationship between current governance and past FP exists. Their results imply that, if the dynamic endogeneity problem is not carefully controlled, the relation between current board structure and past performance is likely to yield inconsistent results.
3.3.5. Identification strategy Our main model is as follows:
(FP)it = ρ (FP)it-1 + β (BGD measure)it + (Control variables)’it ϒ + Year dummies
+ (Firm fixed effect)i + εit [1]
where i denotes firms in the sample, and t refers to time period. (FP)it is a measure of firm i performance at time t. As recommended by Wintoki et al. (2012), we express current FP as a linear function of past performance, choosing a lag equal to one. (BGD measure)it is a meas-ure of measmeas-ure of firm i BGD at time t, either WOCB or Blau. (Control variables)it is a vector of observable control variables influencing firm i performance at time t. The model includes year dummies and firm FE to capture unobservable time-varying unobserved factors and un-observable time-invariant firm heterogeneity. ρ, β and the vector ϒ are parameters to be esti-mated given a panel sample of firm observations.
Modeling the present performance of a firm as a function of its past performance, while in-troducing a FE to capture the unobserved time-invariant firm heterogeneity, as assumed in Eq.
[1], results in the potential correlation between the unobserved FE and the lagged value of the performance index, or, a fortiori, between the unobserved FE and the initial value of the per-formance index. This problem is called the initial condition problem (Heckman, 1981). Thus, applying OLS to Eq. [1] can be shown to be inconsistent.
Existing studies (e.g. Adams and Ferreira, 2009, Liu et al., 2014) use the FE panel estima-tor to mitigate potential endogeneity of BGD arising from unobserved time-invariant firm heterogeneity and/or simultaneity. However, the FE estimator is not designed to deal with an initial condition problem. It can be also shown that, for a fixed number of time periods in the panel data set, the FE estimator raises an inconsistent estimation of the effect of past perfor-mance on present perforperfor-mance (Nickell, 1981). This inconsistency is not caused by anything we can assume for the FE, because these are eliminated by within transformation in estima-tion. The problem is that the within transformed lagged performance measure is now correlat-ed with the within transformcorrelat-ed error (Verbeek, 2012).
The two-step system GMM estimator, proposed by Blundell and Bond (1998), appears to be the most feasible solution for dealing with issues that come from a dynamic panel setting, such as Eq. [1]: (i) potential correlation between firm FE and some control variables, (ii) en-dogenous explanatory variable (here, BGD measure), and (iii) initial condition problem (Wintoki et al., 2012). Moreover, this technique overcomes the unavailability of appropriate external instruments for BGD measure as often encountered in the literature. Indeed, this technique enables employing the internal instruments available within the panel itself by elic-iting all the moment conditions data must satisfy. Recent simulation studies document the good performance of a two-step system GMM when dealing with issues encountered
estimat-ing panel data models such as Eq. [1] (Flannery and Hankins, 2013, Zhou, Faff and Alpert, 2014). Nevertheless, this technique is not free of limits. As emphasized by Roodman (2009a), the number of internal instruments generated using system GMM increases as the number of time periods T increases and can be shown as a quadratic in T. Instrument proliferation then makes some asymptotic results about system GMM estimators and render related specifica-tion tests to be misleading. A large instrument number often leads to overfitting endogenous variables and weakening the Hansen J-test of the instruments’ joint validity (Roodman, 2009a). Estimated variances of coefficients and the Hansen J-test can be too small, resulting in too much confidence in the validity of internal instruments. Roodman (2009a) proposes techniques for fighting against instrument proliferation. One of them is to combine, or to col-lapse, internal instruments through addition into smaller sets. This technique has the potential advantage of retaining most of the information conveyed by internal instruments and is equiv-alent to imposing the constraint in projecting regressors onto internal instruments that certain subsets have the same coefficient. Roodman (2009a) also provides simulation results showing the relevance of this technique.8
System GMM has been proposed as an alternative to instrumental variable methods when no external instrument variable is available. Identifying valid instruments is a difficult task in BGD analysis, because the majority of observable firm characteristics are already included in the performance equation. Reguera-Alvarado, de Fuentes and Laffarga (2017) propose using a measure related to firm visibility as an external instrument. Specifically, they propose to oper-ationalize this visibility by using a firm's membership in the stock market index. Such infor-mation is available to firms belonging to our sample. We observe if a firm is listed or not in the S&P 100 index. Because this index encompasses the largest companies in US, we hypoth-esize that those firms are expected to have higher visibility, due to their higher exposure to investors, stakeholders, media, and so on, especially regarding BGD (Hillman et al., 2007).
The availability of external instruments enables us to define an alternative strategy to the usual approaches in BGD analysis, based on recent developments in CRE and CF approaches (Wooldridge, 2015). As shown in the appendix, the combination of these two techniques makes it possible to deal with the three issues previously mentioned. Potential correlation between firm FR and some control variables and the initial condition problem can be ad-dressed using CRE, and CF provides an explicit treatment of endogenous explanatory varia-bles. An estimation strategy proceeds in two steps using only pooled OLS and robust t-statistics when assessing the validity of external instruments by rank condition test or the en-dogeneity of the chosen BGD indicator.
All in all, the empirical version of Eq. [1] we estimate is given by:
(FP)it = ρ (FP)it-1 + β (BGD measure)it + ϒ1 (FSIZE)it + ϒ2 (LEV)it + ϒ3 (R&D)it + ϒ4 (GROWTH)it + ϒ5 (FAGE)it + ϒ6 (BINDEP)it + ϒ7 (BSIZE)it
+ ϒ8 (DUAL)it + Year dummies + (Firm fixed effect)i + εit
[2]
3.4. Descriptive statistics and correlation analysis
Table 1 reports the descriptive statistics of all the variables. The mean ROA is 7.92%. However, there is a large variation in ROA within the sample firms, as the minimum is −17.22% and the maximum is 29.47%. Compared to Adams and Ferreira (2009) and Carter et al. (2010), among others, the firms in our sample enjoyed a better economic performance: the aforementioned studies finding mean (ROA) values of 3.19% and 3.90%, respectively. This is probably due to our time window being more recent (2004–2015), compared to 1996–2003 and 1998–2002, respectively.
The mean (resp. median) percentage of WOCB is approximately 16% (resp. 17%), which is significantly higher than the 8.50% reported by Adams and Ferreira (2009). The more re-cent time period of our study may explain the difference. Approximately 85% of the firms in our sample have at least one female director. This proportion is much larger than the 61% reported by Adams and Ferreira (2009). Finally, the average number of WOCB is 1.76, whereas Carter et al. (2010) reported 1.30 for their sample. In a nutshell, female directors seem to have made significant inroads on governance bodies.
Relative to Carter et al. (2010), the firms in our sample are larger in terms of assets (9.37 vs. 8.35)9 and managed by slightly smaller boards (10.72 vs. 9.38; Adams and Ferreira, 2009). Compared to Adams and Ferreira (2009), the firms in our sample are more independent (83% vs. 63%). Finally, relative to Carter et al. (2010), 58% (vs. 71%) of the firms in our sample have CEOs acting as chairs.
Ultimately, given these differences, the firms in our sample seem to have significant dif-ferences with existing studies. This observation has to be underlined.
[Place Table 1 here]
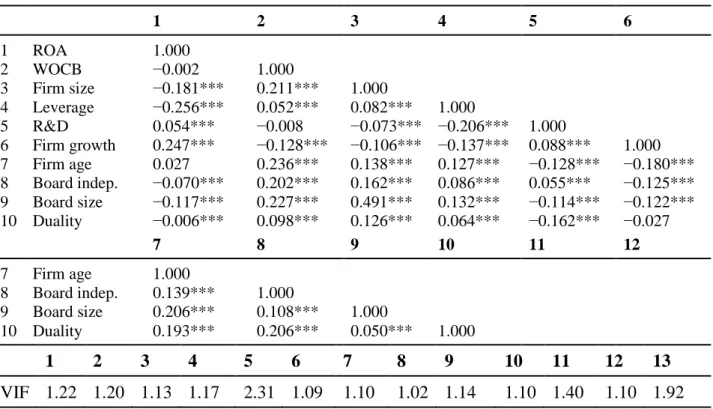
Table 2 reports the correlations among the variables. As a rule of thumb, a correlation of 0.70 or higher in absolute value may indicate a multicollinearity issue (Liu et al., 2014). In
Table 2, the highest correlation of 0.49 appears between firm size and board size, which is well below the value of 0.70.
To make sure that multicollinearity is not a problem in Eq. [4], we calculated the variance inflation factors (VIFs) for all the variables (Wooldridge, 2014). The VIFs ranged from 1.02 to 2.31, well below the cut-off of 10 recommended by Wooldridge (2014). Consequently, we concluded that multicollinearity had little impact on our analyses.
[Place Table 2 here]
4. Results
4.1. Main results
Table 3 presents the estimates of Eq. [2] with the percentage of WOCB, our measure of BGD, through the use of alternative models: (i) a dynamic OLS model (column 1), (ii) a FE model (column 2), (iii) a two-step system GMM (column 3), and (iv) our proposed strategy combining CF and CRE (columns 5 and 6). To test our hypothesis, we only consider results that reach conventional significance levels of 1% and 5%.
A first striking result appears in Table 3: the coefficient associated with past performance is found to be positive and significantly different from zero (at 1% significance level), regard-less of the method used. The expectation that pooled OLS estimator overestimates the true coefficient on the lagged firm performance, whereas the fixed effects estimator will underes-timate it (Bond, 2002), is satisfied. Esunderes-timates of the lagged firm performance coefficient using system GMM and joint CRE and CF estimators belong in the range defined by the values es-timated using pooled OLS or FE estimators.
This first result supports Wintoki et al.'s (2012) claim that performance is path-dependent, that is, past performance has a significant effect on current performance, and that this path dependence must be taken into account when measuring the causal effect of corporate board features such as WOCB. Nguyen, Locke and Reddy (2014), among others, find a similar re-sult.
Consistent with existing literature (e.g. Rose, 2007), as shown in column 1 of Table 3, the percentage of WOCB is positively and significantly correlated to ROA at a 5% level of signif-icance when using pooled OLS model. This finding is consistent with Campbell and Mínguez-Vera (2008) and Liu et al. (2014), among others. However, when time-invariant unobserved heterogeneity is taken into account through firm FE, the sign of the relationship turns out to be negative but significant only at the 10% level (column 2 of Table 3), suggest-ing that the relation between BGD and FP may be neutral, which is consistent, for example, with Carter et al. (2010).
Following Wintoki et al. (2012), we used the two-step system GMM estimator to examine the effect of WOCB on firm performance. Internal instruments were collapsed in order to deal with the issue of instrument proliferation (Roodman, 2009a, b). The results reported in col-umn 3 of Table 3 shows that the percentage of WOCB is negatively and statistically signifi-cantly related to ROA, but only at the 10% level. Given our criteria of significance, we argue that the effect of WOCB on ROA seems to be neutral. This finding confirms Wintoki et al. (2012) claim that when using a dynamic system GMM the relationship between corporate governance and firm performance might be neutral. Additionally, our results are consistent with Adams and Ferreira (2009) in that when endogeneity is taken into account, the relation-ship between and FP is negative, as our figures show.
To examine the validity of the system GMM estimator statistically, we conducted a Hansen J-test.10Table 3 shows that the Hansen J-test yields a p-value of 0.015, clearly indicating re-jection of the validity of the overidentifying restrictions involved in two-step system GMM estimation.11 This result leads us to question the validity of the choice of internal instruments
in the framework of system GMM, or the specification used in Eq. [2]. An alternative ap-proach, therefore, appears necessary. This is made possible by the availability of an external instrument, namely F100.
Column 5 in Table 3 reports estimates when applying our proposed estimation strategy combining CF and CRE. Before going into detail about the coefficient estimates, we need to establish whether our instrument (F100) is significantly related to the percentage of WOCB. A valid instrument must meet two conditions (Baum, 2006): (1) not be correlated with the error term in the main performance equation, except through control variables included in the regression (instrument exogeneity), and (2) be correlated with the endogenous variable (in-strument relevance). Results of the estimation of the auxiliary regression (see the Appendix) are shown in column 6 of Table 3. The percentage of WOCB clearly appears to be positively and significantly correlated (at 1% level) to F100. This instrument has a significant effect on the percentage of WOCB after controlling for other firm characteristics and taking into ac-count the potential correlation between firm FE and these control variables and the initial condition problem. Moreover, we follow Andrews, Stock, and Sun (2019), who advised, as good practice, the use of Olea and Pflueger’s (2013) F-statistics for detecting weak instru-ments in overidentified, non-homoskedastic settings with one endogenous explanatory varia-ble. We compute the empirical counterpart of this F-statistic and report it in Table 3. The
val-10 The assessment of instrument suitability in the case of system GMM is based on Hansen's overidentifying
restrictions test.
It is well known that, due to internal instrument proliferation, this test is far too optimistic in the sense it rejects the null hypothesis in far too few cases. When the number of instruments is large, the overidentifying restrictions test may therefore fail
to indicate any misspecification or invalid instrumentation (Roodman, 2009a, b). For instance, this author gets p-values equal to 1 using simulations, even if the GMM system is invalid.
11 It is noticeable that, without collapsing internal instruments, a two-step system GMM leads to Hansen J-test
statistics with
ue obtained is 12.247, which is larger than the Staiger and Stock (1994) rule-of-thumb cutoff of 10. This value clearly indicates that the chosen instrument is relevant and cannot be con-sidered as weak. Consequently, the chosen instrument is relevant.
As emphasized by Wooldridge (2014), because instrument exogeneity involves the covari-ance between the instrument and the unobserved error in the firm performcovari-ance equation, we cannot generally hope to test this assumption. In the vast majority of cases, we must maintain the assumption of instrument exogeneity by appealing to economic behavior or introspection, as done by Reguera-Alvarado, de Fuentes, and Laffarga (2017). Nevertheless, instrument ex-ogeneity also means that the instrument should have no association with FP after endogenous explanatory variables and omitted variables have been controlled for. Put differently, Regu-era-Alvarado et al. (2017) noted that the chosen instruments must be uncorrelated with FP, except through variables that we control for. To check our chosen instrument exogeneity, we thus compute the correlation between F100 and the residual of the regression of ROA on WOCB, lagged ROA, and the control variables. The estimated correlation is about −0.021 and is not significantly different from zero (whereas the correlation between ROA and F100, alt-hough small, is significantly different from zero). Even if we do not have here a formal test as to the exogeneity of the chosen instrument, such as the Hansen overidentification test,12 this absence of a correlation seems to be in favor of exogeneity of F100. This result confirms the works of Reguera-Alvarado et al. (2017) that the visibility of a firm can be a good instrument for BGD.
Column 5 of Table 3 reports the augmented version of the Eq. [2] estimation where the possibility that the percentage of WOCB is endogenous is taken into account by the use of the estimated residual of the auxiliary regression as an additional explanatory variable. Our re-sults clearly show that WOCB must be considered as endogenous because an estimated first-step residual appears to be significantly different from zero using a bootstrapped robust stand-ard error. As such, the estimated coefficient of WOCB is positively and significantly different from zero (at the 1% significance level). Everything else being equal, a one standard deviation increase of WOCB would increase ROA by: 1.214 * 6.92% = 8.41%, an amount that is signif-icant.
Now consider the control variables we included in Eq. [2]. By definition, these control var-iables are introduced because they might control directly for confounding factors. In other words, these variables are added to the regression model to control for potential unobserved time-variant factors that may cause the causal variable, here WOCB, to be endogenous. The statistical requirement for this to work is that the distribution error term in Eq. [2] should be conditionally independent of the causal variable when introducing the control variables (Wooldridge, 2014). These latter may not have any causal interpretation, meaning that the interpretation of their impact may be wrong. Nevertheless, it should be noticed here that, con-sistent with previous studies (e.g. Adams and Ferreira, 2009), firm size has a negative and significant effect (at the 5% level) on FP in models 1, 2, and 5. This result suggests that larger firms have more complex activities and are more difficult for investors to monitor. As ex-pected, leverage is, in all models, negatively and significantly (at the 1% level) correlated to firm profitability, suggesting that leverage is not an efficient mechanism, in our sample firms, for reducing agency conflict in a firm. Our results are consistent with Isidro and Sobral (2015). Additionally, in all models, we find that firm growth is positively and significantly correlated to ROA (at the 1% level), which is consistent with Isidro and Sobral (2015). Final-ly, we notice that firm age is negatively and significantly correlated to ROA (at the 5% level), suggesting that FP fades with time (Green and Jame, 2013).
12 This test cannot be implemented here because we have only just-identification, that is, one instrument for one
Regarding board characteristics, we find that the coefficients for board size and board in-dependence are not significantly different from zero in almost every model. This is consistent with Adams and Ferreira (2009). Furthermore, we find that CEO duality is negatively and significantly correlated to ROA (at the 5% level) in model 5. Our results are consistent with agency theory (Fama and Jensen, 1983, Jensen, 1993), which considers that CEO duality has a negative effect on FP.
[Place Table 3 here] 4.2. Robustness checks
Following Campbell and Mínguez-Vera (2008) and Triana, Miller and Trzebiatowski (2013), we use the Blau index as an alternative measure of BGD. The Blau (1977) index of heterogeneity is measured as (1−
pi2), where p is the percentage of board members in i each category i (in this case, male and female directors). Blau’s index can range from 0 (i.e. all board members are male) to 0.50 (which occurs when there is an equal number of female and male directors). The Blau index of BGD ranges from 0.00 (i.e. no WOCB) to 0.50 (half of the board are female directors).According to panel A in Table 4, the average (median) value of the Blau index is 0.25 (0.28), which is significantly higher than those reported by Campbell and Mínguez-Vera (2008) and Triana et al. (2013): 0.05 and 0.19, respectively.13
Table 4 shows results similar to those in Table 3 when the Blau index was our measure of BGD: first, FP is still path-dependent because the coefficient related to one-year lagged ROA is found to be positively and significantly correlated to ROA (at the 1% level), regardless of the model considered. Second, once again, the Blau index must be considered as endogenous because an estimated first-step residual appears to be significantly different from using a bootstrapped robust standard error. As such, the estimated coefficient of the Blau index is positively and significantly different from zero (at the 1% significance level). Specifically, everything else being equal, a one standard deviation increase in the Blau index would in-crease ROA by 0.91 * 6.92% = 6.29%, an amount that is significant.
Regarding control variables, we find the same results as those presented in Tables 3.14 The findings in Tables 3 and 4 support those of Campbell and Mínguez-Vera (2008) that the per-centage of WOCB and the Blau index can be use as alternative measure of BGD. However, our results run counter to those of Solakoglu and Demir (2016), who argue that results may be affected by the measures of BGD used. It might be specific to their sample, because our find-ings indicate the opposite. However, this requires further investigation.
[Place Table 4 here]
Although Wintoki et al. (2012) thought that the use of Tobin’s Q as a measure of perfor-mance might be problematic, we estimate Eq. [2] using Tobin’s Q for robustness and compa-rability reasons similar to the existing empirical literature (e.g. Adams and Ferreira, 2009, Liu et al., 2014). Table 5 presents an excerpt of the results, which are qualitatively unchanged. In line with the base case analysis, in all models, we find that the coefficient on one-year lagged Tobin’s Q is positive and significant (at the 1% level) compared to a current Tobin’s Q,
what-13 As with WOCB, we checked the two conditions that F100 must meet as a potential instrument for the Blau
index. Olea and Pflueger’s (2013) F-statistics, whose value is 13.435, clearly shows the relevance of F100. Moreover, the estimated correlation between F100 and the residual regression of ROA on lagged ROA, the Blau index, and other control variables is −0.022 and is not significantly different from zero. This is in favor of
F100’s exogeneity.
ever the considered model. This suggests that past financial performance has a significant effect on current performance, as emphasized by Wintoki et al. (2012). Furthermore, in mod-els 17 and 23, we find that our measure of BGD (either the percentage of WOCB or the Blau index) is positively and significantly correlated to Tobin’s Q at the 1% level of significance. Thus, a one standard deviation increase in BGD would increase Tobin’s Q by 14.31% and 10.96%, respectively. Finally, unreported, we find similar results for control variables.15
[Place Table 5 here]
5. Concluding remarks
5.1. Conclusions
Claims that BGD improves FP are abundant in the business press and in academic litera-ture (Terjesen et al., 2009). However, there is no consensus in the literalitera-ture regarding the ef-fect of WOCB on FP, because the results are mixed (Post and Byron, 2015). This study seeks to shed light on this topic. Consistent with Wintoki et al. (2012) and Adams et al. (2009), we argue that not properly taking into account the problem of endogeneity that arises because of differences in unobservable characteristics across firms, reverse causality and dynamic en-dogeneity may induce erroneous inferences regarding the relationship between BGD and FP. The contrasting results mentioned by Post and Byron (2015) are probably explained by this observation. Accordingly, we pay careful attention to endogeneity issues that could mitigate the finding by using the CF method developed by Wooldridge (2015), instead of system GMM, which is classically used in the literature.
As emphasized by Roodman (2009b), the appeal of system GMM is based on the hope that this econometric technique would solve tough estimation issues in panel data modelling – fixed effects, endogeneity for regressors, and dynamic panel bias – in cases when good exter-nal instruments are lacking. Indeed, a large set of interexter-nal instruments can be built using all identifying moment conditions. But this is also the weaknesses in system GMM, namely, in-strument proliferation. Specifically, inin-strument proliferation creates some asymptotic results for system GMM estimators and makes related specification tests appear misleading. A large instrument number often leads to overfitting endogenous variables and weakening the Hansen J-test of the instruments’ joint validity (Andersen and Sørensen, 1996, Bowsher, 2002, Roodman, 2009b). Estimated variances of coefficients and the Hansen J-test can be too small, resulting in overfitting lagged dependent variables and too much confidence in the validity of internal instruments. Given that, one recommendation when dealing with the instrument pro-liferation issue is cautiousness when choosing internal instruments. Roodman (2009b) sug-gests restricting the number of lagged levels used in the instrument matrix, collapsing the in-strument matrix, or combining the two. In the end, as Roodman (2009b) very rightly empha-sizes, the system GMM might works but “under arguably special circumstances” (p. 156). Although attractive for addressing endogeneity issues, the system GMM approach might have serious limitations.
In this article, thanks to the availability of external instruments, we propose the CF method for addressing the endogeneity issue. Wooldridge (2010) defines CF as a proxy variable that renders an endogenous explanatory variable exogenous (when conditioned) in a regression. In essence, the CF approach is close to an IV approach.16 One of the CF’s attractions is the
sim-15 Results are available on request from the authors.
16 By definition, the CF approach is an instrumental variable approach and has been developed in econometric
literature at the same time as a conventional IV estimation method or classical 2SLS. The CF approach puts more structure in the reduced form of the endogenous explanatory variables than classical 2SLS. In the very simple setting of a linear regression model with endogenous explanatory variables estimated using
cross-ple re-specification of the model through the introduction of new regressors to control for endogenous explanatory variables, as well as the computational tractability this specification yields (Wooldridge, 2010, 2015). CF provides a useful alternative to a system GMM ap-proach. The CF approach might be easier to implement and is available in situations of in-strument proliferation, provided some effort is made to find external inin-struments.
Overall, we find that BGD is positively and significantly (at the 1% level) correlated to FP, whereas system GMM shows that the relationship is not significant at the 5% level (or be-low). The economic effect is higher when BGD is considered to be exogenous. Our study tempers the assertion of Adams and Ferreira (2009) and Ferreira (2015) that when the endog-enous characteristics of women’s representation on corporate boards are taken into account, the relationship is necessarily negative. Our findings do not support this assumption. We ar-gue that idiosyncratic characteristics of firms are likely to have a significant influence on the relationship between BGD and FP. Indeed, our results may be influenced by the critical mass of WOCB (Joecks, Pull and Vetter, 2013, Konrad, Kramer and Erkut, 2008). Critical mass theory (Kanter, 1977) suggests that the interactions within a group depend fundamentally on the size of the group. When a sub-group size reaches a certain threshold, or critical mass, the influence of this sub-group increases significantly. As shown in Table 2, the mean percentage of WOCB is about 16% (vs. 8.50% for Adams and Ferreira, 2009), with 21% of firms in the sample having at least three women on their corporate board. Joecks et al. (2013) argue that critical mass is a key component in assessing the relationship between BGD and FP. Conse-quently, different firms’ idiosyncrasies may alter the link.
Consistent with Wintoki et al. (2012), we also find that past performance has a significant effect on the relationship between BGD and FP, confirming the claim of these authors regard-ing dynamic endogeneity. Our findregard-ings confirm the results of Farrell and Hersch (2005), who find a positive relationship between ROA and the likelihood of appointing a higher proportion of female directors to boards. Our study confirms some previous studies on the positive link between BGD and FP (e.g. Liu et al., 2014, Reguera-Alvarado et al., 2017).
Consequently, this article offers new insights regarding the relationship between BGD and FP (ROA and Tobin’s Q) resulting from new US data and an alternative econometric ap-proach (the CF method).
5.2. Implications
Our results offer some managerial insights and policy implications. First, we support, to some extent, the business case for BGD, since we find a positive and significant relationship between BGD and firm profitability. Second, our findings suggest that firms should have a more efficient view regarding having WOCB, as we show that a greater proportion of WOCB creates value of, more or less, 3% on ROA. This increase in firm economic performance is often accompanied by greater visibility and commitments to CSR, which in turn affects CSP (Boulouta, 2013). Third, this research has strong implications for both governments and law-makers (market regulators), as well as shareholders and fund managers, in terms of enhancing public decision-making towards BGD and portfolio management.
5.3. Limitations
sectional data, the two approaches produce similar estimated values. In this setting, the main advantage of CF when compared to classical 2SLS is that the test of the null hypothesis that an explanatory variable suspected to be endogenous is exogenous reduces in the simple heteroskedastic-robust test of significance of the parameter associated with a first-stage residual in an augmented regression model. The traditional form of the Hausman test that directly compares OLS and 2SLS is substantially harder to make robust to heteroskedasticity. This ad-vantage becomes all the more interesting when considering more complex models.
Our study is not without limitations. First, we analyze the impact of BGD on firm profita-bility in the US context (English-origin countries; see La Porta, Lopez-de-Silanes, Shleifer and Vishny, 1998). Grosvold and Brammer (2011) argue that institutional, cultural and politi-cal systems are important when analyzing the relationship between BGD and FP. Hence, fur-ther cross-country studies are necessary to confirm (or dispute) our findings, as they might be driven by national specificities. Second, our study focuses on the largest US listed companies in the S&P 500 index. Further studies are needed on small- and medium-sized firms, entre-preneurial and private equity firms, and public sector firms and non-profit organizations, since they are significantly different (e.g. in terms of capital structure or ownership). The differ-ences may significantly affect the relationship between BGD and FP.
References
Adams RB, Women on boards: The superheroes of tomorrow? The Leadership Quarterly 2016;27; 371-386
Adams RB, Almeida H, Ferreira D, Understanding the relationship between founder-CEOs and firm performance. Journal of Empirical Finance 2009;16; 136-150
Adams RB, Ferreira D, Women in the boardroom and their impact on governance and performance. Journal of Financial Economics 2009;94; 291-309
Adams RB, Funk P, Beyond the glass ceiling: Does gender matter? Management Science 2012;58; 219-235
Adams RB, Haan J, Terjesen S, Ees H, Board diversity: Moving the field forward. Corporate Governance: An International Review 2015;23; 77-82
Adams RB, Hermalin BE, Weisbach MS, The role of boards of directors in corporate governance: A conceptual framework and survey. Journal of Economic Literature 2010;48; 58-107
Ahern KR, Dittmar AK, The changing of the boards: The impact on firm valuation of mandated female board representation. Quarterly Journal of Economics 2012;127; 137-197 Andersen TG, Sørensen BE, GMM estimation of a stochastic volatility model: A Monte Carlo study. Journal of Business & Economic Statistics 1996;14; 328-352
Anderson JC, Reeb DM, Founding‐family ownership and firm performance: evidence from the S&P 500. Journal of Finance 2003;58; 1301-1328
Andrews I, Stock JH, Sun L, Weak instruments in instrumental variables regression: Theory and practice. Annual Review of Economics 2019;11; 727-753
Ashforth BE, Mael F, Social identity theory and the organization. Academy of management review 1989;14; 20-39
Bart C, McQueen G, Why women make better directors. International Journal of Business Governance and Ethics 2013;8; 93-99
Baum CF. An introduction to modern econometrics using Stata. Stata Press: Texas; 2006. Bebchuk LA, Cohen A, The costs of entrenched boards. Journal of Financial Economics 2005;78; 409-433
Bhagat S, Bolton B, Corporate governance and firm performance. Journal of Corporate Finance 2008;14; 257-273
Blau PM. Inequality and heterogeneity: a primitive theory of social structure. Collier Macmillan: New York; 1977.
Blundell R, Bond S, Initial conditions and moment restrictions in dynamic panel data models. Journal of Econometrics 1998;87; 115-143
Bond SR, Dynamic panel data models: a guide to micro data methods and practice. Portuguese Economic Journal 2002;1; 141-162
Boone AL, Field LC, Karpoff JM, Raheja CG, The determinants of corporate board size and composition: An empirical analysis. Journal of Financial Economics 2007;85; 66-101
Boulouta I, Hidden connections: The link between board gender diversity and corporate social performance. Journal of Business Ethics 2013;113; 185-197
Bowsher CG, On testing overidentifying restrictions in dynamic panel data models. Economics Letters 2002;77; 211-220
Byron K, Post C, Women on goards of directors and corporate social performance: A meta‐analysis. Corporate Governance: An International Review 2016;24; 428-442
Campbell K, Mínguez-Vera A, Gender diversity in the boardroom and firm financial performance. Journal of Business Ethics 2008;83; 435-451
Carleton WT, Nelson JM, Weisbach MS, The influence of institutions on corporate governance through private negotiations: Evidence from TIAA‐CREF. Journal of Finance 1998;53; 1335-1362
Carpenter MA, The implications of strategy and social context for the relationship between top management team heterogeneity and firm performance. Strategic Management Journal 2002;23; 275-284
Carrasco A, Francoeur C, Labelle R, Laffarga J, Ruiz-Barbadillo E, Appointing women to boards: is there a cultural bias? Journal of Business Ethics 2015;129; 429-444
Carter DA, D'Souza F, Simkins BJ, Simpson WG, The gender and ethnic diversity of US boards and board committees and firm financial performance. Corporate Governance: An International Review 2010;18; 396-414
Chamberlain G 1984. Panel data. In: Z Griliches, M Intriligator (Eds), Handbook of Econometrics, vol. 2, Handbook of Econometrics, vol. 2. Academic Press: New York; 1984. p. 1247-1318.
Chan SH, Martin JD, Kensinger JW, Corporate research and development expenditures and share value. Journal of Financial Economics 1990;26; 255-276
Coles JL, Daniel ND, Naveen L, Boards: Does one size fit all? Journal of Financial Economics 2008;87; 329-356
Daily CM, Certo ST, Dalton DR, A decade of corporate women: Some progress in the boardroom, none in the executive suite. Strategic Management Journal 1999;20; 93
Dang R, Bender A-F, Scotto M-J, Women on French corporate board of directors: How do they differ from their male counterparts? Journal of Applied Business Research 2014;30; 489-507
Davidson R, MacKinnon JG, Bootstrap tests: How many bootstraps? Econometric Reviews 2000;19; 55-68
Dezsö CL, Ross DG, Does female representation in top management improve firm performance? A panel data investigation. Strategic Management Journal 2012;33; 1072-1089 Dickson PR, Ginter JL, Market segmentation, product differentiation, and marketing strategy. Journal of Marketing 1987;51; 1-10
DiMaggio PJ, Powell WW, The iron cage revisited: Collective rationality and institutional isomorphism in organizational fields. American Sociological Review 1983;48; 147-160 Dutton JE, Duncan RB, The creation of momentum for change through the process of strategic issue diagnosis. Strategic Management Journal 1987;8; 279-295
Eagly AH, Johannesen‐Schmidt MC, The leadership styles of women and men. Journal of Social Issues 2001;57; 781-797
Eagly AH, Johannesen‐Schmidt MC, Van Engen ML, Transformational, transactional, and laissez-faire leadership styles: a meta-analysis comparing women and men. Psychological Bulletin 2003;129; 569