HAL Id: hal-01514067
https://hal.archives-ouvertes.fr/hal-01514067
Submitted on 5 May 2017
HAL is a multi-disciplinary open access
archive for the deposit and dissemination of
sci-entific research documents, whether they are
pub-lished or not. The documents may come from
teaching and research institutions in France or
abroad, or from public or private research centers.
L’archive ouverte pluridisciplinaire HAL, est
destinée au dépôt et à la diffusion de documents
scientifiques de niveau recherche, publiés ou non,
émanant des établissements d’enseignement et de
recherche français ou étrangers, des laboratoires
publics ou privés.
Implementing the DPSIR framework to link water
quality of rivers to land use: methodological issues and
preliminary field test
Nathalie Lalande, Flavie Cernesson, Aurélia Decherf, Marie-George Tournoud
To cite this version:
Nathalie Lalande, Flavie Cernesson, Aurélia Decherf, Marie-George Tournoud. Implementing the
DPSIR framework to link water quality of rivers to land use: methodological issues and preliminary
field test. International Journal of River Basin Management, Taylor & Francis, 2014, 12 (3),
pp.201-217. �10.1080/15715124.2014.906443�. �hal-01514067�
Implementing the DPSIR framework to link water quality of rivers to land use:
methodological issues and preliminary field test
NATHALIE LALANDE, IRSTEA/Cemagref, UMR TETIS, F-34093 Montpellier, France. Email: nathalie.lalande@ teledetection.fr (author for correspondence)
FLAVIE CERNESSON, AgroParisTech, UMR TETIS, F-34093 Montpellier, France. Email: flavie.cernesson@ teletedection.fr
AURE´LIA DECHERF, IRSTEA/Cemagref, UMR TETIS, F-34093 Montpellier, France. Email: aurelia.decherf@ teletedection.fr
MARIE-GEORGE TOURNOUD, Universite´ Montpellier 2, UMR HSM, 34095 Montpellier, France. Email: marie- george.tournoud@univ-montp2.fr
1 Introduction
One of the main objectives of the US Clean Water Act (1972) and the European Water Framework Directive (2000) is to maintain or restore the chemical, physical and biological integrity of surface waters. Surface waters are indeed very vulnerable to diffuse and point source pollutions, water abstractions and mor- phological alterations. Moreover, water managers have to prove
from now on the efficiency of the actions they took in this context (Gergel et al. 2002). Water policies implementation is thus ambi- tious: the complexities of the hydrosystems and of the processes that govern them require indeed new thorough knowledge and elaborated methods. Several metrics, indices and indicators have been created by scientists and managers to assess the bio- logical integrity of rivers (Hawkins et al. 2000). But water man- agers still need operational tools to assess the influence of human
activities on river (Frissell et al. 1986). The different human activities (housing environment, farming, industries, transports, navigation, recreational activities, etc.) are generating pressures on surface waters and hydrosystems. These pressures are often numerous and all the more difficult to qualify if we work on large territories. If certain industrial, domestic and urban press- ures could be determined from data of disposals in the environ- ment, diffuse pollutions of any origin are connected with areal sources and with a mode of transfer which is necessarily spatia- lized. Physical alterations also imply spatialized impacts along river networks.
Quantifying human activities using land-use indicators is the main objective of the landscape approach (Johnson and Host 2010). ‘Landscape ecology emphasizes the interaction between spatial pattern and ecological process’ (Gergel et al. 2002). Land-use indicators are commonly accepted as a good predictor of physical and biological integrity of aquatic ecosystems (Karr 1991, Allan et al. 1997). Besides, land-use data are spatially defined, quite homogeneous and easily available. Recent review made by Johnson and Host (2010) shows the historical evolution and the growing importance of studies linking land- use indicators to river quality.
However, the nature and the intensity of the relationships between land use and ecological responses are difficult to estab- lish because of the high variety of land uses, processes and scales, but also because of the dynamics of changes (climate, hydrologi- cal regime and land uses) and their consequences that may take decades to stabilize (Gergel et al. 2002, Vondracek et al. 2005). The importance of riparian land use has been stressed since 1975 by Hynes (Allan 2004b) and through the river continuum concept proposed by Vannote et al. (1980). Ward (in Johnson and Host 2010) defines four dimensions to describe interactions between rivers and their surrounding environment: (1) longitudi- nal connection, (2) lateral connection, (3) vertical exchange between the channel and ground water and (4) temporal dynamics. The oriented and hierarchical nature of the river network raises many questions around the nested scales of analy- sis. If different scales are clearly identified in the literature, the effects of contamination by neighbourhood or by upstream – downstream propagation are still poorly understood.
Three main scales for linking land-use indicators to river quality at a given location (Morley and Karr 2002, Allan 2004b) are usually described as:
(1) the micro-scale, which concerns land uses in the vicinity of the studied location of a few metres to a few hundreds of metres. Land uses at this scale influence in stream habitat (food, physical habitat, thermal conditions, etc.);
(2) the meso-scale, which corresponds to land uses on the banks of the river segment upstream. The meso-scale studies are necessary to assess the diversity and the abundance of these local habitats;
(3) the macro-scale that describes land uses in the upstream catchment. The macro-scale defines the major environmental
characteristics (hydrology, climate, geology and relief) and thus the major characteristics of rivers (water temperature, energy sources, pH and flow regime).
Assessing the scale at which land uses most affect river func- tioning is still an outstanding issue. Some authors favour the micro-scale and the meso-scale that directly influence the charac- teristics of local biotic habitats (Lammert and Allan 1999), whereas others favour the catchment scale that imposes an overall context of pressure (or no pressure) on the river network (Roth et al. 1996, Allan et al. 1997). For example, two studies on similar agricultural catchments show opposite results: assemblages of invertebrates are best explained by upstream catchment land uses in Roth et al. (1996) and by local habitat in Dovciak and Perry (2002). Some authors con- clude that both catchment and local scale land use explained sig- nificant variations of water quality (Stewart et al. 2001, Gergel et al. 2002, Meador and Goldstein 2003, Allan, 2004a, 2004b, Vondracek et al. 2005).
It is thus necessary to gather two kinds of information: the land use in the uspstream catchment (for the macro-scale analy- sis) and the land use in riparian areas (for the micro-scale and meso-scale analyses).
Linking land use and river water quality at these three spatial scales is not sufficient to describe such complexity because of:
. the effect of temporal changes. In fact, the literature points out
the role of past land use on the current river water quality (Harding et al. 1998) but, in practice, the distinction between past and present impacts is very difficult to do;
. the influence of regulation actions. Regulation actions could also enhance or modulate the effect of land uses on river water quality (Strayer et al. 2003). The complexity of this issue is reinforced by the great number of stakeholders involved in water management, who all have specific but different needs, objectives and scales of action.
A systemic approach as the driving forces – pressures – state – impacts – responses (DPSIR) framework, promoted by the Euro- pean Environmental Agency (European Environmental Agency 1999), is proved to be a useful tool to manage such a complex issue (Kristensen 2004, Carr et al. 2007, Crouzet et al. 2009). DPSIR has been created for implementing environmental pol- icies and widely used in river basin management (Benini et al. 2010). It is an indicator-based approach that allows a systemic explanation of the links between environmental metrics. The application of the DPSIR framework cannot be separated from the decision cycle that is at the basis of the elaboration of environmental policies (Acreman 2005).
The objective of our paper is to present a methodology to assess influences of land uses on river ecological quality. The methodology aims (i) to take into account the complexity of the processes involved and (ii) to set in the successive steps of a decision cycle. The goal is to focus on the issues met during the building of the methodology, more exactly, during the
definition and the elaboration of the required knowledge and to apply the methodology on a study site. The first step of our meth- odology consists in adapting the DPSIR framework to our specific issue, DPSIR for land use and river ecosystems: DPSIR-LURE. We deal with the availability of data and according the decision cycle. The second step aims to select well-adapted environmental indicators, by analysing literature review, in accordance with water stakeholders. At the end, a test is carried out on the Ognon catchment (located to the north-east part of France) and discussed.
2 Method
2.1 Conceptual DPSIR framework and decision cycle
The DPSIR model provides a framework for systematic analysis of environmental issues which does not seek to establish a deep understanding of the detailed operations of the system but rather considers a global understanding of the cause – effect relation- ships (European Environmental Agency 1999, Balestrat 2011).
The DPSIR framework divides a given environmental issue into five compartments. The driving forces ‘D’ represent social, economic, more generally, human activities and climate con- ditions. They generate pressures ‘P’ that can be biological, chemi- cal and physical. Pressures influence the state ‘S’ of the hydrosystems. State changes lead to impacts ‘I’, which is a multi- dimensional concept involving economical, social and environ- mental aspects. Responses ‘R’ represent actions by society and policies makers to answer to environmental issues. These actions consist in elaborating and implementing regulations, plan- ning documents or economic instruments. Actions also include the emergence of technical innovations and changes of behaviour.
Implementing such a conceptual framework on a given environmental issue implies to follow a rigorous process and to set in a decision cycle. The decision cycle (Figure 1) starts from the problematization of the issue to the final decision through three phases: inventory, diagnostic and guidance. It leads to the identification of a pool of potential actions.
The inventory phase aims to identify a pool of descriptors able to characterize as well as possible the D – P – S – I compartments of the DPSIR framework. This task involves (i) to identify the indicators of the driving forces and their resulting pressures that influence the environmental system and (ii) to characterize the current state and their potential impacts on the studied system. During this inventory, data must be gathered and struc- tured according to the given environmental issue. The type of the data depends both on the objectives of the study and on the type of the final decision. At the end of this phase, the initial environmental issue has been translated into a pool of indicators that constitute the original knowledge.
The second phase of the decision cycle is the diagnostic phase. This phase aims to assess the links between the D – P – S – I compartments, which means (1) between S and P
compartments to rank the causes of the observed degradation and (2) between I and P compartments to work on the effects of pressures. This diagnostic phase involves the knowledge and expertise of stakeholders and modelling (statistical and numerical models). It leads to an accurate identification of pro- blems and defined objectives for managers.
Finally the guidance phase, the last phase, aims to identify all potentially interesting actions to solve the targeted problems. This phase corresponds to the Responses compartment. It leads to a panel of tools and the timetable of potential actions for man- agers such as regulatory instruments, technical and financial sol- utions. Temporal dimensions of the implementation of the DPSIR happen in the guidance phase because the managers must take into account the past and future actions: the already done actions before the inventory phase and the proposed ones after the diagnostic phase. The pool of potential actions that arise from the guidance phase, helped by the main results of the two previous phases, must be synthesized by the managers before the final decision step.
Feedbacks appear in this decision cycle. Different scenarios can be tested to assess the relevance of the results of diagnosis, leading to feedback from the guidance to the assessment. The R compartment feedbacks on all other compartments of the DPSIR framework can be evaluated through monitoring of the pool of indicators. This brings updated knowledge and re-starts the decision cycle.
2.2 D – P – S – I compartments for the inventory phase
The inventory phase is the one we focused on in this study. Our environmental issue aims at assessing human influences on the water quality of rivers. So, we limit the inventory of driving forces to human activities, and we assume that they can be ‘easily’ characterized by land-use data. In other words, we do not take into account the economic and social aspects. Pressures that are characterized by land-use classes and geo- metric characteristics represent a ‘pollution package’ that can be positive (forest for example) or negative (urban for example) for the river system. We do not use biophysical models or flux quantification methods from field investigations to quantify diffuse pressures on rivers. Moreover, point pressures (wastewater treatment plants and industries) are not considered in our study. The state of the river is estimated by a bioindicator, instead of a physicochemical parameter, which allows assessing the effects of a wider range of pressures. Impacts on river water quality are translated by standardized state bioindicators, using reference values at pristine locations, according to the European water framework directive recommendations.
So an adapted DPSIR framework is used in this study to cope with our environmental issue (Figure 2).
For each compartment or group of compartments, we adopt a similar approach to build the system of indicators. The indicators are first selected according to the literature. The selection of
Figure 1 The decision cycle.
indicators takes into account their spatial and temporal avail- ability in the current databases, keeping in mind the statistical meaning of the indicators in terms of accuracy, reliability and robustness, in relation with the resolution, spreading scale and update frequency of the databases. Finally, the selected indi- cators are validated by experts and operational water managers.
2.2.1 Driving forces and pressures
Driving forces are considered, in our study, to be perfectly described by land use. In the literature (Johnson and Host 2010) three main land uses are identified for their effect on
river functioning: natural and semi-natural areas, agricultural areas and artificial areas.
Natural vegetation as forests and grasslands play a filter role for sediments, nutrients (phosphorus and nitrogen) and pesti- cides by catching them during runoff periods. Roots of herbac- eous vegetation and trees increase channel stability and banks roughness; so they reduce channel erosion. Natural areas along river networks are also of great interest for flood spreading and for flood dynamics reducing. Natural vegetation and particularly forest on stream banks provide food and habitats for river fauna and moderate water light and temperature (Naiman et al. 1993,
Osborne and Kovacic 1993, Barling and Moore 1994, Maridet 1995, Roth et al. 1996).
Agricultural land uses can lead to nonpoint-source pollutant losses as sediments and nutriments. Particulate inputs increase turbidity, alter substrate suitability and disrupt primary pro- duction and food quality (Walser and Bart 1999, Allan 2004b). They also reduce aquatic and terrestrial habitat diversity (absence of roots, tree and woody debris) and fill aquatic habitats by sediments and fines (Roth et al. 1996, Allan and Johnson 1997, Schuft et al. 1999, Buck et al. 2004, Allan 2004b). The presence of strips of natural vegetation with grass and riparian trees can drastically reduce runoff inputs up to 70% for sediments and 95% for nutriments (Lowrance et al. 1984, Peterjohn and Correll 1984, Barling and Moore 1994, Vought et al. 1994). Finally, when agricultural land uses extend down to the river, the bank stability decreases.
Urban land use and associated areas (industrial zones, quar- ries, roads, etc.) define artificial land uses. Urban areas are not the largest but are the most harmful for rivers (Osborne and Wiley 1988, Paul and Meyer 2001, Sponseller et al. 2001, Morley and Karr 2002). Roy et al. (2003) found that urban areas alone explained 29 – 38% of the variation in some macro- invertebrate indices. The main issue with artificial areas is the increase in soil imperviousness that modifies the water cycle, decreasing infiltration and increasing runoff. These processes intensify the frequency and the severity of floods. Stream chan- nels are modified by these changes in discharge, and channel erosion is enhanced including increased bank and stream bed incision (Arnold and Gibbons 1996, Snyder et al. 2005). Runoff loads rivers with specific pollutants such as heavy metals, oil, pesticides, road gritting and organic materials (Stepe- nuck et al. 2002). The effect of artificial land uses can be so intense that Wang and Kanehl (2003) proposed as land-use indi- cators the areas of urban and non-urban zones in the upstream catchment. Most of the studies consider artificial land uses as a whole. Yet, some studies show the interest of distinguishing arti- ficial land-use classes. Schuft et al. (1999) separate four kinds of artificial land uses as residential areas, roads and railroads, indus- trial and commercial areas and other artificial land uses (e.g. cemeteries, golf course and parks) to determine the effect of riparian areas on the river ecological condition. Roy et al. (2003) find better correlation values between macro-invert- ebrates variables and differentiated urban land-use metrics rather than with global urban land-use metrics. Other authors use impervious areas or rates rather than artificial land-use classes.
To build pressure indicators (P-indicators) on each kind of land use, the literature review identifies three spatial scales, pro- moted by Allan and Johnson (1997) and by Allan (2004b).
Natural land-use P-indicators are correlated with river quality at the three spatial scales (Table 1). Numerous studies highlight the role of natural vegetation and forest at the macro-scale (Steedman 1988, Richards et al. 1996, Wang et al. 1997, Walser and Bart 1999, Bis et al. 2000). For the meso-scale,
authors favour quite short distances of influence, from 10 to 50 m (Wenger 1999, Lattin et al. 2004, Snyder et al. 2005).
Numerous studies illustrate alterations of river systems and communities, caused by agricultural land use on the macro- scale (Table 2). On the meso-scale, studies find interactions between rivers and agricultural land uses on narrow buffers (20 – 50 m wide). These buffers illustrate the direct effects of the contact between crops and rivers without grass strips or ripar- ian trees. Wider buffers of agricultural land use are also found in the literature: they highlight the dominance of crops in surround- ings of the river.
According to the literature, macro-scale and meso-scale are the most relevant for linking artificial land uses P-indicators with river characteristics and water quality (Table 3).
As shown in Tables 1 – 3, very few studies propose the micro- scale P-indicators. Numerous studies provide the width (set per- pendicular to the river banks) of the land-use indicators they use, but few of them give the effective dimensions in the longitudinal direction, except studies focused on natural land uses. Indeed natural vegetation and particularly trees play a major role in the river local conditions: food, physical habitat, filter, etc. Frim- pong et al. (2005) found that 30 m width from banks and 600 m upstream length are the optimal dimensions to define relevant riparian forest indicators. Sponseller et al. (2001) found the same optimal width but a shorter length: they retain 200 m upstream length on their nine studied basins for the same indicator.
Finally, it is worth noting that the literature is often vague about land-use nomenclature. This is particularly true for her- baceous areas, grasslands and pasture for which it is not clear if they are considered as agricultural or natural areas. It is important to highlight that as Piechnik et al. (2012) explained, grazed pastures can be critical source areas because of the accumulation of nutrients from animal excrements but also because of the trampling which reduces vegetation cover and increase soil compaction. These critical source areas are rela- tively small areas yet they contribute to high proportions of pol- lutant loads to nearby rivers.
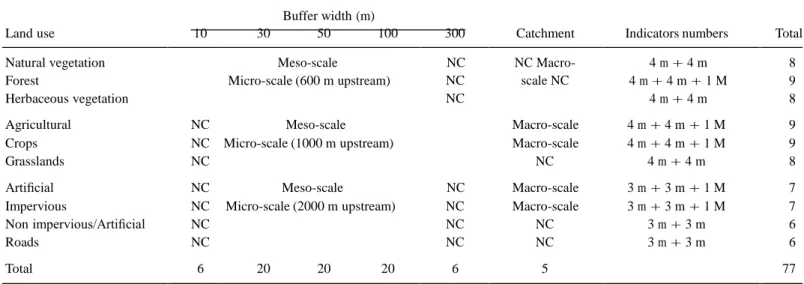
For our purpose, we adopt a collection of 79 P-indicators (Table 4) declined in three main kinds of land uses:
. three agricultural land-use classes: (i) crops and grasslands,
(ii) strictly crops and (iii) grasslands;
. three natural land-uses classes: (i) natural vegetation including forest, herbaceous areas and grasslands, (ii) strictly forest and (iii) herbaceous vegetation without grasslands;
. four urban and associated land-uses classes: (i) all artificial areas (ii) strictly impervious areas, (iii) non impervious artifi- cial areas and (iv) strictly roads.
2.2.2 State and impact
As explained before, each driving force (in our case, each land use) produces a specific pool of pressure (such as diffuse
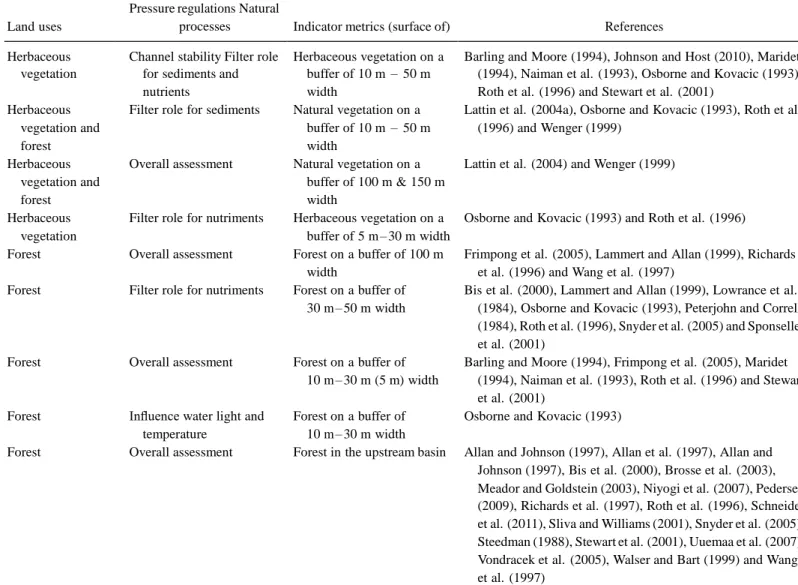
Table 1 P-Indicators of natural and semi-natural land uses
Land uses
Pressure regulations Natural
processes Indicator metrics (surface of) References
Herbaceous Channel stability Filter role Herbaceous vegetation on a Barling and Moore (1994), Johnson and Host (2010), Maridet vegetation for sediments and buffer of 10 m – 50 m (1994), Naiman et al. (1993), Osborne and Kovacic (1993),
nutrients width Roth et al. (1996) and Stewart et al. (2001)
Herbaceous Filter role for sediments Natural vegetation on a Lattin et al. (2004a), Osborne and Kovacic (1993), Roth et al. vegetation and buffer of 10 m – 50 m (1996) and Wenger (1999)
forest width
Herbaceous Overall assessment Natural vegetation on a Lattin et al. (2004) and Wenger (1999) vegetation and buffer of 100 m & 150 m
forest width
Herbaceous Filter role for nutriments Herbaceous vegetation on a Osborne and Kovacic (1993) and Roth et al. (1996) vegetation buffer of 5 m – 30 m width
Forest Overall assessment Forest on a buffer of 100 m Frimpong et al. (2005), Lammert and Allan (1999), Richards width et al. (1996) and Wang et al. (1997)
Forest Filter role for nutriments Forest on a buffer of Bis et al. (2000), Lammert and Allan (1999), Lowrance et al. 30 m – 50 m width (1984), Osborne and Kovacic (1993), Peterjohn and Correll
(1984), Roth et al. (1996), Snyder et al. (2005) and Sponseller et al. (2001)
Forest Overall assessment Forest on a buffer of Barling and Moore (1994), Frimpong et al. (2005), Maridet 10 m – 30 m (5 m) width (1994), Naiman et al. (1993), Roth et al. (1996) and Stewart
et al. (2001)
Forest Influence water light and Forest on a buffer of Osborne and Kovacic (1993) temperature 10 m – 30 m width
Forest Overall assessment Forest in the upstream basin Allan and Johnson (1997), Allan et al. (1997), Allan and Johnson (1997), Bis et al. (2000), Brosse et al. (2003), Meador and Goldstein (2003), Niyogi et al. (2007), Pedersen (2009), Richards et al. (1997), Roth et al. (1996), Schneider et al. (2011), Sliva and Williams (2001), Snyder et al. (2005), Steedman (1988), Stewart et al. (2001), Uuemaa et al. (2007), Vondracek et al. (2005), Walser and Bart (1999) and Wang et al. (1997)
Note: Overall assessment means authors study the impact of natural land use without specifying a precise function.
Table 2 P-Indicators of agricultural land uses
Land uses Pressures Indicator metrics (surface of) References Agricultural land uses Agricultural land uses Agricultural land uses Agricultural land uses Agricultural land uses Overall assessment Overall assessment Overall assessment Overall assessment Overall assessment
Agricultural areas on a buffer of 20 m width
Agricultural areas on a buffer of 50 m width
Agricultural areas on a buffer of 100 m width
Agricultural areas on a buffer of 200 m – 500 m width Agricultural areas on the
upstream basin
Frimpong et al. (2005), Perry et al. (1999) and Stewart et al. (2001) Lammert and Allan (1999), Meador and Goldstein (2003), Roth et al. (1996)
and Sparovek et al. (2002)
Richards et al. (1996), Vondracek et al. (2005) and Wang et al. (1997) Johnson and Host (2010)
Allan and Johnson (1997), Bis et al. (2000), Cuffney et al. (2000), Johnson and Gage (1997), Johnson and Host (2010), Meador and Goldstein (2003), Roth et al. (1996), Walser and Bart (1999) and Walsh and Wepener (2009)
Note: Overall assessment means authors study the impact of natural land use without specifying a precise function.
pollution, erosion, etc.) that affects the physicochemical biologi- cal conditions in the river. So, we choose a state indicator (S-indi- cator) sensitive to all kinds of pressures. According to Gergel
et al. (2002) traditional S-indicators for monitoring rivers have a variety of benefits and weaknesses but bioindicators may be able to integrate many changes in catchment conditions over
Table 3 P-Indicators of artificial land uses
Land uses Pressures Indicator metrics (surface of) References Artificial land use Overall assessment Artificial areas on a buffer of
10 m – 30 m width
Artificial land use Overall assessment Artificial areas on a buffer of 50 m width
Artificial land use Overall assessment Artificial areas on a buffer of 100 m – 150 m width
Stewart et al. (2001) and Wang and Kanehl (2003) Roth et al. (1996)
Johnson and Host (2010), Maridet (1995), Paul and Meyer (2001) and Richards et al. (1996)
Artificial land use Overall assessment Artificial areas in the upstream basin Allan (2004a), Arnold and Gibbons (1996), Meador and Goldstein (2003), Osborne and Wiley (1988), Paul and Meyer (2001), Roy et al. (2003), Stewart et al. (2001), Wang and Kanehl (2003) and Wang et al. (1997) Road Morphology
modification Diffuse pollution
Roads areas on a buffer of 10 m – 300 m width
Schuft et al. (1999)
Impervious area (urban, road, etc.) Impervious area
(urban, road, etc.) Rate of
Overall assessment Impervious areas on a buffer of 30 m width
Overall assessment Impervious areas in the upstream basin
Infiltration Rate of natural areas inside artificial
Snyder et al. (2005) and Wang and Kanehl (2003) Klein (1979), Snyder et al. (2005) and Wang and Kanehl
(2003)
Schuft et al. (1999) imperviousness Surface runoff
Filter role for sediment and nutrients
areas on the buffer of 50 m – 300 m width
Rate of
imperviousness
Overall assessment Rate of transportation area on Recreational area in the upstream basin
Stepenuck et al. (2002) and Wang and Kanehl (2003)
Note: Overall assessment means authors study the impact of natural land use without specifying a precise function.
Table 4 Selected P-indicators per land use and per scale
Buffer width (m)
Land use 10 30 50 100 300 Catchment Indicators numbers Total Natural vegetation Forest Herbaceous vegetation Meso-scale Micro-scale (600 m upstream) NC NC NC NC Macro-scale NC 4 m + 4 m 4 m + 4 m + 1 M 4 m + 4 m 8 9 8 Agricultural NC Meso-scale Macro-scale 4 m + 4 m + 1 M 9 Crops NC Micro-scale (1000 m upstream) Macro-scale 4 m + 4 m + 1 M 9
Grasslands NC NC 4 m + 4 m 8
Artificial NC Meso-scale NC Macro-scale 3 m + 3 m + 1 M 7 Impervious NC Micro-scale (2000 m upstream) NC Macro-scale 3 m + 3 m + 1 M 7 Non impervious/Artificial NC NC NC 3 m + 3 m 6
Roads NC NC NC 3 m + 3 m 6
Total 6 20 20 20 6 5 77
Note: NC, no calculation.
time. Thus, a single value represents in fact a long time assess- ment. This is why we select bioindicators as S-indicators rather than physicochemical ones: pressures decreased biota diversity and increase pollution-tolerant and generalist species as explained by Delong and Brusven (1998).
Numerous studies have shown the interest of analysing invertebrate metrics to assess the multi-scale impacts of land uses on rivers (Dovciak and Perry 2002). In France, the most abundant invertebrate indicator is called biological index global standardized (IBGN) and concerns benthic
macro-invertebrates (AFNOR 1992, 2004). It is based on the abundance and the selective sensitivity of river benthic invertebrates to stresses (flow, substrate, dissolved substances, temperature, light, pH, turbidity, etc.). The IBGN index is mainly used to monitor organic pollution, but it could also indicate the presence of chemical or toxic substances or local habitat deterioration (AFNOR 1992, 2004, Lafont 2001, Wasson et al. 2006). IBGN measurements consist of a series of invertebrates sampling, counting and identification. The protocol leads to an index, which is an integer value between 0 and 20 (Archaimbault et al. 2010). IBGN data are thus used here as S-indicators.
Impact indicator (I-indicator), analysed through the environ- mental aspect, is the ecological quality ratio (EQR) IBGN accord- ing to the French water law. It corresponds to a standardized IBGN value and is defined as: (IBGN-1)/(REF-1), with IBGN being the value of the S-indicator at the given location and the REF value depends on hydro-e´coregion which is anabiotic classifi- cation of territories based on geology, relief and climate.
2.3 R-compartment for the first step of the guidance phase
Since our goal was to test a methodology for building a system of indicators able to cope with a given environmental issue, we do not take on the diagnosis phase. We directly jump from the inventory phase to the guidance one and for building a first pool of indicators of the R-compartment.
R-indicators will be based on regulations and existing plan- ning documents. These documents define the frame of the societal answer and they are easily accessible.
The analysis of various policies allows us to identify the actions that have or will have a direct influence on land use. Local policies consist in adapting national or international acts, in elaborating local planning and in defining actions that can pre- serve, restore or force land-use patterns. Policies relate to the domains of water, biodiversity, flooding and agriculture. Usually, for these domains, the implementation of regulations leads to zoning. Planning documents include maps compiling diagnoses and objectives, and inventory measures. Two kinds of R-indicators can be identified: (i) zones under conservation policies, such as natural areas of high ecological interest (wetlands for example) or zones that are highly vulnerable to flooding and (ii) zones where actions are susceptible to be taken (agri-environmental measures for example). It is also inter- esting to add, as third R-indicator, issued from the inventory of zones where actions have already been set and, if possible, whose effectiveness has been assessed according to the method- ology proposed by Palmer et al. (2005, 2011) The study of avail- able diagnoses from planning documents may not be enough to build this R-indicator: it should be completed using surveys with water managers or field inventories. Nevertheless, in France, collecting such data in an exhaustive way seems difficult.
To conclude, it is worth noting that R-indicators must be identified on the same scale than P-indicators, according to their influence area and the mapping resolution.
3 Field test: the Ognon basin
3.1 Objectives of the field test
The methodology is tested on a field application in order to experience not only its relevancy and its reliability but also its operationality. The implementation of the methodology needs:
. strong scientific assumptions,
. stakeholder availability and involvement and
. data availability, accessibility and accuracy at different scales.
In our study, we focus on the last objective.
For each compartment or group of compartment of the DPSIR conceptual framework, we adopt a systematic approach to build and validate the indicators. First data and data set are identified, collected and pretreated. Each data are analysed according to its availability, resolution, frequency of update and its cost. The lit- erature review leads to the selection of a pool of indicators and we build indicators from the collected data. Once indicators have been built, their spatial and temporal variabilities are analysed.
3.2 Ognon basin
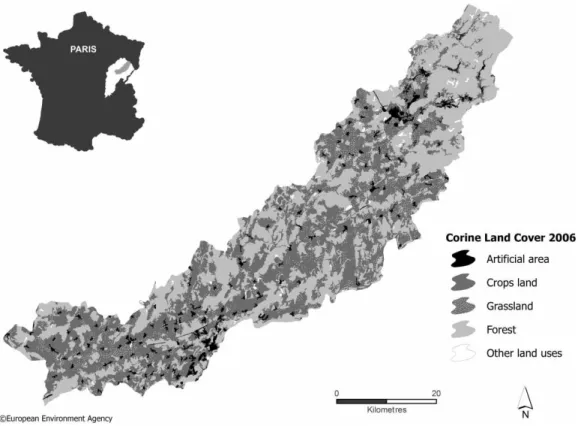
The basin is selected because of (i) its wide size and its charac- teristics and (ii) the high implication of water managers with this research issue. The Ognon river, located in north-eastern France, is a tributary of the Saoˆ ne river that reaches the Rhoˆ ne river at Lyon (Figure 3). The Ognon catchment has an area of 2300 km2 and a 1200 km permanent river network. The Ognon
river draws its source from the acid Vosges Mountains then flows over marls and silt substrates until its confluence with the Saoˆ ne river (Godreau et al. 1999). The climate is semi-con- tinental; mean annual rainfall is 860 mm (Me´te´o-France, 1983 – 1994) (Grevilliot et al. 1998). The river floodplain was widely exploited for gravel mining. The basin is widely forested with almost half of the basin (47%) covered with forest, accord- ing to Corine Land Cover 2006#EEA (CLC_2006). The head of the basin is quite exclusively forested, then, from the middle of the catchment to the outlet, land uses appear with agricultural activities and grassland (Figure 3). Grasslands and croplands rep- resent respectively 16% and 33% of the Ognon basin according to CLC_2006. Grasslands are mostly grazing grassland for live- stock production (mainly cattle). Agricultural land uses are mainly cereal and oilseed crops. In the lower valley, there is a high potential risk of pollution by nutrients and pesticides. With less than 4% of artificial land uses and a population of 120,000 inhabitants, the basin is relatively sparsely urbanized and may be considered as rural.
The Ognon catchment belongs to three hydro-ecoregions: mainly ‘coˆ tes calcaires est’, ‘Vosges’ upstream and ‘plaine de la Saoˆ ne’ downstream. For the EQR calculation, the REF values (the IBGN value at a reference pristine location) of these three contexts are slightly different.
Figure 3 Ognon land use according to Corine Land Cover 2006. According to IBGN values, water quality of the Ognon river has usually a high or a good status for the two-third upstream network, and a moderate status downstream.
4 Results
4.1 D- and P- indicators
The resolution of land-use maps used for describing driving forces and for calculating P-indicators must match the three studied scales. The CLC_2006 database (EEC 1993) is used for the macro-scale P-indicators. According to Gergel et al. (2002), we need a high-resolution land-use map to build relevant P-indicators at the micro-scale and meso-scale. A high-resol- ution map is built in river corridors following the methodology developed by Tormos et al. (2012). It is a multi-source mapping procedure combining satellites and aerial images with several national spatial thematic data. Using fine resolution land-use maps derived from a very high-resolution satellite imagery allows the good description of land-use patterns near the river (Snyder et al. 2005). To capture the best reflection of the diversity of pressures, we have to build a specific hierarchical nomenclature the most compatible possible with the Corine Land Cover nomenclature.
Macro-scale P-indicators are quite easy to estimate, because land-use data are fully available at this scale. But estimating meso- and micro-scales ones demands to create new land-use maps. Here, we choose to present only few P-indicators: the macro-scale P-indicators, and respectively, for meso-scale and micro-scale, three P-indicators, 30 m wide and 100 m wide
buffers on all river network and 30 m wide buffer at the water quality station location.
Micro-scale and meso-scale P-indicators are constructed around a surface water frame of references: the current river network frame of references is a linear data and does not have enough topological precision. So, we create our own frame by the union of two objects to materialize the river watertable: (i) the first one is a 1 m buffer width around the linear network and (ii) the second one corresponds to remotely sensed river sur- faces from high-resolution images. The role of this frame of reference is particularly important for the micro-scale P-indi- cators built in large rivers to cover only river banks and not river watertable.
Time analysis is an integral part of the study of interactions between land and river water quality. For driving forces and press- ures, land-use changes can be assessed by comparing maps at different dates. However, few homogeneous multi-date land-use data are available. The only available database is the Corine Land Cover that allows change analyses in 1990, 2000 and 2006. We analyse the driving forces and pressures changes at three spatial scales: the entire catchment, the riparian corridor in a 400 m width and the vicinity of water quality stations (through the study of land-use changes within 600, 1000 and 2000 m radius). We study land-use changes between 2000 and 2006 as these periods correspond to land-use and water quality data series.
For the Ognon catchment, driving forces time analyses show that land-use changes appear on less than 0.8% of the whole catchment and on 1% of the 400 m river corridors. Land-use changes appear only for the 2000 m radius circle around the water quality stations and have the same magnitude as for the
Figure 4 P-indicators for macro-scale and meso-scale (100 m wide buffer).
whole catchment. At the three scales, land-use changes corre- spond to evolutions, such as regeneration areas becoming forest, mature forest being harvested and building site becoming urban or industrial areas.
Figure 4 shows the results of P-indicators built at the macro- scale and meso-scale (in a 100 m wide buffer).
P-indicators developed at the macro-scale reflect the context in which the river network flows. The upstream – downstream gradient in land-use patterns highlighted in Figure 4 as in Figure 3 reflects an increasingly strong anthropogenic influence across the basin. At the macro-scale, the natural vegetation area decreases gradually from 86% in the first upstream basin to 49% on the last downstream basin. This decrease is directly linked with the variation of the agricultural area that scores from 12.4% to 49%. As shown in Figure 4, the increase in agricultural area is due to gains in both croplands and grasslands, though the raise of grasslands is higher than these crops. Grasslands predo- minate in the upstream basin, whereas in the downstream basin agricultural lands are mostly used for cropping.
The meso-scale P-indicators built in 100 m wide buffer show the two same upstream – downstream gradients of pressures for
natural and agricultural land uses as we observed with macro- scale P-indicators. However, values of macro-scale and meso- scale P-indicators cannot be directly compared as CLC_2006 and the high-resolution map do not use exactly the same nomen- clature. This is especially true for grassland and herbaceous veg- etation. Indeed, CLC_2006 dedicates one land-use class especially to pasture and intensive grassland managements (2.3.1. Pastures: ‘Dense grass cover, mainly for grazing, but the folder may be harvested mechanically’ [EEC 1993]) and another land-use class to natural grasslands (3.2.1. Natural grass- land: ‘Low productivity grassland. Often situated in areas of rough, uneven ground’ [EEC 1993]). Whereas on our high-resol- ution map, we distinguish intensive grasslands that are subjected to the Common Agricultural Policy subsidies, and herbaceous vegetation which, being remotely sensed, could be as well inten- sive as extensive grasslands.
At the meso-scale, in 100 m wide buffer, natural land-use P- indicator decreases gradually from 86% in the first upstream basin to 49% on the last downstream basin as shown in Figure 4. For 30 m wide buffer, P-indicator follows a similar spatial gra- dient probably due to the increased proportion of deciduous forest on the river banks. In the 100 m wide buffer, agricultural land uses range from 15% in the upstream basin to 48% in the downstream basin. As for macro-scale P-indicators, the agricul- tural land uses are mainly and even exclusively grasslands in the upstream catchments.
The analysis of the artificial meso-scale P-indicators is the best for illustrating the contribution of high-resolution maps. Macro-scale P-indicators show a quite constant value of approxi- mately 5% of artificial areas except in the upstream basin, whereas meso-scale P-indicators assess an artificial pressure of 8% in any location of the basin. High-resolution data also permits refining artificial pressure by allowing the calculation of the rate of impervious areas. These P-indicators show that about half of the artificial areas are not impervious. However, the increase in the rate of impervious areas from upstream to downstream expresses a densification and a concentration of urban and artificial areas.
High spatial resolution land-use maps are presented in Figure 5 around four water quality stations numbered 1 – 4 from upstream to downstream. From this map, it is possible to construct all the 36 micro-scale P-indicators, identified in Table 4. Forest P-indicator is close to 50% upstream and falls under 40% downstream. When we add herbaceous vegetation, the micro-scale P-indicator reaches almost 70% upstream which shows quite good local conditions for the upstream stations. However, we can note that there are artificial land uses in the vicinity of the four stations. The rate of artificial areas reaches 11% for the station 1 and 14% for the station 3. The rate of imperviousness and the presence of roads are the major artificial pressures. The rate of imperviousness is 54%, 86% and 63%, respectively, for station 1, station 3 and station 4 which seriously decreases the intensity of artificial pressure. However, the road P-indicator is 4% for the first station, which
Figure 5 High-resolution spatial land use at the micro-scale (buffer: 30 m width – 600 m length upstream – 100 m length downstream) around the four major water quality stations.
represents more than 4000 m2 of land covered by roads. The agricultural P-indicators show the predominance of intensive grasslands (around 25% for stations 1 and 2, around 33% for station 4); only station 4 has an environment characterized by the presence of croplands (16%).
4.2 S- and I-indicators
In order to work on S-indicator data consistent over time and space we choose to work with IBGN indexes, available in French water agency databases, here the Rhoˆ ne, Mediterranean and Corsica one. After the inventory of accessible data, an analy- sis of the spatio-temporal variability of water quality is necessary to construct an indicator adapted from the original knowledge.
There are 22 water quality stations on the Ognon basin, 15 of them belong to national monitoring networks, the other water quality stations are dedicated for local and time-limited monitor- ing. From these 22 stations, 119 measurements allow the calcu- lation of IBGN between 1990 and 2010 (21 years). Data are collected not only on the Ognon river but also on its main
tributaries such as the Rahin, which is the major tributary, the Reigne river and the Linotte river. First and foremost, it must be stated that IBGN data are not regularly distributed among 22 water quality stations. Nine water quality stations have got only one IBGN data, and there are only four water quality stations with more than 10 IBGN data (maximum number of observations at a given station is 26).
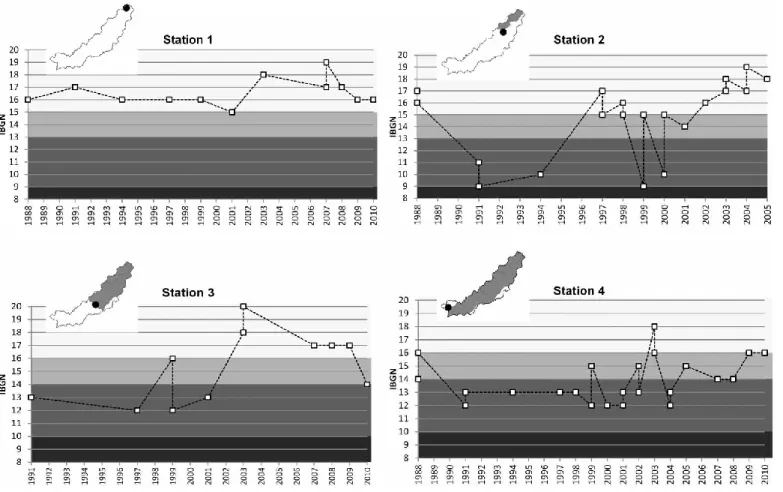
These four stations are designed as pilot stations, numbered from upstream to downstream, from 1 to 4. They are used for temporal analysis. The IBGN time plot analysis of these stations shows that the river water quality is in a rather good status as shown (Figure 6). Even if time series have at least 10 IBGN values, they are quite short and irregular. Thus, a specific meth- odology was developed for studying temporal evolution of IBGN data. Two of the pilot stations (stations 1 and 3) were stationary and the other two (stations 2 and 4) had a temporal trend.
Among the 21 years of observation on the Ognon basin, only 5 years (1991, 2007, 2008, 2009 and 2010) have got at least 10 water quality stations in operation. These 5 years are used for spatial analysis of water quality. Two of them, 2008 and 2010, are illustrated in Figure 7. There is a rather limited deterioration of water quality status from upstream to downstream as well as in 2008 than in 2010.
The chosen I-indicator is the standardized IBGN value. We apply exactly the same processing chain to the S-indicator. It is worth noting that, since in the case of Ognon basin, values for pristine locations are not much contrasted, time and spatial analy- sis of standardized IBGN data brought out similar results than the analysis of IBGN data.
4.3 R-indicators
In this paper, we choose to only work on planning and zoning documents about water policy and environmental conservation policy.
The Ognon basin concerns 18 actions from the programme of measures associated with the general planning and development programme for the ‘Rhoˆ ne and Mediterranean Sea’ basin for the period 2010 – 2015. Only six actions are directly linked to land planning and land use.
Two actions promote land planning at the meso-scale: ‘strengthen the application of the regulations concerning the new morphological works, the conception and the management of pounds, and the aggregates extractions’ and ‘establish restor- ation and physical management of the river’. These actions are not suitable for describing responses.
Nevertheless, it is possible to build R-indicators from land- use maps for the four last actions. R-indicators correspond here to zones where actions may be taken. The action, ‘restore river- banks and/or riparian vegetation’, can be defined at the meso- scale: for example, it is possible to estimate the area of the 30 m wide buffer around the river network, without
Figure 6 IBGN time plots analysis of the four pilot stations.
distinguishing between land-use classes. An area of 90 km2 for Ognon basin is potentially concerned by this action. The three last actions concern agricultural nonpoint pollution reduction: ‘cover soils in winter’, ‘substitute certain cultures by others that are less polluting’ and ‘maintain or implant a system against runoff and soil erosion’. These actions can be planned at the macro-scale and implemented, as the previous one, at the meso-scale. In terms of land use, it is possible to focus on crops classes for macro-scale and meso-scale. This R-indicator at the macro-scale is equal to 655 km2 (28% of the entire basin). At the meso-scale, the R-indicator is reduced to 50 km2 for the 100 m wide buffer (19% of the buffer surface) and to 14 km2 for the 30 m wide buffer (16% of the buffer surface).
At the macro-scale, another R-indicator can be built from environmental conservation zonings, such as international con- ventions (Ramsar Convention for wetlands), European directives (habitat directive – Natura 2000 program), national inventories (zone of floristic, faunal and ecological value – ZNIEFF), mapped local knowledge for the purpose of conservation man- agement (reserve forest biological arrested prefectural biotope protection, regional nature reserves and forests for protection). It is easy to define protected area as R-indicator at the macro- scale, according to the resolution of the input data. Seven environmental conservation zonings are inventoried and aggre- gated in the Ognon basin. As shown in Figure 8, 63% (respect- ively, 50%, 19% and 21%) of basin 1 (respectively, 2, 3 and 4)
area are protected areas. Such results can help to quantify the stake magnitude and to prioritize the actions.
5 Conclusion and discussion
The main objective of this work was to build a system of indi- cators able to cope with the evaluation of impacts of human activities and pressures on the environmental water quality of rivers, taking into account the whole complexity of this issue due to the numerous spatial and temporal scales, processes and actors involved in. The operational context was carefully con- sidered at every step of this work. The analysis was reduced to diffuse pressures. The main hypothesis was that these pressures are well described by land-use data, since land-use management can strongly modify their nature and intensity.
The system of indicators was based the European DPSIR fra- mework. This work illustrated how this framework can be implemented to build a system of indicators, able to assess the influences of land uses on ecological quality of rivers, following a rigorous methodology. We particularly focused on the tasks of collecting and structuring data to achieve a relevant and oper- ational system of indicators for assessing an environmental issue.
We show that even if the DPSIR framework clearly helped us to build a system of indicators, this conceptual tool was not easy to implement and requires many adjustments for selecting
Figure 7 IBGN status for years 2008 and 2010 on the Ognon catchment. indicators which were well adapted to the data availability and their spatial and temporal resolutions. According to the literature review and discussion with experts and stakeholders, driving forces were described by the three main types of land uses: natural, agricultural and artificial ones. Pressures were identified using land-use maps at the three spatial scales that govern the relationships between land use and ecological quality of water: catchment (macro-scale), river network (meso-scale) and station (micro-scale). The DPSIR state compartment that means here the ecological water quality status was represented by a bioindicator based on population of macro-invertebrates. Impacts that result in environmental effects are analysed using a standardized bioindicator. Lastly, responses were set through the review of planning and zoning documents for water policy
and local environmental conservation actions, with the help of experts and stakeholders.
This enhanced DPSIR-LURE framework was implemented on the Ognon catchment in order to test its operability and to check its relevance to the available data. P-indicators were calcu- lated, from Corine Land cover maps and our own high-resolution land-use maps. Several limitations were raised, the main ones being the topological precision of the data and the definition of the land-use nomenclature. S-indicators were calculated using the IBGN indexes that are the best available bioindicators in the French Water Agency reporting database. I-Indicator is related to standardized IBGN values. R-indicators were the most difficult to estimate. Data related to the national zonings of protected areas, the regional programme of measures of the
Figure 8 Environmental conservation zonings.
French Water Agency and the local stakeholders actions were used here.
The main outcomes are the followings:
. about multi-scale P-indicators, (1) at the macro-scale, the indi-
cators are useful to highlight the large upstream – downstream land-use gradients ; (2) at the meso-scale, the widths of buffers on which the P-indicators are built have almost no influence on their values whatever the type of land use is. So, just one or two buffer widths could be considered for calculating meso- scale P-indicators; (3) at the micro-scale, the values of P-indi- cators are very heterogeneous and difficult to interpret. Yet the systematic presence of artificial land uses in the vicinity of the water quality stations appears clearly.
. about S- and I-indicators (respectively IBGN and standardized
IBGN data), there were not enough data to analyse the spatial and temporal variabilities of the bioindicators on the whole data set. This was mainly due to the recent changes in the monitoring networks. The temporal variability could still be estimated on a very small number of pilot stations. The spatial variability could only be studied for a given year, in which a sufficient number of stations were observed over a short period of a few weeks, to guarantee the comparability of the values.
. about R-indicators, due to the large panel of policies leading to
land-use changes (European and national environmental zonings, regional programmes of environmental measures and local conservation actions), responses are diverse and
difficult to synthesize in a simple and unique indicator. Never- theless, the available data help to delimit areas of interest and to target areas for implementing actions. In fact, as pressures, a large number of responses could be translated into potential land-use changes, using high-resolution land-use maps. At this step of our work, it was not possible to distinguish the measures that have been already achieved by actions from the others. Yet, already done actions must have been beforehand identified through field surveys. It is important to keep in mind that the system of indicators has to be built in accordance with the on-going river basin management process. Moreover, a cross validation has to be done between R-indicators and outputs of the diagnostic phase. An important issue remains: responses could imply land-use changes which should drive changes in pressures. This may re-start the looping process of the DPSIR framework by updating indicators values. Lastly, in operational terms, it is mainly from the R-indicators that water managers define the efficiency of their decisions.
Our study proves that it is possible to implement the DPSIR- LURE framework on a medium-size catchment. It leads us to work in close cooperation with water stakeholders, and to share a common conceptual framework for analysing impacts of human pressures on water quality of rivers. Several tests and improvements are still needed. The DPSIR-LURE frame- work should be implemented on larger catchments (e.g. the whole Saoˆ ne catchment). This change of scale would help to confirm or refute the main conclusions drawn from this first
test. A widespread implementation of the DPSIR-LURE frame- work to several medium-size catchments would help compare the threshold values of P-indicators from which the values of S- or I-indicators are significantly altered, which should help the environmental management decisions. The DPSIR-LURE framework should also be extended to point pressures that have not been considered here.
According to the decision cycle steps, the indicators system providing from the DPSIR-LURE framework had to be implemented and experienced in a diagnosis phase, to help iden- tifying the most impactful diffuse pressures on rivers which means the most impactful land uses where actions are required. This will be the next stage of our study.
Acknowledgements
The authors thank EPTB Saone et Doubs and syndicat de l’Ognon for data exchange, Claire Joliet and Margot Lhoste for the English review. The authors also express their thanks to the reviewers and the associate editor for their suitable comments that improve deeply the paper.
Funding
This work was supported by the Agence de l’Eau Rhoˆ ne-Me´diterrane´e- Corse.
References
Acreman, M., 2005. Linking science and decision-making: fea- tures and experience from environmental river flow setting. Environmental Modelling & Software, 20 (2), 99 – 109. AFNOR (French Standardization Agency), 1992, 2004. T90-350
– Qualite´ e´cologique des milieux aquatiques. De´termination de l’indice biologique global normalise´ (IBGN), Association fran- c¸aise de normalisation, Qualite´ de l’eau.
Allan, J.D., 2004a. Influence of land use and landscape setting on the ecological status of rivers. Limnetica, 23 (3 – 4), 187 – 198. Allan, J.D., 2004b. Landscapes and riverscapes: the influence of land use on stream ecosystems. Annual Review of Ecology Evolution and Systematics, 35, 257 – 284.
Allan, J. and Johnson, L., 1997. Catchment-scale analysis of aquatic ecosystems. Freshwater Biology, 37 (1), 107 – 111. Allan, J.D., Erickson, D.L., and Fay, J., 1997. The influence of
catchment land use on stream integrity across multiple spatial scales. Freshwater Biology, 37 (1), 149 – 161.
Archaimbault, V., et al., 2010. Assessing toxic sediment pol- lution in streams using bio-ecological traits of benthic macro- invertebrates. Freshwater Biology, 55 (7), 1430 – 1446. Arnold, C.L. and Gibbons, C.J., 1996. Impervious surface cover-
age – the emergence of a key environmental indicator. Journal of the American Planning Association, 62 (2), 243 – 258.
Balestrat, M., 2011. Syste`mes d’indicateurs spatialise´s pour la gouvernance territoriale: application a` l’occupation des sols en zone pe´riurbaine languedocienne. Doctorat de Ge´ographie, Universite´ de Montpellier III Thesis, 402 pp.
Barling, R.D. and Moore, I.D., 1994. Role of buffer strips in management of waterway pollution – a review. Environ- mental Management, 18 (4), 543 – 558.
Benini, L., et al., 2010. Assessment of land use changes through an indicator-based approach: a case study from the Lamone river basin in Northern Italy. Ecological Indicators, 10 (1), 4 – 14. Bis, B., Zdanowicz, A., and Zalewski, M., 2000. Effects of catch-
ment properties on hydrochemistry, habitat complexity and invertebrate community structure in a lowland river. Hydro- biologia, 422, 369 – 387.
Brosse, S., Arbuckle, C.J., and Townsend, C.R., 2003. Habitat scale and biodiversity: influence of catchment, stream reach and bedform scales on local invertebrate diversity. Biodiver- sity and Conservation, 12 (10), 2057 – 2075.
Buck, O., Niyogi, D.K., and Townsend, C.R., 2004. Scale- dependence of land use effects on water quality of streams in agricultural catchments. Environmental Pollution, 130 (2), 287 – 299.
Carr, E.R., et al., 2007. Applying DPSIR to sustainable develop- ment. International Journal of Sustainable Development and World Ecology, 14 (6), 543 – 555.
Crouzet, P., Beauzamy, B., and Carlier, C., 2009. Assessment of trends in water composition by stratification. Pilot application within the EEA DPSIR framework. Houille Blanche-Revue Internationale De L Eau, 4, 77 – 83.
Cuffney, T.F., et al., 2000. Responses of physical, chemical, and biological indicators of water quality to a gradient of agricul- tural land use in the Yakima River Basin, Washington. Environmental Monitoring and Assessment, 64 (1), 259 – 270. Delong, M.D. and Brusven, M.A., 1998. Macroinvertebrate community structure along the longitudinal gradient of an agriculturally impacted stream. Environmental Management, 22 (3), 445 – 457.
Dovciak, A.L. and Perry, J.A., 2002. In search of effective scales for stream management: does agroecoregion, watershed, or their intersection best explain the variance in stream macroin- vertebrate communities? Environmental Management, 30 (3), 365 – 377.
EEC, 1993. CORINE Land cover map and technical guide. European Union Directorate-General Environment, Nuclear Safety and Civil Protection, Luxembourg.
European Environmental Agency, 1999. Environmental indi- cators: typology and overview. Technical Report No. 25. E.E.A. Frimpong, E.A., et al., 2005. Determination of optimal riparian forest buffer dimensions for stream biota-landscape association models using multimetric and multivariate responses. Cana- dian Journal of Fisheries and Aquatic Sciences, 62 (1), 1 – 6. Frissell, C.A., et al., 1986. A hierarchical framework for stream
habitat classification – viewing streams in a watershed context. Environmental Management, 10 (2), 199 – 214.
Gergel, S.E., et al., 2002. Landscape indicators of human impacts to riverine systems. Aquatic Sciences, 34 (2), 118 – 128.
Godreau, V., et al., 1999. Biodiversity in the floodplain of Saone: a global approach. Biodiversity and Conservation, 8 (6), 839 – 864.
Grevilliot, F., Broyer, J., and Muller, S., 1998. Phytogeographi- cal and phenological comparison of the Meuse and the Saone valley meadows (France). Journal of Biogeography, 25 (2), 339 – 360.
Harding, J.S., et al., 1998. Stream biodiversity: the ghost of land use past. Proceedings of the National Academy of Sciences of the United States of America, 95 (25), 14843 – 14847. Hawkins, C.P., et al., 2000. Development and evaluation of pre-
dictive models for measuring the biological integrity of streams. Ecological Applications, 10 (5), 1456 – 1477. Johnson, L.B. and Host, G.E., 2010. Recent developments in
landscape approaches for the study of aquatic ecosystems. Journal of the North American Benthological Society, 29 (1), 41 – 66.
Johnson, L. and Gage, S., 1997. Landscape approaches to the analysis of aquatic ecosystems. Freshwater Biology, 37 (1), 113 – 132.
Karr, J.R., 1991. Biological integrity – a long neglected aspect of water resource management. Ecological Applications, 1 (1), 66 – 84.
Klein, R.D., 1979. Urbanization and stream quality impairment. Water Resources Bulletin, 15 (4), 948 – 963.
Kristensen, P., 2004. The DPSIR Framework, UNEP Headquar- ters, on a comprehensive/detailed assessment of the vulner- ability of water resources to environmental change in Africa using river basin approach. Nairobi, Kenya.
Lafont, M., 2001. A conceptual approach to the biomonitoring of freshwater: the ecological ambience system. Journal of Lim- nology, 60 (suppl 1), 17 – 24.
Lammert, M. and Allan, J.D., 1999. Assessing biotic integrity of streams: effects of scale in measuring the influence of land use/ cover and habitat structure on fish and macroinvertebrates. Environmental Management, 23 (2), 257 – 270.
Lattin, P.D., et al., 2004. Influence of remote sensing imagery source on quantification of Riparian land cover/land use. Journal of the American Water Resources Association, 40 (1), 215 – 227.
Lowrance, R., et al., 1984. Riparain forest as nutrient filters in agricultural watersheds. Bioscience, 34 (6), 374 – 377. Maridet, L., 1994. La ve´ge´tation rivulaire, facteur de controˆ le du
fonctionnement e´cologique des cours d’eau: influence sur les communaute´s benthiques et hyporhe´iques et sur les peuple- ments de poissons dans trois cours d’eau du Massif Central. Doctorat, Universite´ Claude Bernard Lyon I Thesis, 275 pp. Maridet, L., 1995. Roˆ le des formations ve´ge´tales riveraines.
Recommandations pour une gestion re´gionalise´e, Convention n81/94. Cemagref, Bely/LHQ. Ministe`re de l’Environnement. SDMAP PARIS.
Meador, M.R. and Goldstein, R.M., 2003. Assessing water quality at large geographic scales: relations among land use, water physicochemistry, riparian condition, and fish community structure. Environmental Management, 31 (4), 504 – 517.
Morley, S.A. and Karr, J.R., 2002. Assessing and restoring the health of urban streams in the Puget Sound basin. Conserva- tion Biology, 16 (6), 1498 – 1509.
Naiman, R.J., Decamps, H., and Pollock, M., 1993. The role of riparian corridors in maintaining regional biodiversity. Eco- logical Applications, 3 (2), 209 – 212.
Niyogi, D.K., et al., 2007. Stream communities along a catch- ment land-use gradient: subsidy-stress responses to pastoral development. Environmental Management, 39 (2), 213 – 225. Osborne, L.L. and Kovacic, D.A., 1993. Riparian vegetated buffer strips in water-quality restoration and stream manage- ment. Freshwater Biology, 29 (2), 243 – 258.
Osborne, L.L. and Wiley, M.J., 1988. Empirical relationships between land-use cover and stream water-quality in an agri- cultural watershed. Land Use Policy, 26 (1), 9 – 27.
Palmer, M.A., et al., 2005. Standards for ecologically successful river restoration. Journal of Applied Ecology, 42 (2), 208 – 217.
Palmer, B.J., et al., 2011. An assessment of coastal development and land use change using the DPSIR framework: case studies from the Eastern Cape, South Africa. Coastal Management, 39 (2), 158 – 174.
Paul, M.J. and Meyer, J.L., 2001. Streams in the urban landscape. Annual Review of Ecology and Systematics, 32, 333 – 365. Pedersen, M.L., 2009. Effects of channelisation, riparian struc-
ture and catchment area on physical habitats in small lowland streams. Fundamental and Applied Limnology, 174 (1), 89 – 99.
Perry, C.D., et al., 1999. Watershed-scale water quality impacts of riparian forest management. Journal of Water Resources Planning and Management, 125 (3), 117 – 125.
Peterjohn, W.T. and Correll, D.L., 1984. Nutrient dynamics in an agricultural watershed – observations on the role of a riparian forest. Ecology, 65 (5), 1466 – 1475.
Piechnik, D.A., et al., 2012. Topographic placement of manage- ment practices in riparian zones to reduce water quality impacts from pastures. Landscape Ecology, 27 (9), 1307 – 1319. Richards, C., et al., 1997. Catchment and reach-scale properties
as indicators of macroinvertebrate species traits. Freshwater Biology, 37 (1), 219 – 230.
Richards, C., Johnson, L.B., and Host, G.E., 1996. Landscape- scale influences on stream habitats and biota. Canadian Journal of Fisheries and Aquatic Sciences, 53, 295 – 311. Roth, N.E., Allan, J.D., and Erickson, D.L., 1996. Landscape
influences on stream biotic integrity assessed at multiple spatial scales. Landscape Ecology, 11 (3), 141 – 156.
Roy, A.H., et al., 2003. Stream macroinvertebrate response to catchment urbanisation (Georgia, USA). Freshwater Biology, 48 (2), 329 – 346.