HAL Id: hal-02175592
https://hal.archives-ouvertes.fr/hal-02175592
Submitted on 26 May 2020
HAL is a multi-disciplinary open access
archive for the deposit and dissemination of
sci-entific research documents, whether they are
pub-lished or not. The documents may come from
teaching and research institutions in France or
abroad, or from public or private research centers.
L’archive ouverte pluridisciplinaire HAL, est
destinée au dépôt et à la diffusion de documents
scientifiques de niveau recherche, publiés ou non,
émanant des établissements d’enseignement et de
recherche français ou étrangers, des laboratoires
publics ou privés.
Distributed under a Creative Commons Attribution| 4.0 International License
Climate change would lead to a sharp acceleration of
Central African forests dynamics by the end of the
century
Florian Claeys, Sylvie Gourlet Fleury, Nicolas Picard, Dakis-Yaoba
Ouedraogo, Mahlet G. Tadesse, Bruno Hérault, Fidele Baya, Fabrice Benedet,
Guillaume Cornu, Frederic Mortier
To cite this version:
Florian Claeys, Sylvie Gourlet Fleury, Nicolas Picard, Dakis-Yaoba Ouedraogo, Mahlet G. Tadesse,
et al.. Climate change would lead to a sharp acceleration of Central African forests dynamics by the
end of the century. Environmental Research Letters, IOP Publishing, 2019, 14 (4),
�10.1088/1748-9326/aafb81�. �hal-02175592�
LETTER • OPEN ACCESS
Climate change would lead to a sharp acceleration of Central African
forests dynamics by the end of the century
To cite this article: Florian Claeys et al 2019 Environ. Res. Lett. 14 044002
View the article online for updates and enhancements.
Environ. Res. Lett. 14(2019) 044002 https://doi.org/10.1088/1748-9326/aafb81
LETTER
Climate change would lead to a sharp acceleration of Central African
forests dynamics by the end of the century
Florian Claeys1,2,3,4,9 , Sylvie Gourlet-Fleury2,3 , Nicolas Picard2,3 , Dakis-Yaoba Ouédraogo5 , Mahlet G Tadesse6 , Bruno Hérault2,3,7 , Fidèle Baya8 , Fabrice Bénédet2,3 , Guillaume Cornu2,3 and Frédéric Mortier2,3,9
1 AgroParisTech, 19 avenue du Maine, F-75732 Paris, France 2 Forêts et Sociétés, C
IRAD, F-34398 Montpellier, France 3 Forêts et Sociétés, Univ Montpellier, C
IRAD, Montpellier, France 4 Bureau for Economic Theory and Applications(B
ETA), AgroParisTech-INRA, 14 rue Girardet, F-54000 Nancy, France 5 T
ERRATeaching and Research Centre, Central African Forests, Gembloux Agro-Bio Tech, University of Liège, Passage des Déportés 2, B-5030 Gembloux, Belgium
6 Georgetown University, 3700 O Street NW, Washington DC 20057, United State of America 7 Institut National Polytechnique Félix Houphouët-Boigny(I
NPHB), Yamoussoukro, Ivory Coast
8 Ministry of Environment, Sustainable Devlopment, Waters, Forestry, Hunting and Fishery(M
EDDEFCP), Rue Ambassadeur R. Guérillot,
BP 830 Bangui, Central African Republic
9 Authors to whom any correspondence should be addressed.
E-mail:florian.claeys@gmail.comandfrederic.mortier@cirad.fr
Keywords: tropical rainforest, climate change, CORDEX-Africa, M’Baïki experimental site, ecological guilds, mixture of matrix models, variable selection
Supplementary material for this article is availableonline
Abstract
Impacts of climate change on the future dynamics of Central African forests are still largely unknown,
despite the acuteness of the expected climate changes and the extent of these forests. The high diversity
of species and the potentially equivalent diversity of responses to climate modifications are major
difficulties encountered when using predictive models to evaluate these impacts. In this study, we
applied a mixture of inhomogeneous matrix models to a long-term experimental site located in M’Baïki
forests, in the Central African Republic. This model allows the clustering of tree species into
processes-based groups while simultaneously selecting explanatory climate and stand variables at the group-level.
Using downscaled outputs of 10general circulation models (G
CM), we projected the future forest
dynamics up to the end of the century, under constant climate and Representative Concentration
Pathways4.5 and8.5. Through comparative analyses across G
CMversions, we identified tree species
meta-groups, which are more adapted than ecological guilds to describe the diversity of tree species
dynamics and their responses to climate change. Projections under constant climate were consistent
with a forest ageing phenomenon, with a slowdown in tree growth and a reduction of the relative
abundance of short-lived pioneers. Projections under climate change showed a general increase in
growth, mortality and recruitment. This acceleration in forest dynamics led to a strong natural thinning
effect, with different magnitudes across species. These differences caused a compositional shift in
favour of long-lived pioneers, at the detriment of shade-bearers. Consistent with other
field studies and
projections, our results show the importance of elucidating the diversity of tree species responses when
considering the general sensitivity of Central African forests dynamics to climate change.
1. Introduction
Among the multiple increasing anthropogenic factors that will affect tropical forests(Lewis et al2015), climate
change appears to be both the most global and inevitable one. Through the alteration of temperature and rainfall,
climate change could alter the structure, composition and functioning of tropical forests. Knowing the climate response of these forests is a major challenge in view of their crucial role as large-scale carbon stocks and sinks to contain global warming well below 2°C (Griscom et al2017, Rogelj et al2018). OPEN ACCESS RECEIVED 16 July 2018 REVISED 17 December 2018 ACCEPTED FOR PUBLICATION 2 January 2019 PUBLISHED 26 March 2019
Original content from this work may be used under the terms of theCreative Commons Attribution 3.0 licence.
Any further distribution of this work must maintain attribution to the author(s) and the title of the work, journal citation and DOI.
Existing studies have largely focused on Amazonia. Simulations of climate change impact have suggested that Amazonian forests could rapidly decline as a result of enhanced droughts and accelerated temper-ature increase: the Amazonian die-back (Cox et al
2004). Inversely, some models have projected a
green-ing-up of Amazon forests with an overall gain in productivity as the fertilisation effect of increasing CO2 concentration overcompensates for the losses
due to changes in temperature and precipitation (Huntingford et al2013). Considering Amazon forests
as a carbon sink may however be excessively optimistic and is still being debated(Lewis et al2015).
As the second largest continuously forested area in the world, Central Africa is a key region for both cli-mate change mitigation and adaptation(Niang et al
2014). Its importance for mitigation is largely
recog-nised, with forests sheltering 80% of the above-ground African carbon stock (Mayaux et al 2013). In this
region, depending on the climate scenarios, temper-ature is projected to increase in a range between 2 and 4°C above the baseline observed in the second half of the 20th century reference(Aloysius et al2016).
Com-pared to temperature projections, precipitation pro-jections from general circulation models (GCM) or
from regional circulation models(RCM) are more
het-erogeneous, partly because of the difficulty in resol-ving climate mechanisms driresol-ving the variability of precipitation across Central Africa(Pokam Mba et al
2018). Changes in projected precipitation range from
−9% to +27% (Aloysius et al2016). Continental lands
are projected to endure an intensification of dry sea-sons (Malhi et al 2013), a trend already widely
observed for several decades(Zhou et al2014).
The response of Central African forests to climate change has remained largely understudied until recently(Sonwa et al2013), partly due to the lack of
regional climate information (Lennard et al 2018).
Tree species composition is strongly correlated with rainfall and temperature gradients(Fayolle et al2014).
The global study of Zelazowski et al(2011) on the role
of climate in the distribution of humid tropical forests and the first regional impact assessment of climate change on the Congo Basin by Ludwig et al(2013)
con-cluded that, in contrast to Amazonia, a die-back in Central African forests would be unlikely.
Relationships between climate variables and forest dynamic processes, i.e. growth, mortality and recruit-ment, are complex(Swann et al2016). They are widely
variable from one species to another resulting in species uniqueness in their possible response to climate change (Uriarte et al2018). The same changes in climate could
be beneficial to some species but detrimental to others, leading to shifts infloristic composition.
Tropical tree species responses to climate can be approximated through their shade-tolerance, generally by distinguishing ecological guilds(Hawthorne1995)
such as pioneers (P), non-pioneer light-demanders (NPLD)and shade-bearers(SB). In the Central African
Republic(CAR), Ouédraogo et al (2013) showed that
slow-growing SB species were the least sensitive to drought. On the contrary, in Ghana, drought might lead to a shift from SBspecies to dry-adapted Pand NPLDspecies(Fauset et al2012).
From a modelling perspective, tree species group-ing, and more generally, plant functional classification (Lavorel et al2007) is a tool for simplifying floristic
complexity. There are various methods for grouping species, including groups based on the subjective eco-logical knowledge of species, such as widely-used Hawthorne(1995)ʼs guilds, or groups based on species
dynamic processes, namely growth, mortality and recruitment(Gourlet-Fleury et al2005). While
sub-jective ecological groups facilitate the ecological inter-pretation of results, when it comes to simulating forest dynamics, it is better to build groups based on their own processes in order to improve the estimation of dynamics parameters and the projection perfor-mances(Mortier et al2013, Picard et al2010).
In this study, we aimed at disentangling the long-term effects of different climate variables on the struc-ture and dynamics of a tropical rainforest in Central Africa. We hypothesised that climate change will have differential impacts on species dynamics with varying responses driven by different climate and structure variables within and across ecological guilds. We used a modelling approach based on Mortier et al(2015)ʼs
mixture of inhomogeneous matrix models(MIMM), a
methodology particularly well adapted to simulate the dynamic behaviours of species-rich ecosystems. We applied it to forest inventory data from a unique 30-year-long experiment established at M’Baïki, in CAR. To integrate the variability of climate projec-tions, we produced 10different versions of MIMM, one for each GCM. After comparing observed and simulated forest stands, we examined the impact of climate change on forest dynamics, in terms of both structure and composition, over the 21st century.
2. Material and methods
2.1. Data
2.1.1. Forest inventory data
Annual forest inventories have been performed since 1982 at the M’Baïki experimental site (figure S1 available online atstacks.iop.org/ERL/14/044002/
mmedia), established in CAR(3° 54′N, 17°56′E). The
vegetation is a Guineo-Congolian semi-deciduous moist forest, with canopy dominated by Cannabacae, Myristicacae and Meliacae families (Boulvert 1986).
Ten permanent sample plots, four ha each, were established in two neighbouring forest reserves. Between 1982 and 2012, all trees 10 cm diameter at breast height(DBH) have been monitored. The floristic
description of the trees is complete since 1992. Three disturbance treatments were implemented: three plots were left as controls, seven plots were selectively logged
of which four were subsequently thinned. Selective logging occurred between 1984 and 1985 and consisted of harvesting commercial trees with DBH 80 cm. Thinning occurred two years after
logging and consisted in poison girdling all non commercial trees with DBH 50 cm and cutting all
lianas. A complete description of the experimental site can be found in Gourlet-Fleury et al(2013).
2.1.2. Climate data
To predict the climate at M’Baïki over the next century, we used outputs of regional climate simula-tions over 1992–2100 conducted over the Coordinated Regional Climate Downscaling Experiment (C OR-DEX)-Africa domain at a resolution of ≈50 km
(0.44°×0.44°). These climate predictions are consid-ered to be a good compromise between model performances and computational limits(Panitz et al
2014). CORDEXis a standardised framework in which GCMprojections are dynamically downscaled by RCM
over selected continent-scale regions (Jones et al
2011), including Africa (Hewitson et al2012).
We used 10GCMoutputs(table S1), downscaled by the Rossby Centre regional atmospheric model (Samuelsson et al2011). For each GCM, we used three sets of climate projections: the historical runs over the period 1992–2005 extended over 2006–2099, which we refer to as baseline scenario under constant climate; and the projected runs under two Representative Con-centration Pathways (RCP), RCP 4.5 and RCP8.5
(Moss et al 2010), over the period 2006–2100. The
baseline scenario allowed, by comparison with the other two scenarios, the identification of forest dynamics that would or not be affected by climate change.
2.2. Forest dynamics modelling methodology We used the MIMMmethodology(Mortier et al2015)
to model the forest dynamics based on each of the 10 GCMused. MIMMis a statistical correlative model that identifies differential growth, mortality and recruitment processes, and selects their associated subsets of explanatory variables. It combines ideas of mixture models, generalised linear models (GLM),
variable selection and matrix models. The MIMM
method consists of two steps:(i) for each dynamic process, penalisedfinite mixtures of GLMare used to classify species into groups, select the best explanatory variables, and estimate the model parameters; (ii) a Usher(1966,1969) matrix model is then calibrated for
each non-empty identified group and used to project forest dynamics. Further details are provided in the supplementary section S1.3.
2.3. Simulation protocol
2.3.1. Fitting MIMMon GCMversions for M’Baïki We used data collected on all the M’Baïki plots, regardless of the disturbance treatment applied, and
data from CORDEX-Africa historical runs, tofit MIMM
to the various GCMand to define the composition and
the parameters associated to species groups, over the 1992–2005 period. This enabled us to quantify the dynamic processes over a large range of stand condi-tions, using≈120 000 diameter increments measures, 3600 death and 6100 recruitment events.
We processed the climate data after extracting the 30 arc s(≈1 km2) pixel corresponding to the M’Baïki site from raster maps of climate variables. For this pixel we averaged, on an annual basis, monthly time series of 13 climate variables. We excluded six highly correlated variables, using a variance inflation factor (VIF) threshold of 5 (Dormann et al2013). We thus
kept seven climate variables to calibrate MIMM
(table 1). Climate variables were complemented by
four structure variables calculated from the M’Baïki forest inventories and directly linked to the develop-ment of trees and forest stands: DBH(in cm) and its
logarithmic transformation, log-DBH, to deal with the nonlinear association between DBH and the growth and mortality processes; stand density(stems per hec-tare, in ha−1) and stand basal area (in m2ha−1) to quantify the tree competition effect on growth, mor-tality and recruitment processes.
We assessed the observed and projected stand structures based on four output variables: stand den-sity(ha−1), stand basal area (m2ha−1), quadratic dia-meter(cm) and carbon biomass (teqCO2ha−1). We
calculated thefirst three variables directly from the MIMMoutputs at each time step while we estimated carbon biomass by combining the MIMMoutputs with a pantropical allometric equation(Chave et al2014)
with the conversion rate from biomass to carbon set to 0.47(Eggleston et al2006, table 4.3). We took
species-specific wood densities from the database of Zanne et al(2009). When there was no match at the species
level, we used the average value at the genus level. When no value was available in the database, we used the default 0.60g cm−3recommended by Henry et al
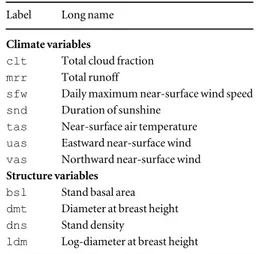
(2010, p. 1383) for tropical African woods. Table 1. List of explanatory climate and structure variables used in this study. Climate variables are those kept using a VIF<5 criterion.
Label Long name Climate variables
clt Total cloud fraction mrr Total runoff
sfw Daily maximum near-surface wind speed snd Duration of sunshine
tas Near-surface air temperature uas Eastward near-surface wind vas Northward near-surface wind Structure variables
bsl Stand basal area dmt Diameter at breast height dns Stand density
ldm Log-diameter at breast height
3 Environ. Res. Lett. 14(2019) 044002
2.3.2. Simulation of forest dynamics
For each of the 10GCM, three simulation analyses were conducted. The first analysis, for calibration, aimed at comparing simulated and observed stands at M’Baïki. It involved running simulations from 1992 to 2005. The two other analyses, for validation and projection, started in 2006, when historical runs of GCM were no longer available. The three different climate scenarios presented in section2.1.2were used for validation and projection. The validation analysis ended in 2012, when the last forest inventories at M’Baïki were available. This was done to compare projected forest stands to observed stands under different climate scenarios. The projection analysis ended in 2099 and aimed to simulate the impact of climate change over the 21st century, starting with the average abundance of the control plots at M’Baïki. 2.3.3. Atmospheric CO2concentration as an explanatory
variable
While recent studies show that atmospheric CO2
concentration varies both spatially and seasonally across the world(Zhang et al2013), this variable was
not available in CORDEX-Africa. In an attempt to consider CO2, we averaged GCMprojections of
atmo-spheric CO2concentration under the Coupled Modeal
Intercompariosn Project Phase 5(CMIP5) (Taylor et al
2012) and included this average as a covariate in the
10GCMversions. MIMMwasfitted with and without this variable to assess the relevance of including CO2
concentration as a covariate.
Although the calibration and validation procedures could be successfully completed, the simulations over the projection period systematically failed to converge when including CO2. Forest dynamics reached
unrealis-tic levels, with infinite values in stand characteristics and processes. This failure was due to the perfect correlation of the annual average atmospheric CO2concentration
with time. Thus, CO2 effect was confounded with
linear temporal trend, a situation that prevents any valid projection. In the following, only results obtained without CO2concentration are presented.
2.3.4. Summarising MIMMoutputs
Because the number of species combined to the 10GCM versions led to an impractical number of information, results were summarised by re-aggregat-ing MIMMʼs outputs according to the two following
approaches. Thefirst, exogenous to MIMM, is based on ecological guilds, the second, endogenous to MIMM, is based on the similarities of species groupings between GCM versions. For the latter, we used hierarchical clustering to define new meta-groups. The number of meta-groups was estimated using the gap statistics (Kaufman and Rousseeuw 2005). In comparison to
guilds, meta-groups are more consistent with the information from the data as they follow the same logic of species grouping based solely on the similarity of their dynamic processes (Picard et al 2010). Further
details are provided in the supplementary section S2.1. The contributions of variables to projected changes in dynamic processes were quantified using weighted averages across GCM versions of the correlations between the linear predictor associated to a variable and the projected values(see supplementary section S1.3).
3. Results
3.1. Species groups and explanatory variables Among the 10different GCMversions used for apply-ing MIMMto the M’Baïki data, the number of groups
identified ranged between 5and 8 for the growth process, and 2and 4 for the recruitment process. For the mortality process, all versions agreed on 3groups. Allocating species across growth, mortality and recruitment groups resulted in 11to 17 non-empty growth-mortality-recruitment combined groups. In these groups, depending on the GCM version, the number of species was variable with the largest groups containing between 35and 67species, and the average group between 12.2 and 18.9species. The number of species groups obtained by model fitting and the species composition of these groups showed similarities and differences across GCM versions (figure1(a)). The cluster allocation of species and the
parameter estimates are provided for each GCM
version in supplementary section S3.
To refine comparisons, we disaggregated model projections from the group to the species level, and then re-aggregated them at the guild level and at the meta-group level. The differences between groups, guilds and meta-groups are illustrated infigure1and detailed infigure S2. Some species groups, especially some P-dominated or SB-dominated groups were quite well discriminated on the basis of their guild composition. The majority of groups mixed species from two or all three guilds. In particular, no group was exclusively composed of NPLD.
Ninemeta-groups were identified with a hier-archical cluster analysis and gap statistics(figure S2 and table2). Meta-groups1, 5 and6 were highly dominated
by SB. Meta-groups2 and3 were dominated by NPLD, meta-group4 by long-lived P and meta-group9 by short-livedP. The two remaining meta-groups 7 and 8 are dominated by NPLDand SB, in similar proportions.
The climate and structure variables selected to be associated with the dynamic processes varied across the GCMversions, guilds and meta-groups(tables S2 and S3). At the guild level, all structure variables were gen-erally selected to explain dynamic processes with the exception of stand density for growth. All climate vari-ables are generally selected to explain growth, but were not systematically selected for mortality and recruit-ment. The selection of the variables varied within guilds, reflecting the heterogeneity of specific responses within guilds. For example, climate variables had a large variability in their selection for mortality among P. At
the meta-group level, the frequency of selection for the variables had narrower range, indicating less hetero-geneity of species responses within meta-groups than within guilds, the best example being meta-group5. However, contrasts in terms of variable selection can be observed between meta-groups, for example on growth (stand density is less selected in meta-groups 1 and 2) and on recruitment(climate variables are less selected in meta-groups 2 and 3).
3.2. Model validation
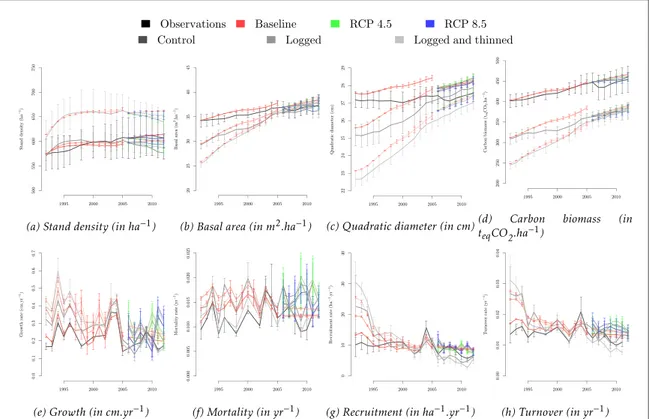
Over the calibration period(1992–2005), no signifi-cant difference was found between simulations and observations on forest structure and dynamics, across all disturbance treatments except for a slight under-estimation of recruitment in logged plots(figure 2).
Interestingly, MIMMwas able to capture the effects of
disturbance treatments, with a clear impact of logging and/or thinning on forest dynamics.
Over the validation period(2006–2012), simulated forest structure and dynamics remained close to the observed data for all climate change scenarios and dis-turbance treatments, except a slight overestimation of growth and recruitment in treated plots. In particular, some trends such as the decrease of stand density and recruitment, as well as the increase of basal area, quad-ratic diameter and carbon biomass were well captured by MIMM.
3.3. Baseline scenario
Under the baseline scenario, with constant climate conditions over the projection period 2006–2099, the forest dynamics and structure projected in 2099 differed from those observed in 2005(figure3). The Figure 1. Overlapping projection of groups of species for each GCMversion(subfigure1(a)) and of meta-groups (subfigure1(b)). For
each point, the size is proportional to the number of trees clustered in the group or meta-group, and the colour and stand position correspond to the guild composition of these trees: the more trees fromP(respectively, NPLDand SB) in the group or in the
meta-group, the closer the point to theP(respectively, NPLDand SB) summit of the simplex with green (respectively, red and blue).
Table 2. Ecological description of the meta-groups. From left to right, columns indicate the most abundant species inside each meta-group, the number of trees, the number of species, the maximum DBH(in cm), the diameter increment (in cm yr−1) and the proportions , expressed
in reference to the number of trees, of each regeneration guild(in %).
Guild composition(%) Meta-group Dominating species Number of
trees Number of species Maximum DBH(cm) Mean growth (cm yr−1) P NPLD SB 1 Garcinia punctata 6978 42 37.5 0.11 0.4 1.0 98.6 2 Entandrophragma cylindricum 880 14 112.7 0.49 25.9 66.2 7.9 3 Petersianthus macrocarpus 1810 18 106.9 0.44 10.6 73.3 16.1 4 Bosqueia angolensis 2321 26 96.8 0.75 69.6 5.7 24.7 5 Strombosia grandifolia 461 5 70.8 0.25 3.0 0.0 97.0 6 Staudtia kamerunensis 7042 43 60.6 0.17 3.1 7.0 89.9 7 Celtis zenkeri 5544 42 77.2 0.31 9.6 53.3 37.1 8 Pycnanthus angolensis 2748 14 103.4 0.31 0.0 53.7 46.3 9 Musanga cecropioides 2233 4 100.5 1.27 99.9 0.0 0.1 5 Environ. Res. Lett. 14(2019) 044002
projected stand basal area, quadratic diameter, and carbon biomass in 2099 were significantly higher than the 2005 levels(p-values <10−3), while the projected stand density did not differ from the observed one in 2005 (p-values >0.05). Regarding dynamics, the projected mortality and recruitment in 2099 did not differ from the ones observed in 2005 (p-values >0.05), while the projected growth in 2099 was significantly lower than the 2005 level (p-values <0.01). These results showed evidence of a forest ageing phenomenon with fewer but larger trees and reflected that natural forests in M’Baïki are not at equilibrium(Gourlet-Fleury et al2013).
At the guild level, some differences were also found between projections in 2099 and the observed values in 2005. Projected quadratic diameter and car-bon biomass of NPLDand SBspecies in 2099 were all significantly higher than the observed values in 2005 (p-values <10−3). The basal area of SBspecies was also
significantly higher than the one observed in 2005 (p-value <10−3). Conversely, the basal area and
quad-ratic diameter of P species projected in 2099 were significantly lower than the observed values in 2005 (p-values <0.05). Moreover, projected growth in 2099 was significantly lower for all guilds than the levels observed in 2005(p-values <0.01). Projected mortal-ity in 2099 was significantly higher than observations
for NPLDspecies in 2005(p-value <10−3). We found no difference between projected and observed recruit-ment for all guilds.
At the meta-groups level, the composition remained almost unchanged between observations in 2005 and projections in 2099, and we found no sig-nificant difference in stand density (figure 4).
Pro-jected quadratic diameters in 2099 were significantly higher compared to 2005 observed values for all meta-groups except 4, 5 and9 (significantly lower for meta-group 9). Growth was projected lower in 2099 com-pared to the observed values in 2005 except for meta-groups2 and8. Projected mortality in 2099 was sig-nificantly higher than the observed values in 2005 for meta-groups 2, 3 and9. Recruitment was projected significantly lower for meta-group 1 and significantly higher for meta-groups 5 and8 in 2099 compared to the 2005 observed levels. These results were also con-sistent with forest ageing, with a general decline in growth, and a decreased abundance of pioneers in favour of shade-tolerant species.
3.4. Impacts of climate change on forest structure and dynamics
RCP4.5 and 8.5 scenarios projected a strong impact of climate change on the structure and the dynamics of forest stands, compared to the projections under the Figure 2. Change over time of the mean observed and simulated output variables describing forest structure for each disturbance treatment under different climate scenarios: stand density(in ha−1, subfigure2(a)), stand basal area (in m2ha−1, subfigure2(b)),
quadratic diameter(in cm, subfigure2(c)), above-ground carbon biomass (in teqCO2ha−1, subfigure2(d)), growth (in cm yr−1,
subfigure2(e)), mortality (in yr−1, subfigure2(f)), recruitment (in ha−1yr−1, subfigure2(g)) and turnover (in yr−1, subfigure2(h)).
For both observation and simulations, the three treatments at M’Baïki are plotted separately. Over the calibration period (1992–2005), simulations start from average treatment-specific forest stands in 1992 and integrate historical runs as climate series until 2005. Later on, simulations are run under three climate scenarios: the constant average climate in historical runs between 1992 and 2005, RCP4.5
and RCP8.5. Uncertainty bars around observations correspond to the variability between the M’Baïki sample plots. Uncertainty bars
Figure 3. Average values and standard errors of output variables describing the structure and dynamics of observed and projected forest stands, at the stand and at the guild levels. Structure variables are stand density(in ha−1, subfigure3(a)), tree basal area (in
m2ha−1, subfigure3(b)), quadratic diameter (in cm, subfigure3(c)) and above-ground carbon biomass (in teqCO2ha−1,
subfigure3(d)). Dynamics processes are growth (in cm yr−1, subfigure3(e)), mortality (in yr−1, subfigure3(f)) and recruitment (in
ha−1yr−1, subfigure3(g)) while turnover rate (in yr−1, subfigure3(h)) is also given. For each variable or process, values are indicated at
the whole-stand level(first set, in grey) from left to right, and at the guild level (green, red, blue for P, NPLDand SB,respectively). Each set of barplot is composed of four bars, with more or less saturated colour, representing from left to right: M’Baïki control plot observations between 1992 and 2005(first bar, the most saturated), projected stands under constant climate (second bar, the least saturated), projected states under RCP4.5 and RCP8.5 in 2099 (3rd and 4th bars, respectively, with lower and upper intermediary
saturations).
Figure 4. Same asfigure3, but for meta-groups.
7 Environ. Res. Lett. 14(2019) 044002
baseline scenario(figure3). The same trend, namely
an acceleration of forest dynamics due to an enhance-ment of growth, recruitenhance-ment and mortality processes, was observed in the great majority of the simulations under all scenarios, but with a higher variability for RCP8.5 than for RCP4.5.
Growth increased by a factor of 3.4±1 under RCP4.5 and a factor of 6.8±4 under RCP8.5
com-pared to the baseline scenario. Mortality was multi-plied by 3.7±2 under RCP4.5 and 5.7±3 under
RCP8.5, while recruitment, divided by stand density,
was multiplied by 3.9±2 under RCP4.5 and 5.7±4
under RCP8.5. For the baseline scenario, the turnover
(calculated as the average of mortality and recruitment rates) was found to equal 1.1±0.05% while for the RCP4.5 and 8.5, it equalled 4.7±3% and 7.1±5%
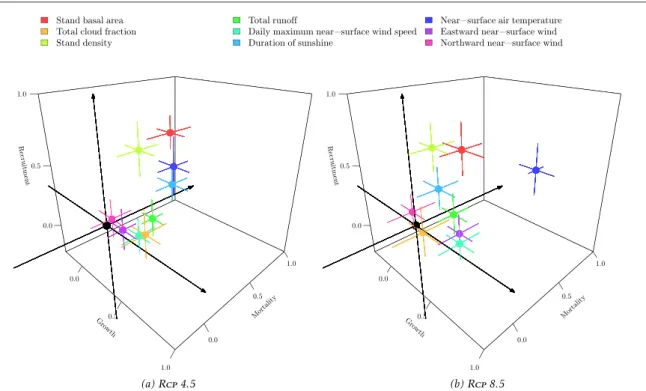
respectively. Considering the contribution of each variable to each dynamic process(figure5), projected
changes of growth appear to be mainly driven by stand basal area and sunshine duration under RCP4.5 and
by temperature under RCP8.5. Projected changes of recruitment appear to be mainly driven by stand basal area and stand density, while projected changes of mortality appear to be driven by temperature and, to a lesser extent, by total runoff.
Climate change significantly impacted the stand density as well as the structural characteristics of the forest: a thinning phenomenon was observed with stand density falling from 588±25ha−1 to 473±48ha−1under RCP4.5 and to 474±81ha−1
under RCP8.5, paralleled with an increase of the
quadratic diameter from 31±1 cm to approximately 33±3 cm under RCP4.5 and 37±4 cm under
RCP8.5.
The impacts of climate change differed from one guild to another. It was found to favourPover SB(no
significant effect on NPLD). The proportion of SBfell from 62±0.5% to 56±4% under RCP4.5 and to
55±5% under RCP8.5, while the proportion of P
increased from 10±0.4% to 16±5% under RCP4.5
and to 17±5% under RCP8.5. Meanwhile, the
pro-portion of NPLDremained around 26%.Pturnover rose from 2.3±0.1% for the baseline scenario, to 6.8±3% under RCP4.5 and 8.2±5% under
RCP8.5. NPLDand SBturnover shared the same pat-tern of increased turnover: from 0.78±0.03% to 3.7±2% and 7.1±5% (NPLD species); from
1±0.04% to 3.8±2% and 7.2±5% (SB species). Dynamic processes appeared to be driven by the same climate variables at the guild-level than at the stand-level(figure S3, same plotting method as in figure5).
NPLDand SBdynamic processes appeared to be driven by a larger number of climate variables thanPdynamic processes, suggesting a higher sensitivity of SB and NPLDto climate variables.
Forest dynamics acceleration, albeit with much more variability under RCP8.5 compared to RCP4.5,
was a general trend projected for all processes and all meta-groups (figure 4), with the sole exception of
recruitment for meta-group1 that decreased with time. The magnitude of increase varied greatly from one meta-group to the other leading to changes in the Figure 5. Trivariate representation of the contribution of explanatory variables, except tree variables DBHand log-DBH, to the change of growth, mortality and recruitment over time, for RCP4.5 and8.5. Segments represent the variability (standard errors) across the
different GCMversions. A value of 1 means that the projected contribution of the variable is perfectly correlated to the projection of the dynamic process based on all the explanatory variables while a null contribution means that the variable does not contribute to the projection of the dynamic process.
composition of the forest. The natural thinning effect projected at the whole-stand level mainly affected the most abundant meta-groups in the control stands, dominated by SB—the relative proportion of
meta-groups 1, 6 and 7 fell from 22±7.1%, 26±8.2%, 23±7.2% in the control stands to 19±5.9%, 21±6.6%, 20±6.5% under RCP8.5—and favoured
meta-group 4 dominated by long-livedP, whose rela-tive proportion doubled from 7±2.1% to 14± 4.6%, and meta-groups dominated by NPLD—the
rela-tive proportion of meta-groups 2 and 3 rose from 4±1.2% and 6±1.9% to 6±1.8% and 9±2.7%.
The climate drivers of dynamic processes were variable across meta-groups(figure S4 and S5, same plotting method as in figure 5). Under RCP4.5,
growth was driven by duration of sunshine for all meta-groups except 9. Under RCP8.5, growth was
driven by temperature for all SB- and NPLD -domi-nated meta-groups, but no driver was found for the growth of P-dominated meta-groups4 and9. For mortality, the temperature was the most relevant vari-able for all meta-groups and scenarios. Under RCP4.5, recruitment was driven by duration of
sun-shine for all meta-groups, by temperature for SB -dominated groups and also by total runoff for meta-group9. Under RCP8.5, temperature was found
rele-vant for the recruitment of P- and SB-dominated meta-groups.
4. Discussion
We used MIMM, a method allowing the simultaneous clustering of species into groups according to dynamic processes(growth, mortality and recruitment) and the identification of group-specific explanatory climate and structure variables. We projected the dynamics of M’Baïki forest stands over the 21st century under a constant climate scenario and under two scenarios of climate change, RCP4.5 and8.5. We showed that
climate change would lead to a sharp acceleration of forest dynamics, with an increase of growth, mortality and recruitment, leading to changes in forest structure and composition, namely a natural thinning effect with fewer but larger trees, and an increase in the relative proportion of pioneers at the detriment of shade-bearers.
4.1. Climate change would accelerate the dynamics of tropical forests
The simultaneous increase of growth, mortality and recruitment, as well as basal area and aboveground biomass, is consistent with historical observations in the M’Baïki forests (Gourlet-Fleury et al2013) and has
already been well documented at a pantropical scale (Malhi et al2014). Our projections are also consistent
with projections from pantropical studies(Lewis et al
2015) and Central African studies (Ludwig et al2013).
Our simulations projected a slight increase of car-bon biomass. This result is also consistent with pre-vious projections in tropical forests which suggested that climate change induces a shift from low-biomass forests to high-biomass forests(Kim et al2017). The
increase of carbon biomass projected in our baseline scenario, without climate change, is consistent with observations of forest ageing. It can be explained by a recovery from past human-induced disturbance (Morin-Rivat et al2014).
4.2. Climate change would affect forest composition by favouring long-lived pioneers
The magnitude of the projected changes in dynamics varies from one group of species to another and this differential response leads to a change in the relative species composition of forest stands, resulting in an increase of the relative proportion of pioneers, at the detriment of shade-bearers. In particular, we projected a rise of long-lived pioneers (meta-group 4) at the detriment of shade-bearers(meta-groups 1, 6 and 7). Compared to shade-bearers, pioneers have higher light requirements, faster growth and are more disturbance-adapted. Some studies have already reported shifts in tree composition favouring fast-growing species over slow-fast-growing ones(Wright2005)
and have hypothesised a response to climate change. The expected higher dominance of pioneers may also raise questions about the future capacity of Central African forests to cope with droughts. Indeed, although pioneers are mostly deciduous and therefore well adapted to seasonal drought, the increase in their dominance may have a negative effect on the global ecosystem resistance to water stress because pioneers that allocate their resources to fast growth are less resistant to water stress(Aubry-Kientz et al2015).
4.3. Climate drivers and particularly temperature have significant effects on the dynamic processes Projected growth appeared to be mainly driven by stand basal area and sunshine duration under RCP4.5
and by temperature under RCP8.5. Projected
recruit-ment of forests is found to be mainly driven by stand basal area and stand density, while projected mortality appeared to be driven by temperature and, to a lesser extent, by total runoff. These results highlight the sensitivity of forests to climate (Anderson-Teixeira et al2013) with sunshine duration (a proxy of the
energy reaching the forest system), water availability and temperature as the main drivers. The positive influence of sunshine duration on growth has already been stressed by Dong et al(2012). The influence of
total runoff as a proxy for water availability, is in line with other studies showing the importance of drought in tree mortality(Phillips et al2010, eg).
The positive correlation between mortality and temperature is consistent with observations fromfield studies (Clark et al 2010). However the positive
9 Environ. Res. Lett. 14(2019) 044002
correlation between growth and temperature contra-dicts most of the results from the Amazon (Aubry-Kientz et al 2015). The temperature-sensitivity of
growth observed in Amazon forests may not be valid in African forests, as the latter are presumably more resilient to climate change than Amazon forests(Malhi et al2014). This contradiction could also be resolved
considering the nonlinearity of relationships between temperature and photosynthesis (Hüve et al 2011):
tropical tree species may be near a high temperature threshold that, if exceeded, will greatly reduce growth (Doughty and Goulden2008). Amazon forests would
already have crossed this threshold whereas Central African forests may still be below it. In this case, our projections might not have captured this threshold effect.
4.4. Meta-groups sharpen differences in species response to climate change that are less evident with guilds
The elaboration of optimal species aggregation techni-ques for modelling the dynamics of species-rich ecosys-tems remains an active research area(Kazmierczak et al
2014). The comparison of several climate calibrations
shows a great similarity in the way species are grouped, making it possible to identify meaningful ecological meta-groups. The identified meta-groups differ in many ways from Hawthorne (1995)ʼs guilds: species
with different dynamic profiles can be distinguished within the same guild, notably among pioneers, while other species are grouped together although they are considered to belong to distinct guilds, notably SBand NPLD. Compared to exogenous guilds, our meta-groups have the advantage to be an endogenous result from the model and to reflect the species-specific dynamic responses to climate variables in a more accurate way than guilds. More generally, in the continuation of the work of Gourlet-Fleury et al(2005), Picard et al (2010)
and Mortier et al(2015), our results show the value of
using dynamics data-driven classifications rather than classifications based on ecological knowledge to simu-late long-term forest dynamics.
To refine the grouping of species based on their response to climate change, further develop-ments can be considered, for example through the ongoing CMIP6(Eyring et al2016) and advances in
the use of extended matrix of GCM-RCM experi-ments(Wilcke and Bärring 2016), or through the
incorporation of ecophysiological processes (Feng et al 2018), especially to deal with the effects of
increased atmospheric CO2. These would offer new
opportunities to enhance the future projections of climate change and to improve the understanding of its impact on tropical forest dynamics(Malhi et al
2014).
Acknowledgments
We thank the Forestry Research Support(ARF, Appui à la recherche forestière) and its seven partners: the French Development Agency(AFD, Agence Française
de Développement), the Centre for International Coop-eration in Agricultural Research for Development (CIRAD, Centre de coopération internationale en
recherche agronomique pour le développement), the CAR
Institute of Agricultural Research (ICRA, Institut Centrafricain de Recherche Agronomique), the Ministry of Waters, Forests, Hunting and Fisheries (MEFCP, Ministère des Eaux, des Forêts, de la Chasse et de la Pêche) of Central African Republic, the Service of Cooperation and Cultural Action (SCAC, Service de coopération et d’action culturelle) of the French Minis-try of Foreign Affairs (MAE, Ministère des Affaires Étrangères), the University of Bangui and the Central African Republic Company of Wood Peeling(SCAD, Société centrafricaine de déroulage) for providing access to the site and to the database of M’Baïki. We are grateful to volunteers appointed by the SCACof MAE
and thefieldworkers who participated in the project management, data collection and data capture. We thank the two anonymous reviewers for the clarity and relevance of their comments, which significantly contributed to improving the quality of the paper.
The Bureau for Economic Theory and Applications contributes to the LABEXARBRE
(ANR-11-LABX-0002-01). Frédéric MORTIERand Mahlet TADESSEwere par-tially supported by a Georgetown Environment Initia-tive award. Sylvie GOURLET-FLEURY was partially supported by the DYNAFFORproject(supported by the French Fund for the Global Environment (FFEM), grant number no. CZZ1636.01D) which also supported the publication.
The authors declare no conflict of interest.
Authors
’ contribution
FC, FM, SGF and NP conceived the ideas and designed methodology. MT helped on methodological aspects and contributed to the results’ discussion. GC sup-ported authors on computational aspects. FaB, FiB and SGF collected and organised the data. DYO and BH contributed to the discussion of results. All authors contributed critically to the drafts and gave final approval for publication.
ORCID iDs
Florian Claeys https: //orcid.org/0000-0003-1765-0520
Sylvie Gourlet-Fleury
https://orcid.org/0000-0002-1136-4307
Guillaume Cornu https: //orcid.org/0000-0002-7523-5176
References
Aloysius N R et al 2016 Evaluation of historical and future simulations of precipitation and temperature in central Africa from CMIP5 climate models J. Geophys. Res.: Atmos.121 130–52
Anderson-Teixeira K J et al 2013 Altered dynamics of forest recovery under a changing climate Glob. Change Biol.19 2001–21
Aubry-Kientz M et al 2015 Identifying climatic drivers of tropical forest dynamics Biogeosciences12 5583–96
Boulvert Y 1986 Carte Phytogéographique de la République Centrafricaine(Bondy, France: ORSTOM (Office de la recherche scientifique et technique Outre-Mer)) Chave J et al 2014 Improved allometric models to estimate the
aboveground biomass of tropical trees Glob. Change Biol.20 3177–90
Clark D B, Clark D A and Oberbauer S F 2010 Annual wood production in a tropical rain forest in NE Costa Rica linked to climatic variation but not to increasing CO2Glob. Change
Biol.16 747–59
Cox P M et al 2004 Amazonian forest dieback under climate-carbon cycle projections for the 21st century Theor. Appl. Climatol.
78 137–56
Dong S X et al 2012 Variability in solar radiation and temperature explains observed patterns and trends in tree growth rates across four tropical forests Proc. R. Soc. B279 3923–31
Dormann C F et al 2013 Collinearity: a review of methods to deal with it and a simulation study evaluating their performance Ecography36 27–46
Doughty C E and Goulden M L 2008 Are tropical forests near a high temperature threshold? J. Geophys. Res.: Biogeosci. 113 G00B07
Eggleston S et al 2006 Agriculture, forestry and other land use 2006 IPCC Guidelines for National Greenhouse Gas Inventories vol 4 (Geneva, Switzerland: IPCC National Greenhouse Gas Inventories Programme) (https://www.ipcc-nggip.iges.or. jp/public/2006gl/vol4.html)
Eyring V et al 2016 Overview of the Coupled Model
Intercomparison Project Phase 6(CMIP6) experimental design and organization Geosci. Model Dev.9 1937–58
Fauset S et al 2012 Drought-induced shifts in thefloristic and functional composition of tropical forests in ghana Ecol. Lett.
15 1120–9
Fayolle A et al 2014 Patterns of tree species composition across tropical African forests J. Biogeogr.41 2320–31
Feng X et al 2018 Improving predictions of tropical forest response to climate change through integration offield studies and ecosystem modeling Glob. Change Biol.24 e213–32
Gourlet-Fleury S et al 2005 Grouping species for predicting mixed tropical forest dynamics: looking for a strategy Ann. Forest Sci.
62 785–96
Gourlet Fleury S et al 2013 Tropical forest recovery from logging: a 24 year silvicultural experiment from Central Africa Phil. Trans. R. Soc. B368 20120302
Griscom B W et al 2017 Natural climate solutions Proc. Natl Acad. Sci.114 11645–50
Hawthorne W 1995 Ecological Profiles of Ghanaian Forest Trees (Oxford: Oxford Forestry Institute, University of Oxford) Henry M et al 2010 Wood density, phytomass variations within and
among trees, and allometric equations in a tropical rainforest of Africa Forest Ecol. Manage.260 1375–88
Hewitson B et al 2012 Cordex-africa: a unique opportunity for science and capacity building CLIVAR Exch. 17 6–7 Huntingford C et al 2013 Simulated resilience of tropical rainforests
to CO2-induced climate change Nat. Geosci.6 268–73
Hüve K et al 2011 When it is too hot for photosynthesis: heat-induced instability of photosynthesis in relation to respiratory burst, cell permeability changes and H2O2
formation Plant, Cell Environ.34 113–26
Jones C, Giorgi F and Asrar G 2011 The coordinated regional downscaling experiment: Cordex, an international downscaling link to cmip5 CLIVAR Exch.16 34–40
Kaufman L and Rousseeuw P J 2005 Finding groups in data: an introduction to cluster analysis Wiley Series in Probability and
Mathematical Statistics(Hoboken, NJ: Wiley) (https://doi. org/10.1002/9780470316801)
Kazmierczak M, Wiegand T and Huth A 2014 A neutral versus non-neutral parametrizations of a physiological forest gap model Ecol. Modelling288 94–102
Kim J B et al 2017 Assessing climate change impacts, benefits of mitigation, and uncertainties on major global forest regions under multiple socioeconomic and emissions scenarios Environ. Res. Lett.12 045001
Lavorel S et al 2007 Plant functional types: are we getting any closer to the holy grail? Terrestrial Ecosystems in a Changing World ed J G Canadell, D E Pataki and L F Pitelka(Berlin: Springer)
pp 149–64
Lennard C J et al 2018 On the need for regional climate information over Africa under varying levels of global warming Environ. Res. Lett.13 060401
Lewis S L, Edwards D P and Galbraith D 2015 Increasing human dominance of tropical forests Science349 827–32
Ludwig F et al 2013 Climate change impacts on the congo basin region Climate Change Scenarios for the Congo Basin, Vol 11 of Climate Service Centre Report ed A Häensler et al(Hamburg, Germany: Climate Service Centre) (http://edepot.wur.nl/ 341523)
Malhi Y et al 2013 African rainforests: past, present and future Phil. Trans. R. Soc. B368 20120312
Malhi Y et al 2014 Tropical forests in the anthropocene Annu. Rev. Environ. Res.39 125–59
Mayaux P et al 2013 State and evolution of the african rainforests between 1990 and 2010 Phil. Trans. R. Soc. B368 20120300
Morin-Rivat J et al 2014 New evidence of human activities during the holocene in the lowland forests of the northern congo basin Radiocarbon56 209–20
Mortier F et al 2013 Population dynamics of species-rich ecosystems: the mixture of matrix population models approach Methods Ecol. Evol.4 316–26
Mortier F et al 2015 Mixture of inhomogeneous matrix models for species-rich ecosystems Environmetrics26 39–51
Moss R H et al 2010 The next generation of scenarios for climate change research and assessment Nature463 747–56
Niang I et al 2014 Climate Change 2007. Impacts, Adaptation and Vulnerability. Part B: Regional Aspects. Contribution of Working Group II to the Fourth Assessment Report of the Intergovernmental Panel on Climate Change In: Africa ed V Barros et al(Cambridge, United Kingdom and New York, NY, USA: Cambridge University Press) pp 1199–265 (https://www.ipcc.ch/site/assets/uploads/2018/02/ WGIIAR5-PartA_FINAL.pdf)
Ouédraogo D Y et al 2013 Slow-growing species cope best with drought: evidence from long-term measurements in a tropical semi-deciduous moist forest of Central Africa J. Ecol.
101 1459–70
Panitz H J et al 2014 Cosmo-clm(cclm) climate simulations over cordex-africa domain: analysis of the era-interim driven simulations at 0.44 and 0.22 resolution Clim. Dyn.42 3015–38
Phillips O L et al 2010 Drought-mortality relationships for tropical forests New Phytologist187 631–46
Picard N et al 2010 Clustering species using a model of population dynamics and aggregation theory Ecol. Modelling221 152–60
Pokam Mba W et al 2018 Consequences of 1.5°C and 2 °C global warming levels for temperature and precipitation changes over Central Africa Environ. Res. Lett.13 055011
Rogelj J et al 2018 Mitigation pathways compatible with 1.5°C in the context of sustainable development Global Warming of 1.5°C an IPCC Special Report on the Impacts of Global Warming of 1.5°C Above Pre-Industrial Levels and Related Global Greenhouse Gas Emission Pathways, in the Context of Strengthening the Global Response to the Threat of Climate Change ed et al(Intergovernmental Panel on Cliamet Chnage) (https://www.ipcc.ch/site/assets/uploads/sites/ 2/2018/07/SR15_SPM_version_stand_alone_LR.pdf)
Samuelsson P et al 2011 The rossby centre regional climate model rca3: model description and performance Tellus A63 4–23
11 Environ. Res. Lett. 14(2019) 044002
Sonwa D J et al 2013 Climate change and adaptation in Central Africa: past, scenarios and options for the future Les forêts du Bassin du Congo -État des Forêts 2013 ed C De Wasseige et al (Belgique: Weyrich Édition, Weyrich) pp 99–119 (http:// agritrop.cirad.fr/578904/1/Forets%20of%20the%20congo %20basin.pdf)
Swann A L S et al 2016 Plant responses to increasing CO2reduce
estimates of climate impacts on drought severity Proc. Natl Acad. Sci.113 10019–24
Taylor K E, Stouffer R J and Meehl G A 2012 An overview of CMIP5
and the experiment design Bull. Am. Meteorol. Soc.93 485–98
Uriarte M, Muscarella R and Zimmerman J K 2018 Environmental heterogeneity and biotic interactions mediate climate impacts on tropical forest regeneration Glob. Change Biol.24 e692–704
Usher M 1966 A matrix approach to the management of renewable resources, with special reference to selection forests J. Appl. Ecol.3 355–67
Usher M 1969 A matrix model for forest management Biometrics2 309–15
Wilcke R A I and Bärring L 2016 Selecting regional climate scenarios for impact modelling studies Environ. Modelling Softw.78 191–201
Wright S 2005 Tropical forests in a changing environment Trends Ecol. Evol.20 553–60
Zanne A et al 2009 Data from: Towards a worldwide wood economics spectrum(Dryad Digital Repository) (https://doi.org/10.5061/dryad.234)
Zelazowski P et al 2011 Changes in the potential distribution of humid tropical forests on a warmer planet Phil. Trans. R. Soc. A369 137–60
Zhang Z et al 2013 Effect of heterogeneous atmospheric CO2on
simulated global carbon budget Glob. Planet. Change101 33–51
Zhou L et al 2014 Widespread decline of Congo rainforest greenness in the past decade Nature509 86–90