RESEARCH ARTICLE
No increasing risk of a limnic eruption at Lake
Kivu: Intercomparison study reveals gas
concentrations close to steady state
Fabian Ba¨renboldID1*, Bertram Boehrer2, Roberto Grilli3, Ange Mugisha4, Wolf von
Tu¨ mpling2
, Augusta Umutoni4, Martin SchmidID1
1 Eawag, Swiss Federal Institute of Aquatic Science and Technology, Surface Waters—Research and
Management, Kastanienbaum, Switzerland, 2 Helmholtz-Centre for Environmental Research–UFZ, Magdeburg, Germany, 3 CNRS, Universite´ Grenoble Alpes, IRD, Grenoble INP, Institut des Ge´osciences de l’environnement, Grenoble, France, 4 Lake Kivu Monitoring Programme LKMP, Gisenyi, Rwanda
*fabian.baerenbold@eawag.ch
Abstract
Lake Kivu, East Africa, is well known for its huge reservoir of dissolved methane (CH4) and carbon dioxide (CO2) in the stratified deep waters (below 250 m). The methane concentra-tions of up to ~ 20 mmol/l are sufficiently high for commercial gas extraction and power pro-duction. In view of the projected extraction capacity of up to several hundred MW in the next decades, reliable and accurate gas measurement techniques are required to closely monitor the evolution of gas concentrations. For this purpose, an intercomparison campaign for dis-solved gas measurements was planned and conducted in March 2018. The applied mea-surement techniques included on-site mass spectrometry of continuously pumped sample water, gas chromatography of in-situ filled gas bags, an in-situ membrane inlet laser spec-trometer sensor and a prototype sensor for total dissolved gas pressure (TDGP). We pres-ent the results of three datasets for CH4, two for CO2and one for TDGP. The resulting methane profiles show a good agreement within a range of around 5–10% in the deep water. We also observe that TDGP measurements in the deep waters are systematically around 5 to 10% lower than TDGP computed from gas concentrations. Part of this difference may be attributed to the non-trivial conversion of concentration to partial pressure in gas-rich Lake Kivu. When comparing our data to past measurements, we cannot verify the previ-ously suggested increase in methane concentrations since 1974. We therefore conclude that the methane and carbon dioxide concentrations in Lake Kivu are currently close to a steady state.
Introduction
Lake Kivu, with a surface area of 2386 km2and a maximum depth of 485 m, is situated on the border between Rwanda and the Democratic Republic of the Congo (DRC). Along with other African great lakes Tanganyika and Malawi, Lake Kivu is part of the East African Rift System (EARS). To the north, Lake Kivu borders on the Virunga volcano chain, while to the South it drains into Lake Tanganyika via the Ruzizi River. Lake Kivu is fed by numerous small streams
a1111111111 a1111111111 a1111111111 a1111111111 a1111111111 OPEN ACCESS
Citation: Ba¨renbold F, Boehrer B, Grilli R, Mugisha
A, von Tu¨mpling W, Umutoni A, et al. (2020) No increasing risk of a limnic eruption at Lake Kivu: Intercomparison study reveals gas concentrations close to steady state. PLoS ONE 15(8): e0237836.
https://doi.org/10.1371/journal.pone.0237836 Editor: Steven Arthur Loiselle, University of Siena,
ITALY
Received: September 16, 2019 Accepted: July 15, 2020 Published: August 25, 2020
Copyright:© 2020 Ba¨renbold et al. This is an open access article distributed under the terms of the
Creative Commons Attribution License, which permits unrestricted use, distribution, and reproduction in any medium, provided the original author and source are credited.
Data Availability Statement: The data from Eawag
are within the manuscript and its Supporting Information files. The data from UFZ are in a separate publication and currently available from:
https://www.hydrol-earth-syst-sci-discuss.net/ hess-2019-228/. The data from CNRS will be in a separate publication and are currently available from:http://dx.doi.org/10.17632/gzvgryw3s5.1.
Funding: MS received grant 160114 from the
Swiss National Science Foundation (www.snf.ch) for the Eawag measurements. RG received funding
[1] and by subaquatic groundwater sources [2] with the latter contributing about 45% of the total inflow. The groundwater sources mainly enter the lake at the northern shore and can be divided into two categories: two cool and fresh sources above a depth of 260 m and several warm, saline and carbon dioxide (CO2)-rich sources below 260 m. This has two main
conse-quences, namely a very stable density stratification due to the salinity gradient, which prevents annual mixing below a depth of 50 to 60 m and the accumulation of dissolved CO2over long
time scales. In addition to CO2, biogenic methane (CH4) is present in the deep waters in large
amounts due to decomposition of organic matter at the lake bottom and CO2reduction [3,4].
Gas concentrations in Lake Kivu were first recorded by Damas in 1935 [5] who measured CO2and H2S. However, Damas only analyzed the sample water after degassing, thus losing
more than half of the CO2to the atmosphere. Between 1952 and 1954, Schmitz and Kufferath
carried out the first CH4measurements and additionally determined CO2concentrations.
However, they only analyzed the gas that outgassed under atmospheric conditions, neglecting the gas remaining dissolved in the water [6]. In 1974, Tietze performed the first comprehensive survey of dissolved gas concentrations, including CH4and CO2from both the gas exsolved
under atmospheric conditions and the remaining part in the sample water [7]. Tietze con-cluded that about 300 km3STP (gas volume at 0˚C and 1 atm) of CO2and 60 km3STP of CH4
were stored in the permanently stratified deep waters (below ~ 60 m) of Lake Kivu [7]. Subse-quently, based on new measurements from M. Halbwachs and J.-C. Tochon in 2003 (pub-lished in [8]), Schmid et al., 2005 suggested that CH4concentrations had increased by 15%
since 1974 and that they could possibly reach saturation within the 21stcentury. With the examples of deadly limnic eruptions due to high gas loads in Lakes Nyos [9] and Monoun [10], it was clear that the gas concentrations of Lake Kivu needed to be monitored. Besides the threat to the local population, the gas content in Lake Kivu also represents a valuable resource: In December 2015, a 26 MW gas power plant was connected to the Rwandan grid and several hundred MW could follow according to projections [11].
In 2017, a gas intercomparison campaign was initiated by the Lake Kivu Monitoring Pro-gramme (LKMP) with the goal of 1) accurately determining CH4and CO2concentrations
using different methodologies and 2) finding an appropriate technique to regularly monitor the gas concentrations in the future. However, gas sampling in highly outgassing environ-ments is challenging and thus, the measurement methods had to be adapted accordingly. In this work, we describe the methodologies for three research teams involved in the campaign: The Swiss Federal Institute of Aquatic Science and Technology (Eawag), the Helmholtz Centre for Environmental Research (UFZ) and the National Center of Scientific Research in France (CNRS). Subsequently, we present the results of each group and compare them to the previous measurements of Tietze in 1974 [7] and Halbwachs and Tochon in 2003 and Schmid in 2004 (both published in [8]). Finally, we reevaluate the gas (CH4and CO2) content in Lake Kivu
and its potential change in time.
Materials and methods
The intercomparison campaign took place close to Gisenyi/Rubavu, Rwanda (1.74087˚S / 29.22602˚E) from 9 to 13 March 2018 and involved research teams from Eawag, UFZ, CNRS and from the power plant operator KivuWatt. Eawag prolonged its measurement period until 18 March and UFZ also included earlier measurements from 2017. The campaign was planned and organized by LKMP and therefore, no special permit was necessary to perform measure-ments on the lake. Further details on the results of the campaign can also be found in a report to LKMP [12]. Note that while the report includes the measurements of KivuWatt, the latter decided to not be part of this publication.
from the European Community’s Seventh Framework Programme ERC-2015-PoC under grant agreement no. 713619 (ERC OCEAN-IDs) and from the Agence Nationale de la Recherche (ANR) under grant agreement ANR-18-CE04-0003-01. Authors AU and AM are staff of the unit LKMP (Lake Kivu Monitoring Programme) of EDCL (Energy Development Corporation Limited) which is a subsidiary of the Rwandan Energy Group Limited (REG). EDCL/LKMP supported the involved research teams with local transport and help with field work. In addition, they paid the flight to Rwanda and accommodation in Rwanda for the participants of UFZ (authors BB and WvT) and CNRS (author RG). The specific roles of these authors are articulated in the ‘author contributions’ section. The funders had no other role in study design, data collection and analysis, decision to publish, or preparation of the manuscript.
Competing interests: The authors have read the
journal’s policy and the authors of this manuscript have the following competing interests: Authors AU and AM are affiliated to EDCL (Energy
Development Corporation Limited) which is a subsidiary of the Rwandan Energy Group Limited (REG). The latter is a government-owned company that is responsible for the import, export, procurement, generation, transmission, distribution and sale of electricity in Rwanda. Within EDCL, AU is leading the Lake Kivu Monitoring Programme (LKMP), which is responsible for monitoring the impacts of methane gas extraction on Lake Kivu. Because of their interest in high-accuracy gas measurements, the LKMP/EDCL supported the involved research teams with local transport and help with field work. In addition, they paid the flight to Rwanda and accommodation in Rwanda for the participants of UFZ (authors BB and WvT) and CNRS (author RG). There are no patents, products in development or marketed products to declare. This does not alter our adherence to PLOS ONE policies on sharing data and materials.
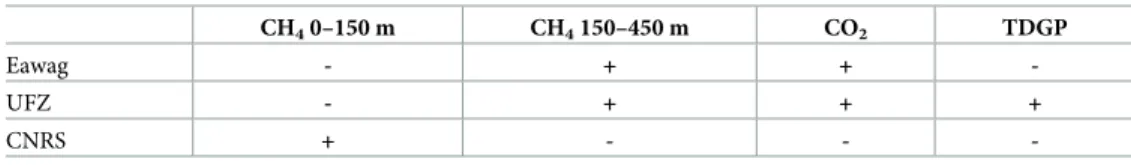
The measurements taken by each research team are summarized inTable 1. In this publica-tion, only the approach of Eawag is explained more comprehensively, while further details on the methods of UFZ and CNRS can be found elsewhere ([13,14]). In the following, we will first present the methodology of Eawag and then shortly summarize the approaches of UFZ and CNRS.
Measurement method used by Eawag
The measurement setup was built around “miniRuedi”, a gas-equilibrium portable mem-brane-inlet mass spectrometric system (GE-MIMS) which allows on-site quantification of dif-ferent dissolved gases in water (i.e. N2, O2, CO2, CH4, He, Ar, see [15]). The continuous
sampling water flow (~ 1 L/min) required to maintain gas equilibrium at the MS inlet was pro-vided by a submersible pump (0.75 kW, Lechner Pumpen) and 250 m long, 6 mm inner diam-eter polyamide (PA) tubing. The pump was used only above 250 m and yielded a flow of ~ 1.6 L/min. Below 250 m, TDGP increases drastically and, following initiation of the flow by a suc-tion pump at the surface, the buoyancy due to bubble formasuc-tion within the tube was sufficient to lift the water to the surface. 10 mm PA tubing was used in this case and the resulting flow was ~ 1 L/min (except between 270 and 310 m where it was ~ 0.5 L/min only). The water-gas mixture was subsequently dispersed through a nozzle into a custom-made cylindrical equili-bration chamber (12.3 cm diameter, 38 cm height, see Fig 1 inS1 Appendix). While the degassed sample water accumulated and discharged at the bottom of the chamber, the gas phase stayed above and left the chamber through a tube at the top. The gas content in the gas phase and the water phase (via a headspace created by the membrane contactor Liqui-Cel G542, 260 cm3external volume) was analyzed by the “miniRuedi”. Finally, gas and water flow rates were recorded to compute in-situ gas concentrations in the lake as sketched in Fig 1 inS1
Appendix. The overall analytical accuracy (i.e. the maximum deviation from the true value) of
the setup was deduced from the accuracies of its individual components and estimated to around± 5% for CO2and± 10% for CH4in the deep water (seeS1 Appendixfor more details).
Measurements were done at a resolution of 20 m starting from 10 m depth down to 450 m (430 m was omitted due to time constraints). Between 90 and 130 m, the gas flow was too low to be quantified but still substantial enough to have an effect on gas results. Therefore, results for this depth range are not reported.
The mass spectrometer was calibrated using two gas standards (80% CO2+ 20% CH4and
60% CO2+ 30% CH4+ 10% air) with partial pressures similar to the average gas composition
of water gassing out from Lake Kivu deep water. One of the gas standards additionally con-tained atmospheric air for potential calibration of N2and O2. However, in the special setting
of Lake Kivu, the determination of N2at mass/charge = 28 proved to be difficult because of the
presence of a large peak of CO from the fragmentation of CO2during ionization in the mass
spectrometer. The interference of the CO fragment accounted for more than 95% of the inten-sity at mass 28. Therefore N2could not be determined reliably and hence was not included in
this publication.
Table 1. Summary of gas measurements performed by the different research teams of Eawag, UFZ and CNRS.
CH40–150 m CH4150–450 m CO2 TDGP
Eawag - + +
-UFZ - + + +
CNRS + - -
-The “+” indicates which measurements were performed by which groups.
Measurement method used by UFZ
The measurement method used by UFZ had previously been used in highly gas charged mine pit lakes (for CO2see [16], for CH4see [17]) and was modified for the conditions of Lake Kivu
by [13]. Water was sampled using gas-tight bags, which were lowered to the appropriate depth together with a small pump and an automatic pump controller. The pump partially filled the bags while leaving enough space for the gas phase, which forms once the bags are retrieved. At the surface, the water and gas phases in the bags were equilibrated over night and the composi-tion of the gas phase was analyzed using a gas chromatograph. Subsequently, the remaining amount of gas in the water phase was deduced by assuming equilibrium between gas and water phase. In order to compute in-situ gas concentrations, the gas and water volumes in the bag were determined using a syringe and a laboratory scale respectively. Total uncertainties for CH4(CO2) concentrations were determined as± 5 (± 6) % below and ± 7 (± 8) % above
250 m. Note again that these uncertainties should be interpreted as maximum deviation from the true value. The UFZ group also measured total dissolved gas pressure (TDGP) using a pro-totype probe from Pro Oceanus with an accuracy of± 0.04 bar according to the manufacturer.
Measurement method used by CNRS
The measurement method applied by CNRS is fully described elsewhere [14]. In short, an in-situ membrane-inlet laser spectrometer (MILS), called SubOcean, was deployed for continu-ous dissolved CH4measurements. The instrument is based on a patented membrane
extrac-tion system [18] coupled to an optical spectrometer for trace gas sensing based on an optical feedback cavity enhanced absorption spectroscopy (OFCEAS) technique [19,20]. The extrac-tion system does not rely on gas equilibraextrac-tion across the membrane, but the dry side of the membrane is maintained at low pressure while continuously flushing it with dry zero air. This allows achieving fast response times < 30 sec, making the technique adapted for fast 3D map-ping of water masses [21]. The accuracy (standard deviation at the three sigma level) of the measurements was quantified to be± 33% from repeated measurements at the same depth. Note that the uncertainty is given at the three sigma level, which we judge roughly equivalent to the concept of “maximum deviation from the true value” used for the other two methods. In addition to the CH4signal, this method needs external TDGP and dissolved CO2
measure-ments in order to compute CH4partial pressure in the lake water, which is finally converted to
concentrations using the conversion method presented below.
Conversion from concentration to partial pressure
Eawag and UFZ measured gas concentrations while the MILS sensor used by CNRS provided partial gas pressure. In order to compare these results, conversion from concentration to par-tial pressure and vice-versa is required. However, this conversion is not straightforward as the gas-water partition coefficients (Henry coefficients) depend on temperature, salinity and hydrostatic pressure [22]. In addition, the fugacity effect cannot be calculated separately for each gas since it depends on the relative mixture of the involved gas species [23]. We thus express concentrationCias a function of partial pressurepiby the following equation:
Ci¼KiðT; S; PÞpiφiðT; PÞ ð1Þ
withφithe fugacity coefficient i.e. the ratio between the fugacity of a gas and its partial pressure
at temperature T and pressure P, andKithe solubility coefficient, i.e. the ratio between the
dis-solved concentration of a gas and its fugacity. The solubility coefficientKi(T,S) is computed as
The salinity terms of these equations were originally derived for sea salt and not for Lake Kivu, where salinity is dominated by bicarbonates. We accounted for this by assuming that the salin-ity effect mainly depends on the ionic strength of the solution. More details about the salinsalin-ity correction are provided inS2 Appendix.
According to [22], the dependence of the solubility coefficientKion local total pressure
(hydrostatic plus atmospheric pressure) can be written as
KiðT; S; PÞ ¼KiðT; SÞe ð1RTPÞvi
� �
: ð2Þ
Here, R = 83.1446 cm3bar K−1mol−1is the gas constant, andviare the partial molar
vol-umes (cm3mol-1). The partial molar volumes of CO2and N2were assumed constant at 32.3
cm3mol-1[22] and 35.7 cm3mol-1[26] respectively, while for CH4it was calculated according
to [27].
The resulting pressure correction factorsKi(T,S,P)/Ki(T,S) range between 1.00 at
atmo-spheric pressure and 0.93 (CO2) or 0.94 (CH4) at 50 bar (485 m depth), i.e. the in-situ pressure
reduces the solubility coefficient of the gases by 6 to 7% in the lowest layers of Lake Kivu. The fugacity coefficientsφi(T,P) of CO2, CH4and N2, including the interaction between the
gases, are computed according to [23] (Octave scripts available inS3 Appendix).
Results and discussion
Eawag results
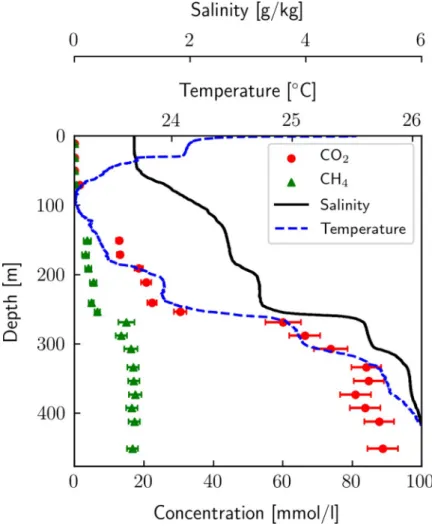
The resulting CH4and CO2concentrations using the Eawag mass spectrometer setup are
depicted inFig 1, along with temperature and salinity profiles. We can identify the well-mixed epilimnion with constant salinity (above ~ 60 m) and the main chemocline at ~ 255 m. As expected, gas concentrations correlate well with salinity and temperature due to the common hydrothermal origin of CO2, dissolved solids and heat [8]. The detailed CH4and CO2results
can be found inS1 Table.
Contamination with atmospheric air is a major source of measurement errors in gas con-tent analysis. Thus, we use our O2results to estimate the maximum atmospheric
contamina-tion affecting our measurements in the completely anoxic deep waters of Lake Kivu. We find that the mixing ratio of O2in the sampled gas phase is always less than 1% (maximum between
270 and 310 m due to lower water flow at these depths). Most likely, this O2signal indicates a
small contamination with atmospheric air. However, it could stem from gas fragmentation during ionization in the mass spectrometer. Independently of its origin, the signal is small enough to not significantly affect the CH4and CO2results.
Intercomparison of CH
4and CO
2using past and new measurements
The results of the dissolved gas measurements (CH4and CO2) of Eawag, UFZ [13] and CNRS
[29] are shown inFig 2. For both CH4and CO2, the measurements agree well within the
uncertainties of the different approaches. The profile from Eawag shows higher CH4
concen-trations (up to 10%) than UFZ between 250 and 350 m depth, whereas UFZ measured higher CH4and CO2concentrations (up to 5%) below 400 m. In particular, the UFZ profile indicates
further increasing CH4and CO2concentrations with depth below 400 m, while the Eawag
pro-file levels off or even decreases. However, note that the comparison below 400 m is based on very few measurement points. The results of Eawag, UFZ and CNRS show a good agreement at their junction at 150 m, thus validating the conversion method under moderate hydrostatic pressure.
In order to estimate the total gas content in the lake, we need to derive quasi-continuous depth profiles for CH4and CO2from the measurements depicted inFig 2. We chose to
inter-polate the discrete profiles by fitting them to an electric conductivity profile (corrected to 25˚C), because i) conductivity is most probably closely related to gas concentrations due to the long residence time in the lake and because similar transport processes affect both dissolved solids and gases [30] and ii) it can be easily measured at a high resolution.
The following procedure was applied to derive high-resolution curves for the CH4and CO2
concentrations measured by UFZ and Eawag: The conductivity profile fromFig 1was extended down to 480 m depth using the background conductivity profile published by [2]. The latter was corrected with the mean difference between both profiles in their lowest com-mon 20 m. From this profile, we then extracted the conductivity values at the depths of the gas measurements of UFZ and Eawag. Then, a 6thorder polynomial function was fitted (R2>
0.995 for all four profiles) with conductivity as the independent and gas concentrations as the dependent variables. The regression was used to compute the gas concentration as a function of conductivity and to relate it to depth. The resulting curves are shown inFig 3(at 0.5 m
Fig 1. Dissolved CH4and CO2profiles by Eawag. Dissolved CH4and CO2concentrations measured in Lake Kivu by Eawag in 2018; salinity and temperature were determined using a CTD from Sea and Sun in 2017 and 2018
respectively. The conversion from conductivity to salinity was done according to [28] using ionic composition. Gas concentrations between 90 and 130 m could not be measured due to too high gas load for using a membrane contactor only, but not high enough for the use of our equilibration chamber.
resolution), along with previous CH4and CO2measurements. The uncertainties of the
previ-ous measurements were assumed to be± 5% for Tietze [7],± 4% for Halbwachs and Tochon [8] and± 10% for Schmid ([8] and pers. comm. M. Schmid).
In general, previous and current measurements are in good agreement. For both CH4and
CO2, the measurements of 1974 are at the lower end of the spectrum, and those of 2003 at the
higher end. From this fact, [8] concluded that CH4concentrations had increased by 15% from
1974 to 2003 and that they could possibly reach saturation within the 21stcentury. Pasche et al. [4] later determined an upper bound for the CH4increase of around half this value based on
carbon cycle analysis. However, our new measurements show no measurable increase of CH4
(and CO2) concentrations within the last 45 years. This implies that the measured differences
Fig 2. Comparison of CH4and CO2results from CNRS, Eawag and UFZ in 2018. Eawag and UFZ directly
determined gas concentration while CNRS measured quasi-continuous partial CH4pressure, which was converted to concentration using the conversion method presented above.
were largely due to measurement uncertainty and that the CH4and CO2concentrations in the
lake are currently close to a steady state.
Risk assessment using total dissolved gas pressure (TDGP)
In order to assess the danger of a potential gas eruption associated with the high gas concentra-tions in Lake Kivu, it is helpful to look at gas pressure saturation within the lake. CH4and CO2
concentrations thus need to be converted to partial pressure using the conversion method pre-sented in the previous section. Besides CH4and CO2, dissolved nitrogen (N2) is the only gas
present in sufficient amounts to influence gas pressure. As no N2data is available for Lake
Fig 3. Interpolated CH4and CO2concentrations from this work compared to previous measurements. CH4and CO2concentrations of Eawag and UFZ are interpolated by fitting the profiles to a conductivity profile; shaded areas represent the uncertainties. Selected previous gas measurements are shown for comparison [7,8].
Kivu, we estimated its contribution assuming that it mimics the profile of atmospheric noble gases which show concentrations close to air saturated water (ASW) at the lake surface and a decrease of ~50% in the deep water [31]. The derived N2profile was subsequently included in
the conversion algorithm, which includes the effect of gas mixture between CH4, CO2and N2
on the fugacity coefficients.
The accuracy of the calculated TDGP is estimated from the accuracies of the gas/water flow measurements and the CH4concentration in the gas phase. The contributions to the accuracy
from CO2and N2are negligible in comparison to CH4because of the high solubility of CO2
and low concentration of N2.
Fig 4shows that calculated TDGP of Eawag and UFZ and direct TDGP measurements
using the Pro Oceanus sensor are in good agreement, usually well within the uncertainties of the respective methods. Still, below 250m depth, TDGP calculated from Eawag and UFZ data is slightly higher than the measured TDGP. The mean difference between calculated and mea-sured TDGP is 5.9% (maximum of 8.7% at 290 m) and 4.4% (maximum of 8.8% at 417 m) for Eawag and UFZ respectively. This discrepancy could be due to a bias in the conversion of con-centrations to partial pressures, to an overestimation of concon-centrations by both Eawag and UFZ or to a problem of calibration of the TDGP sensor at high pressure.
Gas concentrations are very high in the deep water of Lake Kivu. If this gas was released to the atmosphere, it would cause a large catastrophe by suffocating humans and animals in the surrounding area, qualitatively similar to the events at Lake Nyos in 1986 [9]. Currently, total dissolved gas pressure (TDGP) is well below absolute pressure (hydrostatic plus atmospheric pressure) at all depths in Lake Kivu. The maximum gas saturation in terms of pressure is reached at 320 m and amounts to ~ 50% (or a maximum of 57% if we take the upper limit of the uncertainty range of the Eawag data). This means that the gas concentrations are still far
Fig 4. Comparison of measured TDGP with TDGP calculated from gas concentrations. TDGP is calculated from
individual gas components (CH4, CO2and N2) using the conversion algorithm presented in this work. The
concentration profile of N2was derived assuming a similar depth profile as Neon [31] thus not accounting for possible biological effects on N2.
away from the point of spontaneous ebullition (i.e. close to 100% saturation). Nevertheless, volcanic structures on the lake floor indicate frequent volcanic activity within the lake in the geologically recent past [32]. We cannot exclude that similar volcanic activity could trigger a gas eruption from the lake in the future, even though TDGP is far away from saturation. Therefore, in spite of no measurable increase of gas concentrations during the last 45 years, artificial degassing is still beneficial to reduce the danger of a potential natural disaster.
Update of Lake Kivu gas reserves
We estimated the gas content of Lake Kivu by multiplying our interpolated gas profiles (Fig 3) by the lake area at each depth and subsequent integration over the lake depth at a resolution of 0.5 m. The lake areas were deduced from the bathymetry of Lake Kivu by K.A. Ross from the blended bathymethric data of [32,33]. Tables2and3show the gas content in different depth ranges for CH4and CO2respectively. The average CH4estimate from the 2018 campaign
Table 2. CH4content in Lake Kivu in km3STP for different depth ranges.
Depth range [m] Eawag 2018 UFZ 2018 CNRS 2018 Average Halbwachs 2003
0–70 - - 0.1± 0.3 0.1 70–150 - - 6.5± 2.1 6.5 150–200 5.8± 1.6 5.7± 0.4 - 5.7 200–260 8.5± 1.3 8.2± 0.5 - 8.3 8.5 260–300 12.5± 1.7 12.1± 0.6 - 12.3 300–350 14.7± 1.6 13.8± 0.7 - 14.2 350–400 9.5± 0.9 9.4± 0.5 - 9.5 400–480 5.5± 0.5 5.7± 0.3 - 5.6 Resource zone (260–480) 42.2± 4.8 40.9± 2.0 - 41.5 44.7
Upper resource zone (260–310) 15.6± 2.1 15.0± 0.7 - 15.3
Lower resource zone (310–480) 26.6± 2.6 26.0± 1.3 - 26.3
Entire lake 62.2 65.1
The reference values (Halbwachs 2003) were calculated in [34] based on the data of M. Halbwachs and J.-C. Tochon in [8]. The resource zones are defined as in [11], but including half of the bordering gradients.
https://doi.org/10.1371/journal.pone.0237836.t002
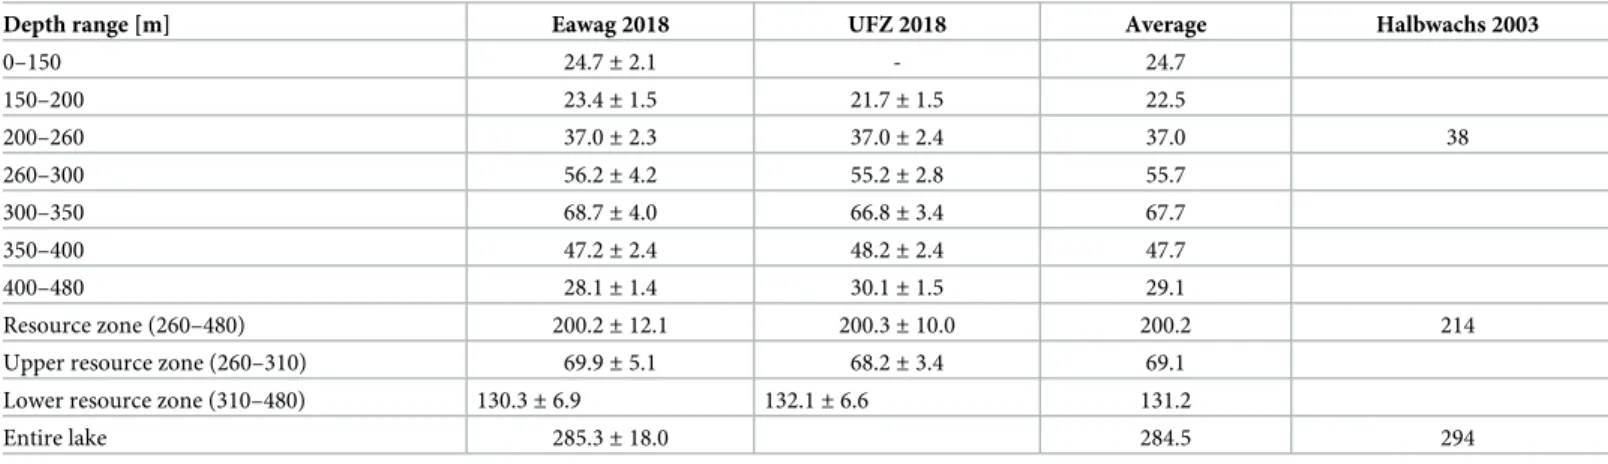
Table 3. CO2content in Lake Kivu in km3STP for different depth ranges.
Depth range [m] Eawag 2018 UFZ 2018 Average Halbwachs 2003
0–150 24.7± 2.1 - 24.7 150–200 23.4± 1.5 21.7± 1.5 22.5 200–260 37.0± 2.3 37.0± 2.4 37.0 38 260–300 56.2± 4.2 55.2± 2.8 55.7 300–350 68.7± 4.0 66.8± 3.4 67.7 350–400 47.2± 2.4 48.2± 2.4 47.7 400–480 28.1± 1.4 30.1± 1.5 29.1 Resource zone (260–480) 200.2± 12.1 200.3± 10.0 200.2 214
Upper resource zone (260–310) 69.9± 5.1 68.2± 3.4 69.1
Lower resource zone (310–480) 130.3± 6.9 132.1± 6.6 131.2
Entire lake 285.3± 18.0 284.5 294
The reference values (Halbwachs 2003) were calculated in [34] based on the data of M. Halbwachs and J.-C. Tochon in [8]. The resource zones are defined as in [11], but including half of the bordering gradients.
shows slightly lower values in the resource zone (7%) and in the entire lake (4.5%) than calcu-lated from the data of Halbwachs and Tochon 2003 (published in [8]). Similarly, the CO2
con-tent measured in 2018 is 6.5% lower in the resource zone and 3% lower for the entire lake. We do not think that this apparent decrease in gas concentrations since 2003 reflects the real gas dynamics in Lake Kivu because i) the total CH4extracted by the existing power plant was less
than 0.2 km3until March 2018 [11] and therefore not measurable by current methods, ii) the residence time of gases in the deep water is on the order of 1000 years [34] and iii) to our knowledge, there is no process that would consume either CO2or CH4under the conditions
present in the deep water of Lake Kivu (i.e. below 70 m [35]).
Schmid et al. [8] suggested a CH4production rate of 120 g C/m2/year (grams of carbon in
CH4per sediment area pear year) in order to explain the difference between the CH4profiles
of K. Tietze in 1974 and M. Halbwachs and J.-C. Tochon in 2003. This rate would lead to a CH4increase of about 5–10% since 2003 (i.e. 3–6 km3) and thus can be excluded based on our
data. Similarly, we can rule out a production rate of 93 g C/m2/year in the deep water as proposed by [4]. Based on our data from 2018, we suggest that the actual production rate of CH4is probably close to the steady state rates of 32 and 35 g C/m
2
/year calculated by [4,8] respectively.
We conclude that the variability of gas concentrations measured in the last 45 years is due to the uncertainties of the applied methods. In contrast to previous work [8], our data suggests that the lake gas content is currently close to a steady state with no or small net recharge rate. Consequently, the risk of a gas eruption does not seem to be increasing over time. Addition-ally, our findings question whether the methane in Lake Kivu is replenished fast enough to be used as a long-term energy source, once the current methane storage has been exploited.
The CH4content amounts to around 41.5 km3STP in the resource zone (between 260 and
480 m) and 62.2 km3in the whole lake. Furthermore, the results of the two methodologies suit-able for deep water gas analysis (Eawag and UFZ) agree within the expected accuracy of 5–10% for both CH4and CO2. For regular gas monitoring in view of increased industrial gas
extraction, the method of UFZ is easier to apply due to the use of relatively simple equipment. The prototype MILS sensor used by CNRS was able to record gas concentrations down to a depth of 150 m and provides the advantage of in-situ, fast and high-resolution data. However, the technique was not yet adapted to the high CH4concentration below 150 m in Lake Kivu.
In addition, the sensor requires total dissolved gas pressure (TDGP) and dissolved CO2
pro-files to determine CH4partial pressure. The direct measurement of TDGP may be the most
appropriate measurable quantity to monitor the risk of a spontaneous ebullition in the lake in the future. It also has the advantage of offering simple, reproducible and high-precision mea-surements for further monitoring purposes (see for example [36]).
Supporting information
S1 Table. Detailed results of Eawag measurement method.
(DOCX)
S2 Table. Temperature data from a Sea and Sun CTD.
(TXT)
S3 Table. Salinity data computed using conductivity data.
(TXT)
S1 Appendix. Detailed description of Eawag measurement method and calculations.
S2 Appendix. Calculation of salinity effect of Lake Kivu dissolved solids.
(DOCX)
S3 Appendix. Octave scripts for conversion of concentration to partial pressure.
(DOCX)
Acknowledgments
Michael Plu¨ss and Reto Britt for help with the development of sampling equipment and field-work. Ivo Beck, Maximilian Schmidt (Heidelberg University) and the team of LKMP (Lake Kivu Monitoring Programme), especially Epaphrodite Havugimana and Pierre Simbizi for help with fieldwork. Matthias Brennwald for assistance with the “miniRuedi” mass spectrome-ter. Serge Robert and Patrick Kathriner for helpful discussions about gas measurements. Nic Spycher (Lawrence Berkeley National Laboratory) for discussing and reviewing the pressure-concentration conversion method and Zaman Ziabakhsh-Ganji (TU Delft) for providing maple scripts for computing fugacity coefficients.
Author Contributions
Conceptualization: Fabian Ba¨renbold, Bertram Boehrer, Roberto Grilli, Ange Mugisha, Wolf
von Tu¨mpling, Augusta Umutoni, Martin Schmid.
Funding acquisition: Martin Schmid.
Investigation: Fabian Ba¨renbold, Bertram Boehrer, Roberto Grilli, Ange Mugisha, Wolf von
Tu¨mpling.
Methodology: Fabian Ba¨renbold, Bertram Boehrer, Roberto Grilli, Martin Schmid. Project administration: Ange Mugisha, Augusta Umutoni.
Supervision: Martin Schmid.
Writing – original draft: Fabian Ba¨renbold, Martin Schmid.
Writing – review & editing: Fabian Ba¨renbold, Bertram Boehrer, Roberto Grilli, Ange
Mugisha, Wolf von Tu¨mpling, Augusta Umutoni, Martin Schmid.
References
1. Muvundja FA, Wu¨est A, Isumbisho M, Kaningini MB, Pasche N, Rinta P, et al. Modelling Lake Kivu water level variations over the last seven decades. Limnologica-Ecology and Management of Inland Waters. 2014; 47:21–33.
2. Ross KA, Gashugi E, Gafasi A, Wu¨est A, Schmid M. Characterisation of the subaquatic groundwater discharge that maintains the permanent stratification within Lake Kivu; East Africa. PloS one. 2015; 10 (3) e0121217.https://doi.org/10.1371/journal.pone.0121217PMID:25799098
3. Schoell M, Tietze K, Schoberth SM. Origin of methane in Lake Kivu (east-central Africa). Chemical Geology. 1988; 71(1–3):257–265.
4. Pasche N, Schmid M, Vazquez F, Schubert CJ, Wu¨est A, Kessler JD, et al. Methane sources and sinks in Lake Kivu. Journal of Geophysical Research: Biogeosciences, 2011; 116(G3):G001690.
5. Damas H. La stratification thermique et chimique des lacs Kivu E´ douard et Ndalaga (Congo Belge). Internationale Vereinigung fu¨r theoretische und angewandte Limnologie: Verhandlungen, 1938; 8 (3):51–68.
6. Schmitz DM, Kufferath J. Problèmes pose´s par la pre´sence de gaz dissous dans les eaux profondes du lac Kivu. Bulletin des Se´ances de l’Acade´ mie Royale des Sciences Coloniales. 1955; 1:326–356.
7. Tietze K. Geophysikalische Untersuchung des Kivusees und seiner ungewo¨hnlichen Methangaslager-sta¨tte-Schichtung, Dynamik und Gasgehalt des Seewassers [dissertation]. Christan-Albrechts- Univer-sita¨t zu Kiel; 1978.
8. Schmid M, Halbwachs M, Wehrli B, Wu¨est A. Weak mixing in Lake Kivu: new insights indicate increas-ing risk of uncontrolled gas eruption. Geochemistry, Geophysics, Geosystems. 2005; 6(7), Q07009.
9. Kling GW, Clark MA, Compton HR, Devine JD, Evans WC, Humphrey AM, et al. The 1986 Lake Nyos gas disaster in Cameroon, West-Africa. Science. 1987; 236(4798): 169–175https://doi.org/10.1126/ science.236.4798.169PMID:17789781
10. Sigurdsson H, Devine JD, Tchoua FM, Presser TS, Pringle MKW, Evans WC. Origin of the lethal gas burst from Lake Monoun. Cameroun, Journal of Volcanology and Geothermal Research. 1987; 31(1– 2):1–16.
11. Expert Working Group on Lake Kivu Gas Extraction. Management prescriptions for the development of Lake Kivu gas resources. Report prepared for the Ministry of Infrastructure of the Republic of Rwanda and the Ministry of Hydrocarbons of the Democratic Republic of the Congo, 2009 June.
12. Schmid M, Ba¨renbold F, Boehrer B, Darchambeau F, Grilli R, Triest J, et al. Intercalibration Campaign for Gas Concentration Measurements in Lake Kivu, Report prepared for the Lake Kivu Monitoring Pro-gramme (LKMP) of the Energy Development Corporation Limited (EDCL), Kigali, Rwanda, 2018.
13. Boehrer B, von Tu¨mpling W, Mugisha A, Rogemont C, Umutoni A. Reliable reference for the methane concentrations in Lake Kivu at the beginning of industrial exploitation. Hydrol Earth Syst Sci. 2019; 23: 4707–4716
14. Grilli R, Triest J, Chappellaz J, Calzas M, Desbois T, Jansson P, et al. SUB-OCEAN: subsea dissolved methane measurements using an embedded laser spectrometer technology. Environmental Science & Technology. 2018; 52(18): 10543–10551.
15. Brennwald MS, Schmidt M, Oser J, Kipfer R. A portable and autonomous mass spectrometric system for on-site environmental gas analysis. Environmental Science & Technology. 2016; 50(24):13455– 13463.
16. Boehrer B, Yusta I, Magin K, Sanchez-España J. Quantifying, assessing and removing the extreme gas load from meromictic Guadiana pit lake, Southwest Spain. Science of the Total Environment. 2016; 563–564:486–477.https://doi.org/10.1016/j.scitotenv.2016.04.124
17. Horn C, Metzler P, Ullrich K, Koschorreck M, Boehrer B. Methane storage and ebullition in monimolim-netic waters of polluted mine pit lake Vollert-Sued, Germany. Science of the Total Environment. 2017; 584–585:1–10.https://doi.org/10.1016/j.scitotenv.2017.01.151PMID:28131935
18. Triest J, Chappellaz J, Grilli R. Patent 08276–01: System for fast and in-situ sampling of dissolved gases in the ocean, CNRS, Grenoble, France. 2017.
19. Morville J, Romanini D, Chenevier M. Patent WO03031949, Universite J. Fourier, Grenoble, France. 2003.
20. Morville J, Romanini D, Kerstel E. Cavity enhanced absorption spectroscopy with optical feedback. In: Gagliardi G, Loock HP, editors. Cavity-Enhanced Spectroscopy and Sensing. Berlin: Springer;2014. p. 163–209.
21. Jansson P, Triest J, Grilli R, Ferre´ B, Silyakova A, Mienert J, et al. High-resolution under-water laser spectrometer sensing provides new insights to methane distribution at an Arctic seepage site. Ocean Sci. 2019; 15:1055–1069.
22. Weiss RF. Carbon dioxide in water and seawater: the solubility of a non-ideal gas. Marine Chemistry. 1974; 2:203–215.
23. Ziabakhsh-Ganji Z, Kooi H. An Equation of State for thermodynamic equilibrium of gas mixtures and brines to allow simulation of the effects of impurities in subsurface CO2storage. International Journal of
Greenhouse Gas Control. 2012; 11S:S21–S34.
24. Wiesenburg DA, Guinasso NL. Equilibrium solubilities of methane, carbon monoxide and hydrogen in water and seawater. Journal of Chemical and Engineering Data. 1979; 24(4): 357–360.
25. Weiss RF. The solubility of nitrogen, oxygen and argon in water and seawater. Deep Sea Research and Oceanographic Abstracts. 1970; 17(4): 721–735.
26. Moore JC, Battino R, Rettich TR, Handa YP, Wilhelm E. Partial molar volumbes of gases at infinite dilu-tion in water at 298.15 K. Journal of Chemical and Engineering Data. 1982; 27(1):22–24.
27. Rettich TR, Handa P, Battino R, Wilhelm E. Solubility of gases in liquids. 13. High-precision determina-tion of Henry’s constants for methane and ethane in liquid water at 275 to 328 K. Journal of Physical Chemistry. 1981; 85(22):3230–3237.
28. Wu¨est A, Piepke G, Halfman JD. Combined effects of dissolved solids and temperature on the density stratification of Lake Malawi. In: Johnson TC, Odada EO, editors. The Limnology, Climatology and Paleoclimatology of the East African Lakes. New York: gordon and Breach;1996. p. 183–202.
29. Grilli R, Darchambeau F, Chappellaz J, Mugisha A, Triest J, Umutoni A. Continuous in situ measure-ment of dissolved methane in Lake Kivu using a membrane inlet laser spectrometer. Geoscientific Instrumentation, Methods and Data Systems. 2020; 9(1),141–151.
30. Schmid M, Wu¨est A. Stratification, mixing and transport processes in Lake Kivu. In: Descy J, Darcham-beau F, Schmid M, editors. Lake Kivu: Limnology and biogeochemistry of a unique tropical lake. Dor-drecht: Springer, Aquatic Ecology Series. 2012. P. 13–29.
31. Ba¨renbold F, Schmid M, Brennwald MS, Kipfer R. Missing atmospheric noble gases in a large tropical lake: The case of Lake Kivu, East-Africa. Chemical Geology 532 (2020): 119374.
32. Ross KA, Smets B, De Batist M, Hilbe M, Schmid M, Anselmetti FS. Lake-level rise in the late Pleisto-cene and active subaquatic volcanism since the HoloPleisto-cene in Lake Kivu, East African Rift. Geomorphol-ogy. 2014; 221: 274–285.
33. Lahmeyer O. Bathymetric survey of Lake Kivu. Final report. Kigali: Republic of Rwanda, Ministry of Public Work, Directory of Energy and Hydrocarbons; 1998.
34. Wu¨est A, Jarc L, Bu¨rgmann H, Pasche N, Schmid M. Methane formation and future extraction in Lake Kivu. In: Descy J, Darchambeau F, Schmid M, editors. Lake Kivu: Limnology and biogeochemistry of a unique tropical lake. Dordrecht: Springer, Aquatic Ecology Series. 2012. P. 13–29.
35. Morana C, Borges AV, Roland FAE, Darchameau F, Descy JP, Bouillon S. Methanotrophy within the water column of a large meromictic tropical lake (Lake Kivu, East Africa). Biogeosciences. 2015; 12(7): 2077–2088.
36. Sa´nchez-España J, Yusta I, Boehrer B. Degassing Pit Lakes: Technical Issues and Lessons Learnt from the HERCO 2 Project in the Guadiana Open Pit (Herrerı´as Mine, SW Spain). Mine Water and the Environment. 2020.https://doi.org/10.1007/s10230-020-00654-1