HAL Id: ird-00664391
https://hal.ird.fr/ird-00664391
Submitted on 30 Jan 2012
HAL is a multi-disciplinary open access
archive for the deposit and dissemination of
sci-entific research documents, whether they are
pub-lished or not. The documents may come from
teaching and research institutions in France or
abroad, or from public or private research centers.
L’archive ouverte pluridisciplinaire HAL, est
destinée au dépôt et à la diffusion de documents
scientifiques de niveau recherche, publiés ou non,
émanant des établissements d’enseignement et de
recherche français ou étrangers, des laboratoires
publics ou privés.
Prevoyante, Mayotte Island
Fanny Houlbreque, B. Delesalle, Jean Blanchot, Yves Montel, Christine
Ferrier-Pagès
To cite this version:
Fanny Houlbreque, B. Delesalle, Jean Blanchot, Yves Montel, Christine Ferrier-Pagès. Picoplankton
removal by the coral reef community of La Prevoyante, Mayotte Island. Aquatic Microbial Ecology,
Inter Research, 2006, 44, pp.59-70. �ird-00664391�
INTRODUCTION
Benthic–pelagic coupling has been well studied in temperate coastal waters (Riisgard et al. 1996, Lucas et al. 1999, Porter et al. 2004, Bologna et al. 2005, Hagy et al. 2005), where it was shown that seston, as well as phyto- and zooplankton abundances are partially con-trolled by benthic organisms, such as bivalves, ascidi-ans and polychaetes. In coral reef waters, studies investigating such coupling have shown that large zooplankton and phytoplankton (Fabricius et al. 1995, 1998, Yahel et al. 1998, Fabricius & Dommisse 2000, Genin & Yahel 2002, Van Duyl et al. 2002) are impor-tant sources of prey for benthic organisms.
Reefs, however, thrive in oligotrophic environments, where small cells such as pico- and nanoplankton largely dominate plankton biomass (Ducklow 1990). In such waters, bacteria can account for 30% of the total particulate carbon, and pigmented pico- and
nano-plankton, for 50 to 100% of the chlorophyll a (chl a) (Ferrier-Pagès & Gattuso 1998). Both groups constitute a large portion of the nutrient pool (Crossland et al. 1984). The importance of pico- and nanoplankton as a nutrient source for coral reef organisms has been high-lighted in flume studies (Ribes et al. 2003, 2005) and for cryptic filter feeders (Richter & Wunsch 1999, Richter et al. 2001). Few studies, however, have investigated, in situ on a reef scale, the grazing of these minute cells (Ayukai 1995, Gast et al. 1998, Yahel et al. 1998).
Reefs host several important pico- and nanoplankton grazers, such as sponges and other cryptic organisms living in reef crevices or cavities (Gast et al. 1998, Richter et al. 2001): bivalves (Klumpp et al. 1992), ascidians (Petersen & Riisgard 1992, Ribes et al. 2005), hydrozoans (Coma et al. 1999) and soft corals (Fabri-cius et al. 1995). It is also now widely recognized that scleractinian corals are able to prey on small particles (DiSalvo 1971, Sorokin 1973, Bak et al. 1998,
Houl-© Inter-Research 2006 · www.int-res.com *Email: fannyh1@stanford.edu
Picoplankton removal by the coral reef community
of La Prévoyante, Mayotte Island
F. Houlbrèque
1, 4,*, B. Delesalle
2, J. Blanchot
3, Y. Montel
3, C. Ferrier-Pagès
11Centre Scientifique de Monaco, Av. Saint Martin, 98000, Monaco
2Laboratoire des Ecosystèmes aquatiques tropicaux et méditerranéens, Ecole Pratique des Hautes Etudes, UMR CNRS 8046,
Université de Perpignan, 52, Av. Paul Alduy, 66860 Perpignan Cedex, France
3Centre IRD de la Réunion Jean Blanchot IRD La Réunion BP 172, 97492 Sainte-Clotilde Cedex La Réunion, France 4Present address: Geological & Environmental Sciences, Stanford University, 450 Serra Mall, Bldg 320, Room 118, Stanford,
California 94305-2115, USA
ABSTRACT: We examined the trophic contribution of pico- and nanoplankton to a patch reef domi-nated by scleractinian corals and located at Mayotte Island (Comoro Archipelago). Pico- and nano-plankton concentrations, as well as total particulate organic matter, were measured on a sandy-bottom and a patch reef transect. Results showed that particles <10 µm accounted for 74% of the chlorophyll a concentration and for 47% of the total living carbon. Synechococcus sp. represented 65% of the chlorophyll < 3 µm and 53 and 67% of the autotrophic carbon and nitrogen, respectively, followed by picoeukaryotes, nanoeukaryotes and Prochlorococcus sp. Concentrations of total chloro-phyll a, as well as picoplankton groups, were depleted 30 to 45% above the reef compared to in the adjacent waters and in sandy-bottom samples. Concentrations of nanoflagellates and total particulate organic matter, by contrast, remained unchanged during their passage across the reef. These results suggest selective grazing of picoplankton by the benthic community and compound the importance of picoplankton for the benthic–pelagic coupling and trophic dynamics on coral reefs.
KEY WORDS: Picoplankton · Nanoplankton · Benthos · Coral reef communities · Particle removal
brèque et al. 2004b) and greatly benefit from zoo-plankton-derived energy (Houlbrèque et al. 2003, 2004a). In this respect, pico- and nanoplankton should play a significant role in reef energetics — they can reach very high growth and production rates and they represent an important fraction of the reef planktonic biomass (Ducklow 1990).
The aim of this study was to examine the in situ con-tribution of pico- and nanoplankton to the carbon and nitrogen removed by a patch reef, to gain a better understanding of the functioning of such ecosystems. In situ measurements avoid some of the artifacts known in flume experiments, such as limitation in size and food replenishment (Genin & Yahel 2002). They are, however, difficult to obtain, except under condi-tions of homogeneous or confined flows, such as those found in lagoons and channels (Genin & Yahel 2002). For this reason, we have chosen the reef of La Prévoy-ante (Mayotte Island) because it is located in one of the largest lagoons of the Indian Ocean. In this lagoon, flow rates are low and homogeneous; the reefs are con-sidered healthy and are colonized by large colonies of Galaxea astreata and Acropora spp. (ORC 2003). Con-centrations of phytoplankton (total and fractionated chlorophyll, Prochlorococcus sp., Synechococcus sp., picoeukaryotes) and heterotrophic microorganisms (bacteria, nanoflagellates, ciliates), as well as total and fractionated particulate organic matter, were measured on 2 transects located above a sand floor or above the reef.
MATERIALS AND METHODS
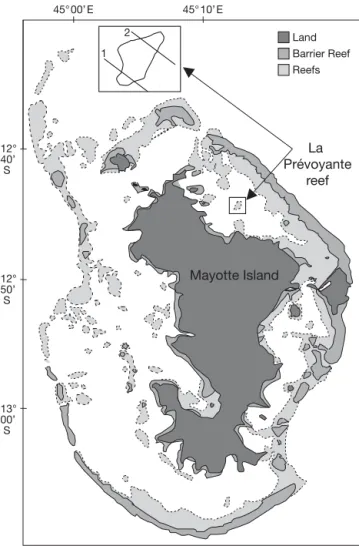
Study site.The study was carried out in May in the lagoon of the French Comorian island of Mayotte (12° 41’ S, 45° 10’ E). Mayotte is a volcanic island located in the Mozambique Channel. It is under the influence of a tropical marine climate, with 2 main seasons (the dry and the rainy season, from October to May) and a very high level of irradiance (> 3000 h every year). It is protected from heavy winds by Mada-gascar Island. Its lagoon is one of the largest (15 km wide) in the Indian Ocean and is fairly deep (average: 30 to 40 m). It is surrounded by a continuous large bar-rier reef (Fig. 1), which can be > 2 km wide in some areas and is interrupted by only a few deep channels. Lagoon reefs, either isolated (patch reefs) or forming an inner secondary barrier reef system (Guilcher 1971), also surround the island. The reef called La Prévoyante, where the experiments were performed, belongs to the inner reef system, in the north east of the island. Surface seawater temperature during the study was from 28 to 29°C, and winds were very weak (<10 km h–1or 6 knots).
Experimental set up. Transects: The reef of La
Pré-voyante is 400 m long and 200 to 300 m wide (Fig. 1). The water depth varies from > 20 m just outside the reef to 3–7 m inside the reef, depending on the tide. During our experiments, the maximal tidal amplitude was 1.7 m, because measurements were performed during a period of neap tide. Measurements on 2 cross transects (of ca. 1050 m long) were performed on the reef according to Yahel et al. (1998). Sampling points on transects were established using the global posi-tioning system (GPS). A control transect (called ‘sandy-bottom transect’) was located at the southern end of the reef, on a sandy bottom, and is represented by Points S1 to S5 (Fig. 2a). Points S2 to S4 were located above the sandy bottom, whereas Points S1 and S5 were above the lagoon. The other transect (called ‘reef transect’) was made above the patch reef (bottom cov-ered with benthos) and is represented by Points A to G in Fig. 2b. Points A and G were located above the
Mayotte Island 2 1 12° 40’ S 12° 50’ S 13° 00’ S La Prévoyante reef Land Barrier Reef Reefs 45° 00’ E 45° 10’ E
Fig. 1. Mayotte Island and localization of the reef of La Prévoyante. The 2 reef transects measured during this experi-ment are represented in the inset (1: sandy-bottom transect;
lagoon (and could serve as a second control), whereas Points C, D and E were above the patch reef. The per-cent cover and abundances of reef communities were assessed using 5 × 40 m line intercept transects on the reef (ORC 2003, authors’ pers. data). Point B was on the reef slope, covered with abundant colonies of sclerac-tinian and soft corals (38%), as well as by sponges (8%) and some bivalves (1%, spondyles, Pteridae, Lithophaga sp.) (Table 1a). From Points C to E (30 m wide, 100 m long), the benthos was dominated by scle-ractinian corals (Table 1b), which covered up to 69% of the total surface area. The 2 main species, Galaxea sp. and Acropora sp., were represented by huge colonies reaching 5 m in diameter. Soft corals represented ca. 4% of the abundance, and sponges were much less numerous than on the reef slope (2%). In general, all filter feeders were more abundant on the slope than on the reef flat (ORC 2003). Point F was located above iso-lated coral heads at ca. 8 m depth.
Zooplankton was collected in a 5 min haul, using a WP2 net, during the 5 sampling periods. Sampling was conducted at 2 points of the ‘reef transect’ (Points A and F), where the water depth was sufficient to allow a safe collection. Samples were preserved with form-aldehyde. The nature and abundance of planktonic prey were determined using a dissecting scope and a Dolfuss tank, according to Gasser et al. (1998). Sea-water samples for the other measurements were taken at all sampling stations (from Points A to F) and at the same depth of 1.5 m using 5 l Niskin bottles. They were combined in acid-washed batch bottles and stored in
the shade and cool until our return to the laboratory, when they were then treated as described below. Each transect took 30 min and was repeated 5 times over a 2 wk period.
Current measurements: During our experiments, a
cross-shaped, sub-surface drogue was released at different transect points. Since samplings were per-formed during the same tidal hours, the main direction was from Points A to G (or from Points S1 to S5). We therefore considered that the water mass crossed the reef, even though current shear and bottom turbulence cannot be ruled out (Shashar et al. 1996, S. G. Moni-smith et al. unpubl. data). Since the reef of La Prévoy-ante is located in the lagoon, turbulence was low com-pared to a barrier reef. Current measurements were made 30 min before sampling; current speed was cal-culated at each point by measuring the exact distance covered by the drogue in 10 min, using a metric rope. Surface current was found to be very low (mean value: 1.5 cm s–1), because measurements were made during neap tides. Low flows are also a common feature of this part of the reef (ORC 2003), because its position in the lagoon is sheltered from high winds. Due to the low
b
a
0 1200 1000 S5 G F E D C B A S4 S3 S2 S1 800 Depth (m)Length of the transect (m)
600 400 200 0 1200 1000 800 600 400 200 4 8 12 16 20 24 28 4 8 12 16 20 24 28 Fig. 2. Position of the sampling stations in (a) the ‘sand-bottom transect’ (Points S1 to S5) and (b) the ‘reef transect’ (Points
A to G)
Table 1. Percent cover of scleractinian, soft corals and sponges on the reef transect: (a) at Point B (depth: 6 m) (data are means [± SD] of 3 transects; ORC 2003) and (b) from Points C to E
(data are means [± SD] of 5 transects)
Group Taxon Mean (%)
(a) Point B
Scleractinian corals Total 33.50 ± 4.760
Galaxea astreata 3.83 ± 1.04 Acropora divaricata Acropora granulosa Acropora sp. 10.33 ± 5.260 Diploastrea heliopora 5.75 ± 6.01 Seriatopora hystrix 1.83 ± 1.44 Other species 13.66 ± 7.070
Soft corals Total 5 ± 5.63
Sinularia spp. Rhytisma sp. Sarcophyton spp. Sponges Total 8.08 ± 3.55 Dictyospheria sp. Rhizochalina spp. (b) Points C to E
Scleractinian corals Total 68.9
Galaxea astreata 38.28 ± 4.910 Acropora formosa Acropora hyacintus Acropora cervicornis 15.61 ± 3.800 Echinopora sp. 5.96 ± 3.62 Lobophyllia sp. 3.11 ± 1.92 Goniopora sp. 3.11 ± 1.31 Pocillopora damicornis 1.41 ± 0.70 Fungia sp. 1.41 ± 0.43
Alcyioniid soft corals Sinularia sp. 4.10 ± 2.41
Sarcophyton sp. 0.27 ± 0.11
current velocities, seawater samples, taken at 2.5 min intervals along the transects, can be considered as independent from each other.
Sample processing. In the laboratory, seawater sam-ples, taken at each sampling point on the transects, were divided into several triplicate sub-samples. For the ‘reef transect’, abundances of pico- and nano-plankton, as well as chl a and particulate organic car-bon (POC) concentrations were measured, in order to monitor all changes due to the benthic reef community. Measurements on the ‘sandy-bottom transect’ were performed to control that no grazing happened on an organism-free bottom and to confirm that the decrease in organisms observed on the reef transect was indeed due to grazing. Therefore, only the abundances of pico- and nanoplankton groups were measured.
Triplicate 500 ml samples of well-stirred water from each sampling point of the ‘reef transect’ were pre-filtered on 10 µm polycarbonate filters using a reverse size filtration unit to avoid cell breakage. Fractions <10 µm were then filtered onto pre-combusted (450°C for 5 h), 25 mm Whatman GF/F filters under low vac-uum. Filters were folded and stored in pre-combusted aluminum-foil envelopes, and frozen until further analysis. The same procedure was performed with 3 unfiltered samples. POC was then analyzed on a CHN analyzer (LECO 900), with EDTA as standard. Values obtained from blanks (pre-combusted filters) were subtracted from sample values.
Triplicate 500 ml samples of the same well-stirred water were gently size-filtered onto Nuclepore filters of 10 and 0.45 µm. Chl a was immediately measured after extraction in methanol according to Welschmeyer (1994), using a Turner Design TD 700 fluorometer. The fluorometer was calibrated using pure chl a (Sigma). Triplicate 10 ml samples were fixed with 0.22 µm pre-filtered formaldehyde (0.4% final concentration), stained with DAPI and filtered on 0.22 µm black
Nuclepore filters. They were then frozen at –20°C until further determination of pigmented and non-pigmented nanoflagellate abundances using an epifluorescence microscope (Leica). Concentrations of picoplankton groups were determined by flow cytometry according to Blanchot & Rodier (1996) and Marie et al. (1996). For this purpose, triplicate 2 ml samples were preserved with 0.05% glutaraldehyde, kept cold and in the dark for 30 min and then frozen in liquid nitrogen. Samples were then counted with a Becton-Dickinson FACScan flow cytometer. The excitation source was a blue laser beam (15 mV, 488 nm). The red fluorescence of the chlorophyll was analyzed with a wave-length > 650 nm. In order to calibrate the optical measure-ments, known quantities of fluorescent beads were added to each sample. Parameters collected were analyzed with custom-designed software. Picoplank-ton groups were the following: heterotrophic bacteria and picoeukaryotes, as well as Prochlorococcus sp. and Synechococcus sp., which constituted the major part of the cyanobacterial biomass present in the waters dur-ing the experiments. A dominance of Prochlorococcus sp. and Synechococcus sp. among cyanobacteria is a major feature in oceanic waters (Partensky et al. 1999). Finally, triplicate 250 ml seawater samples from Points A and D were fixed with formaldehyde (0.4%) and Lugol and kept in the dark for determination of cil-iate abundances. For this purpose, samples were first concentrated to 100 ml, and then placed in settling chambers (Utermöhl chambers). Ciliates were counted with an inverted microscope (Leica) under ×100 mag-nification.
Treatments. Carbon and nitrogen content of prey items were estimated using literature conversion fac-tors (Table 2). Gundersen et al. (2002) and Heldal et al. (2003) both give the carbon and nitrogen content for picoplankton. We considered a volume of 0.368 and 0.125 µm– 3for Synechococcus sp. and Prochlorococcus
Table 2. Carbon and nitrogen contents of the prey items according to literature conversion factors
Group Carbon and nitrogen contents Source
Heterotrophic bacteria 14 fg C cell–1 Gundersen et al. (2002)
3.8 fg N cell–1 Gundersen et al. (2002)
Prochlorococcus sp. 22.3 fg C cell–1 C(fg) = 178.5(fg µm– 3) × Volume(µm3) Heldal et al. (2003)
2.4 fg N cell–1 N(fg) = 19.5 (fg µm– 3) × Volume(µm3) Heldal et al. (2003)
Synechococcus sp. 78.9 fg C cell–1 C(fg) = 214.0(fg µm– 3) × Volume(µm3) Heldal et al. (2003)
7.9 fg N cell–1 N(fg) = 21.5(fg µm– 3) × Volume(µm3) Heldal et al. (2003) Picoeukaryotes 836 fg C cell–1 C(pg) = 0.43(pg µm– 3) × Volume(µm3)0.863 Verity et al. (1992)
39.2 fg N cell–1 N(fg) = 26.1(fg µm– 3) × Volume(µm3) Caron et al. (1995) Nanoflagellates 7628 fg C cell–1. C(pg) = 0.43(pg µm– 3) × Volume(µm3)0.863 Verity et al. (1992) 731 fg N cell–1 N(fg) = 26.1 × Volume(µm3) Caron et al. (1995) Ciliates 2318 pg C cell–1 C(pg) = 0.19 × Volume(µm3) Putt & Stoecker (1989)
373 pg N cell–1 Jensen & Winding Hansen (2000)
sp., respectively, measured by flow cytometry (Charpy & Blanchot 1998). Cell sizes for nanoflagellates were measured under a calibrated micrometer, and cell bio-volumes were estimated assuming the nearest geomet-rical shape. Volumes were equal to 28 and 1.50 µm– 3 for nanoflagellates and picoeukaryotes, respectively. Most of the ciliates were aloricated, belonging to the genus Strombidium spp. The carbon content was cal-culated taking a mean biovolume of 12 200 µm3 and according to the relationship of Putt & Stoecker (1989). Since the nitrogen content of ciliates has never been carefully investigated, we considered a C:N ratio of 5 (Jensen & Winding Hansen 2000).
The C to chl a conversion factor ranges from 24 to 175 in plankton communities of tropical waters. In order to allow comparison with published results (Ayukai 1995, Yahel et al. 1998), a C:chl a ratio of 30 was chosen. To estimate the contribution of pico-plankton groups to chlorophyll, Li’s (1995) method was used according to Charpy & Blanchot (1998). This method is based on the fact that fluorescence is a proxy for chl a; therefore, picophytoplankton biomass as chl a can be estimated from in vivo red fluorescence, measured for the 3 main groups of picoplankton cells (Shimada et al. 1993).
Since there was high variability, from one day to another, in the concentrations of the different parame-ters, we calculated relative values for each transect, each sampling point and each parameter (chl a, POC, PON [particulate organic nitrogen], pico- and nano-plankton), which corresponded to the percent change in concentration compared to the concentration mea-sured in open lagoon waters (at Point A for the reef transect and at Point S1 for the sandy-bottom transect). For each parameter, a mean transect was therefore
obtained by calculating the mean of the 5 relative values. Measurements were compared using 1-way ANOVA and StatView for Machintosh, after having tested the normality and homogeneity of variances.
RESULTS
Mean abundances of the different groups of pico-and nanoplankton in the waters of La Prévoyante are summarized in Table 3. Concentrations of heterotro-phic bacteria (447 ± 93 × 103 cells ml–1) were 5 to 15 times higher than the autotrophic picoplankton con-centrations, i.e. Synechoccocus sp. (76 ± 19 × 103cells ml–1) and Prochlorococcus sp. (25 ± 7 × 10³cells ml–1). Picoeukaryotes and nanoflagellates were 1 order of magnitude lower than the other phytoplankton cells (6 ± 2 × 10³ and 5 ± 1 × 10³cells ml–1, respectively). Finally, ciliates were not abundant in these waters. In terms of carbon and nitrogen, and according to the conversion factors used, total nanoflagellates showed the highest biomass (38.14 ± 1.95 µg C l–1), followed by heterotrophic bacteria (6.26 ± 1.85 µg C l–1) and
Syne-choccocus sp. (6.00 ± 1.50 µg C l–1). Nanoflagellates were mostly represented by non-pigmented cells (80 ± 5% of total flagellates). Cells <10 µm represented most of the chl a (71.6%; Table 3). Cells < 3 µm represented between 71 and 82% of the chlorophyll <10 µm and between 56 and 76% of the total chl a, depending on the sampling points. Using Li’s (1995) method, we estimated that Prochlorococcus sp., Synechococcus sp. and picoeukaryote contributions to picoplankton chl a were 4 ± 1, 65 ± 3 and 31 ± 3%, respectively. Synechococcus sp. contributed ca. 30 to 35% of the total chla.
Table 3. Natural abundances (mean ± SD) of the components of the microbial community in the waters of La Prévoyante (Point A)
Group Chlorophyll Cell conc. Biomass
(µg chl a l–1) (×103cells ml–1) (µg C l–1) (µg N l–1) Heterotrophic bacteria 447 ± 930 6.26 ± 1.85 1.44 ± 0.35 Synechococcus sp. 76 ± 19 6.00 ± 1.50 0.60 ± 0.15 Prochlorococcus sp. 25 ± 70 0.56 ± 0.15 0.06 ± 0.02 Picoeukaryotes 6 ± 2 4.87 ± 1.39 0.23 ± 0.06 Total nanoflagellates 5 ± 1 38.14 ± 1.950 3.66 ± 0.17 Ciliates 0.33 ± 0.01 0.76 ± 0.01 0.12 ± 0.01 Chlorophyll a Total 0.42 ± 0.14 14.66 ± 4.320 <10 µm 0.31 ± 0.14 10.44 ± 4.070 POC Total 206.25 ± 66.580 <10 µm 207.80 ± 47.590 PON Total 21.83 ± 3.860 <10 µm 22.08 ± 3.120
Concentrations of zooplankton measured in the waters of Mayotte Island at the time of sampling were low. Heterotrophic dinoflagellates, copepods and crus-tacean larvae were the most abundant groups, with concentrations ranging from 0.2 to 0.6 prey l–1. Appen-dicularians and eggs were also found, but at lower concentrations (0.14 and 0.05 prey l–1, respectively). No significant difference in zooplankton concentra-tions was found between the lagoon and the reef slope waters (t-test, p > 0.5).
The amounts of measured POC and PON <10 µm (Table 3) varied considerably from one sampling to an-other, from 150 to 230 µg POC l–1and from 20 to 53 µg PON l–1. They were, however, significantly higher than the calculated amount of living POC (56.59 µg C l–1) or PON (6.11 µg C l–1), suggesting that either the conver-sion factors used caused underestimates or there was an important fraction of detritic organic matter.
The mean values for the transects, obtained for the different parameters, are summarized in Figs. 3 to 6. In the sandy-bottom transect, there was no signifi-cant change in the planktonic concentrations be-tween points located in the lagoon and above the sandy bottom (ANOVA, p > 0.05; Fig. 3). There was also no significant difference (ANOVA, p > 0.05) between the sandy bottom (Points S1 to S5) and Point A concentrations. Conversely, a significant gra-dient of decreasing cell concentrations from the lagoon waters (Point A) to the reef (Points C, D, E) was observed for reef transects (Table 4). Concentra-tions of heterotrophic bacteria, Synechococcus sp., Prochlorococcus sp., picoeukaryotes (Fig. 4) and chl a <10 µm (Fig. 5) significantly decreased above the reef compared to the surrounding water (Table 4). Minimal concentrations were observed in the middle of the reef, at Points C and D. Table 5 gives the dif-ferences in cell concentrations and in percentages between the lagoon waters (Point A) and the center of the reef (Point D). Concentrations changed from 23 ± 7 to 12 ± 3 × 10³cells ml–1 for Prochlorococcus sp., from 65 ± 12 to 32 ± 6 × 10³cells ml–1 for
Syne-chococcus sp., from 5 ± 1 to 2.5 ± 1 × 10³ cells ml–1 for picoeukaryotes and from 447 ± 82 to 309 ± 57 ×
Prochlorococcus sp. Synechococcus sp. Picoeukaryotes Heterotrophic bacteria Point S1 concentrations (%) S1 S2 S3 S4 S5 14 12 10 8 6 4 14 12 10 8 6 4 14 12 10 8 6 4 14 12 10 8 6 4 Points
Fig. 3. Cell concentrations (% of S1 value) of Prochlorococcus sp., Synechococcus sp., picoeukaryotes and heterotrophic bacteria along the sandy-bottom transect. Values are means
(± SD) of 5 transects (n = 15)
Table 4. Results of the ANOVA and post hoc-test (Bonferroni/ Dunn test) comparing the concentrations obtained throughout the transect. For the ANOVA: *0.005 < p < 0.05, **0.0005 < p < 0.005, ***p < 0.0001, NS: non-significant. For the post-hoc test, sampling points are considered as different when p < 0.0024. ≠: sampling points are significantly different, e.g. A = G ≠ C = D = E means that there is no significant difference between A and G or between C, D and E, but that A and G are
significantly different from C, D and E
Group ANOVA Post-hoc tests
F p Chl a (total) 14.8 *** A = G ≠ C = D =E Chl a (<10 µm) 14.1 *** A = B = G ≠ C = D = E = F Chl a (>10 µm) 12.9 ** A ≠ C = D = E Heterotrophic bacteria 5.46 ** A = B = G ≠ C = D = E = F Synechococcus sp. 18.3 *** A = B = G ≠ C = D = E = F Prochlorococcus sp. 21.3 *** A = B = G ≠ C = D = E = F Picoeukaryotes 18.1 *** A = B = G ≠ C = D = E = F Total nanoflagellates 1.94 NS POC (total) 2.40 NS POC (<10 µm) 2.48 NS
Point A concentration (%) Points Points 110 100 90 80 70 60 50 40 110 100 90 80 70 60 50 40 110 100 90 80 70 60 50 40 110 100 90 80 70 60 50 40 110 100 90 80 70 60 50 40 A B C D E F G A B C D E F G Prochlorococcus sp. Synechococcus sp. Picoeukaryotes Nanoflagellates Heterotrophic bacteria
Fig. 4. Cell concentrations (% of Point A concentra-tion) of Synechococcus sp., Prochlorococcus sp., picoeukaryotes, heterotrophic bacteria and total nanoflagellates along the reef transect. Values are
means (± SD) of 5 transects (n = 15)
Table 5. Differences in amount of chlorophyll, cell concentration and biomass between the lagoon waters (Point A) and the center of the reef (Point D). Negative values represent a decrease between Points A and D (reef consumption). Percent changes
between the 2 sampling points (values in parentheses) were also calculated
Chlorophyll Cell conc. Biomass
(µg chl a l–1) (103cells ml–1) (µg C l–1) (µg N l–1) Heterotrophic bacteria –157.22 ± 54.84 –3.24 ± 1.38 –0.61 ± 0.26 (–41%) (–41%) Synechoccocus sp. –33.44 ± 5.45 –2.64 ± 0.43 –0.26 ± 0.04 (–44%) (–44%) Prochloroccocus sp –11.25 ± 3.37 –0.25 ± 0.08 –0.12 ± 0.02 (–45%) (–45%) Picoeukaryotes –2.28 ± 0.82 –1.87 ± 0.69 –0.09 ± 0.03 (–38%) (–38%)
Total nanoflagellates No change No change No change
Chlorophyll a Total –0.15 ± 0.04 –0.11 ± 0.01 (–35%) (–35%) Fraction <10 µm –0.04 ± 0.01 –4.29 ± 1.38 (–30%) (–30%) Fraction >10 µm –3.15 ± 1.05 –1.05 ± 0.03 (–35%) (–30%)
POC No change No change
103 cells ml–1 for heterotrophic bacteria. Mean con-centrations of ciliates measured along the 5 transects also significantly decreased above the reef, from 331 ± 7 cells l–1 at Point A to 100 ± 25 cells l–1 at Point D (t-test, p = 0.001). In terms of carbon and nitrogen, picoeukaryotes, Synechococcus sp., bac-teria, Prochlorococcus sp. and ciliates decreased by 38 to 45% above the reef, while POC and PON did not significantly change (Fig. 6). These POC and PON concentrations give a C:N ratio of the organic matter in Mayotte Lagoon equal to 9.8. No gradient was observed for nanoflagellate concentrations either (Fig. 4, Table 5).
DISCUSSION
This study showed that the benthic community of the reef of La Prévoyante efficiently removed picoplankton cells: water passing across the reef was highly depleted in micro-organisms, in contrast to sandy-bottom areas, where we found no significant change in plankton concentrations. Benthic grazing is the most reliable explanation for the micro-organism depletions observed above the reef. Indeed, these depletions cannot be due to differences in growth rates between sampling stations, because the genera-tion time of the studied taxa, estimated at 2 d in reef
Point A concentration (%) Total chlorophyll a 110 100 90 80 70 60 50 40 110 100 90 80 70 60 50 40 110 100 90 80 70 60 50 40 Chlorophyll >10 µm Chlorophyll <10 µm Points B A C D E F G Point A concentration (%) 100 80 60 40 20 0 100 80 60 40 20 0 100 80 60 40 20 0 100 80 60 40 20 0 POC <10 µm Total POC PON <10 µm Total PON Points B A C D E F G B A C D E F G
Fig. 5. Chlorophyll a concentrations (% of Point A concentra-tion) along the reef transect. Values are means (± SD) of 5
transects (n = 15)
Fig. 6. Average POC and PON concentrations (% of Point A concentration) along the reef transect. Values are means
waters (Linley & Koop 1986, Furnas et al. 1990, Torre-ton & Dufour 1996), is higher than the time needed by the water mass to cross the reef (estimated at 4 h). In addition, plankton depletion was observed in mea-surements at each transect, performed in intervals of several days, suggesting that physical parameters (water advection or turbulence) were not very impor-tant on this reef. Grazing of micro-organisms by dem-ersal zooplankton and pelagic nanoflagellates or cili-ates is unlikely, because this would have also happened in the control transect, and large zooplank-ton concentrations are scarce during the day (Yahel et al. 2005). By considering a mean value of 20 µg C organism–1(Hays et al. 2001), zooplankton could have only contributed 3 to 10% of the planktonic biomass (or 4 to 12 µg C l–1). Finally, the last cause of plankton depletion above the reef might have been particles sticking to coral mucus (Coffroth 1990, Wild et al. 2004). This hypothesis is unlikely, however, as unse-lective scavenging on sticky mucus would not explain the observed selectivity between nano- and picoplankton on the reef of La Prévoyante. In addi-tion, adhesion to mucus was not the major mechanism of cell removal during the flume experiments con-ducted by Ribes et al. (2003).
In terms of carbon, large phytoplankton cells (>10 µm), including dinoflagellates (e.g. Oxytoxum spp., Prorocentrum spp.), pennate diatoms (e.g. Nitz-schia closterium, Thalassiothrix frauenfeldii ) and cocco-lithophores (e.g. Gephyrocapsa oceanica) (data not shown), only represented 20% of the total autotrophic carbon grazed by the benthos. Bivalves (e.g. Spondyli-dae, Pteridae and Lithophaga spp.) could have been grazers, since they were found to be abundant on the reef slope (ORC 2003).
The major part of the autotrophic carbon grazed by the reef community was represented by phytoplankton <10 µm (Synechococcus sp., Prochlorococcus sp. and picoeukaryotes), which was depleted by 30 to 45% above the reef, compared to in the adjacent lagoon or in sandy-bottom waters. As already observed in differ-ent tropical waters (Lindell & Post 1995, Li et al. 1998, Yahel et al. 1998), these small cells, together with heterotrophic bacteria, were the main component of the plankton community of the lagoon of Mayotte Island, accounting for most of the chl a, as well as for half of the total living carbon. There was no apparent selectivity in the removal of the different planktonic components, since all groups were depleted by the same amount (ca. 40%). Synechococcus sp. repre-sented the largest fraction of the chl a and autotrophic carbon grazed by the reef community. They accounted for 65% of the chlorophyll < 3 µm (35% of the total chlorophyll) and contributed 50% of the autotrophic carbon and nitrogen. Cyanobacteria are often
described as the major primary producers of coral reef waters (Charpy & Blanchot 1998, Furnas & Crosbie 1999) and were shown to dominate plankton in atoll lagoons (Charpy & Blanchot 1998), as well as at inshore sites of the Great Barrier Reef (Furnas & Crosbie 1999). Relatively high levels of nutrients (mean values: 0.86 µmol N l–1and 0.43 µmol P l–1; Vacelet et al. 1999) could explain their dominance on Mayotte Island. Grazing of cyanobacteria was observed in other reef systems (Ayukai 1995, Yahel et al. 1998, Van Duyl et al. 2002), but was not directly compared to the grazing of the other pico- and nanoplankton groups. Pico-eukary-otes and Prochlorococcus sp. represented the remain-ing 35% of the chlorophyll < 3 µm grazed by the reef community. Their abundances were lower than those in the other groups during that period of the year. However, Prochlorococcus sp. can sometimes be a dominant phytoplankton group, as observed in the Gulf of Aqaba (Lindell & Post 1995), or at French Poly-nesian atolls (Charpy & Blanchot 1998).
Among the heterotroph microorganisms, bacteria (41% depletion) were a highly nutritive group, since they represented one of the biomasses with highest carbon and nitrogen values, as already observed in tropical waters (Ducklow 1990). Their carbon content (3.24 µg C l–1; Table 5) was comparable to the whole pool of autotrophic carbon (4.29 µg C l–1for total chl a; Table 5). Bacterial depletion was occasionally ob-served on Pacific (Linley & Koop 1986, Ayukai 1995, Torreton & Dufour 1996) and Caribbean reefs (Gast et al. 1998). The second heterotrophic group, repre-sented by nanoflagellates, displayed relatively high concentrations on Mayotte Island; such concentrations can occasionally be found in reef waters (e.g. Ayukai 1995, Ferrier-Pagès & Gattuso 1998). Despite their high biomass, they did not show significant depletion above the reef.
Many potential grazers of this picoplankton were present on the reef; it is, however, difficult to assess the importance of the different benthic organisms to grazing without laboratory-controlled experiments. The lack of depletion of nanoplankton cells on this reef, however, suggests selectivity in the grazing pro-cess. It also supports the idea that the main contri-butors to the observed plankton depletion were active suspension feeders, such as sponges, rather than pas-sive suspension feeders, such as corals. Indeed, while the first group preferentially ingests picoplankton (Jørgensen 1996, Richter et al. 2001, Ribes et al. 2005), corals have a preferential uptake of nanoplankton (Houlbrèque et al. 2004b). The major grazing of small particles was observed on the slope, between Points B and C, where sponges, tunicates and bivalves were abundant. Soft corals were also abundant, and might have contributed to plankton depletion, since they
were shown to be voracious phytoplankton grazers at some locations (Yahel et al. 1998, Fabricius & Domisse 2000). Picoplankton concentrations remained low between Points D and E, suggesting that grazing still occurred; the benthos was represented here by very large colonies of Galaxea astreata and Acropora spp., and corals (both scleractinian and soft) represented 73% of the benthic cover. The density of active suspen-sion feeders was, however, difficult to assess at this point on the reef, because of the dense coral cover, and large colonies, which did not allow access to other ben-thic species, settled below these corals (Wunsch & Richter 1998).
Since the reef usually releases a large amount of detritus, measurements of total POC and PON cannot be good indicators of pelagic–benthic fluxes. Indeed, concentrations of POC and PON were not significantly different along the transects. These results agree with most of the previous observations (Charpy & Charpy-Roubaud 1991, Hata et al. 1998) of POC increase above the reef due to detritus release, suggesting an impor-tant export of organic particles from the reef to the sur-rounding ocean. The C:N ratio of the organic matter in the lagoon of Mayotte Island (ca. 9.8) was within the range of C:N ratios reported for particles in coral reef regions (between 7.6 and 20; Charpy & Charpy-Roubaud 1991, Hansen et al. 1992). The organic matter seems to have a coral origin (mucus), because it has been shown that the C:N ratio of mucus ranges between 6.9 and 13.7 (Coffroth 1990), whereas C:N ratio of phytoplankton is slightly lower, from 6 to 8 (Parsons et al. 1961).
Picoplankton grazing may constitute an important influx of particulate organic matter into coral reef ecosystems, as highlighted in previous estimations of carbon transfer: 0.35 to 0.4 g C m–2 d–1 for phyto-plankton carbon in soft coral reefs (Fabricius & Domisse 2000) and 0.7 to 1.1 g C m–2 d–1 for phyto-plankton carbon in other reef systems (Fabricius et al. 1998, Yahel et al. 1998, Ribes et al. 2005). The large depletion observed in the present study is certainly due to the fact that the water mass remained in con-tact with the benthos for a long time, due to the low flow which occurred during this period of the year. This depletion should be smaller if flow rates are higher. The ability of coral reefs to retain plankton from incoming waters is suggested to be one of the major mechanisms sustaining these reefs in nutrient-impoverished environments. This study strengthens the previous in situ observations that a strong deple-tion of picoplankton occurs above coral reefs. The total amount of carbon and nitrogen brought to the benthos by these minute cells has to be taken into account in future studies on carbon and nitrogen fluxes in coral reef communities.
Acknowledgements. This work was funded by the Centre Sci-entifique de Monaco, as well as by the Institut de Recherche pour le Développement (UR099). We especially thank Prof. B. Thomassin (UMR 6540 CNRS) for promoting our research at Mayotte Island. We also warmly thank our attentive hosts, who shared their laboratories with our team, le Service des Pêches de Mayotte (Dr. O. Abellard) and La Station d’épura-tion de Mamoudzou (Dr. P. Chaperon). We sincerely appreci-ate the substantial help and kindness of F. Seguin, who drove us to the study site every day and prepared all the necessary experimental material. Thanks also to Dr. J.-P. Gattuso (Observatoire Océanologique de Villefranche), Dr. G. Yahel (Univ. of Victoria) and Dr. L. Bigot (Univ. of Réunion) for fruitful discussions and comments.
LITERATURE CITED
Ayukai T (1995) Retention of phytoplankton and planktonic microbes on coral reefs within the Great Barrier Reef, Australia. Coral Reefs 14:141–147
Bak RPM, Joenje M, deJong I, Lambrechts DYM, Newland G (1998) Bacterial suspension feeding by coral reef benthic organisms. Mar Ecol Prog Ser 10:257–263
Blanchot J, Rodier M (1996) Picophytoplankton abundance and biomass in the western tropical Pacific Ocean during the 1992 El Niño year: results from flow cytometry. Deep-Sea Res 6:877–895
Bologna PAX, Fetzer ML, McDonnell S, Moody EM (2005) Assessing the potential benthic–pelagic coupling in epi-sodic blue mussel (Mytilus edulis) settlement events within eelgrass (Zostera marina) communities. J Exp Mar Biol Ecol 316(2):117–131
Caron DA, Dam HG, Kremer P, Lessard EJ and 6 others (1995) The contribution of microorganisms to particulate carbon and nitrogen in surface waters of the Sargasso Sea near Bermuda. Deep-Sea Res 42:943–972
Charpy L, Blanchot J (1998) Photosynthetic picoplankton in French Polynesian Atoll lagoons: estimation of taxa con-tribution to biomass and production by flow cytometry. Mar Ecol Prog Ser 152:67–70
Charpy L, Charpy-Roubaud CJ (1991) Particulate organic matter fluxes in the Tuamotu atoll lagoon (French Poly-nesia). Mar Ecol Prog Ser 71:53–63
Coffroth MA (1990) Mucus sheet formation on poritid corals: an evaluation of coral mucus as a nutrient source on reefs. Mar Biol 105:39–49
Coma R, Ribes M, Orejas C, Gili JM (1999) Prey capture by a benthic coral reef hydrozoan. Coral Reefs 18:141–145 Crossland CJ, Hatcher BG, Atkinson MJ, Smith SV (1984)
Dissolved nutrients of a high-latitude coral reef, Houtman Abrolhos Islands, Western Australia. Mar Ecol Prog Ser 14:159–163
DiSalvo LH (1998) Regenerative functions and microbial ecology of coral reefs: labelled bacteria in a coral reef microcosm. J Exp Mar Biol Ecol 7:123–136
Ducklow HW (1990) The biomass, production and fate of bac-teria in coral reefs. In: Dubinsky Z (ed) Coral reefs, ecosys-tems of the world, Vol 25. Elsevier, Amsterdam, p 265–289 Fabricius KE, Dommisse M (2000) Depletion of suspended par-ticulate matter over coastal reef communities dominated by zooxanthellate soft corals. Mar Ecol Prog Ser 196:157–167 Fabricius KE, Benayahu Y, Genin A (1995) Herbivory in
asymbiotic soft corals. Science 268:90–92
Fabricius KE, Yahel G, Genin A (1998) In situ depletion of phytoplankton by an azooxanthellate soft coral. Limnol Oceanogr 43:354–356
Ferrier-Pagès C, Gattuso JP (1998) Biomass, production and grazing rates of pico- and nanoplankton in coral reef waters (Miyako Island, Japan). Microb Ecol 35:46–57 Furnas MJ, Crosbie ND (1999) In situ growth of the
photo-synthetic prokaryotic picoplankters Synechococcus and Prochlorococcus. Bull Inst Oceanogr Monaco 19:387–417 Furnas MJ, Mitchell AW, Gilmartin M, Revelante N (1990) Phytoplankton biomass and primary production in semi-enclosed reef lagoons of the Central Barrier Reef, Aus-tralia. Coral Reefs 9:1–10
Gasser B, Payet G, Sardou J, Nival P (1998) Community struc-ture of mesopelagic copepods (> 500 µm) in the Ligurian Sea (Western Mediterranean). J Mar Syst 15:511–522 Gast GJ, Wiegman S, Wieringa E, van Duyl FC, Bak RPM
(1998) Bacteria in coral reef water types: removal of cells, stimulation of growth and mineralization. Mar Ecol Prog Ser 167:37–45
Genin A, Yahel G (2002) Intense benthic grazing on phyto-plankton in coral reef revealed using the control volume approach. Oceanography 15:90–96
Guilcher A (1971) Mayotte barrier reef and lagoon, Comoro Islands as compared with other barrier reefs, atolls and lagoons in the world. Symp Zool Soc Lond 28:65–86 Gundersen K, Heldal M, Norland S, Purdie DA, Knap AH
(2002) Elemental C, N and P cell content of individual bac-teria collected at the Bermuda Atlantic Time-series Study (BATS) site. Limnol Oceanogr 47:1525–1530
Hagy JD, Boynton WR, Jasinki DA (2005) Modelling phyto-plankton deposition to Chesapeake Bay sediments during winter–spring: interannual variability in relation to river flow. Estuar Coast Shelf Sci 62(1–2):25–40
Hansen JA, Klumpp DW, Alongi DM, Dayton PK, Riddle MJ (1992) Detrital pathways in a coral reef lagoon. II. Detritus deposition, benthic microbial biomass and production. Mar Biol 113:363–372
Hata H, Suzuki A, Maruyama T, Kurano N, Miyachi S, Ikeda Y, Kayanne H (1998) Carbon flux by suspended and sink-ing particles around the barrier reef of Palau, western Pacific. Limnol Oceanogr 43:1883–1893
Hays GC, Harris RP, Head RN (2001) Diel changes in the near-surface biomass of zooplankton and the carbon content of vertical migrants. Deep-Sea Res II 48(4–5): 1063–1068
Heldal M, Scanlan DJ, Norland S, Thingstad F, Mann NH (2003) Elemental composition of single cells of various strains of marine Prochlorococcus and Synechococcus using X-ray microanalysis. Limnol Oceanogr 48:1732–1743 Houlbrèque F, Tambutté E, Ferrier-Pagès C (2003) Effect of
zooplankton feeding on the photosynthesis, tissue and skeletal growth of the scleractinian coral Stylophora pistillata. J Exp Mar Biol Ecol 296:145–166
Houlbrèque F, Tambutté E, Allemand D, Ferrier-Pagès C (2004a) Interactions between zooplankton feeding, photo-synthesis and skeletal growth in the scleractinian coral Stylophora pistillata. J Exp Biol 207:1461–1469
Houlbrèque F, Tambutté E, Richard C, Ferrier-Pagès C (2004b) Importance of a micro-diet for scleractinian corals. Mar Ecol Prog Ser 282:151–160
Jensen F, Winding Hansen B (2000) Ciliates and heterotro-phic dinoflagellates in the marginal ice zone of the central Barents Sea during spring. J Mar Biol Assoc UK 80:45–54 Jørgensen C (1996) Bivalve filter feeding revisited. Mar Ecol
Prog Ser 142:287–302
Klumpp DW, Bayne BL, Hawkins AJS (1992) Nutrition of the giant clam Tridacna gigas. 1. Contribution of filter feeding and photosynthates to respiration and growth. J Exp Mar Biol Ecol 155:105–122
Li WK (1995) Composition of ultraphytoplankton in the Central North Atlantic. Mar Ecol Prog Ser 122:1–8 Li WK, Veldhuis MJW, Post AF (1998) Alkaline phosphatase
activities among planktonic communities in the northern Red Sea. Mar Ecol Prog Ser 173:107–115
Lindell D, Post AF (1995) Ultraphytoplankton succession is triggered by deep winter mixing in the Gulf of Aquaba (Eilat), Red Sea. Limnol Oceanogr 40:1130–1141
Linley EAS, Koop K (1986) Significance of pelagic bacteria as a trophic resource in a coral reef lagoon, One Tree Island, Great Barrier Reef. Mar Biol 92:457–464
Lucas LV, Koseff JR, Cloern JE, Monismith SG, Thompson JK (1999) Processes governing phytoplankton blooms in estu-aries. 1. The local production–loss balance. Mar Ecol Prog Ser 187:1–15
Marie D, Partensky F, Jacquet S, Vaulot D (1996) Enumera-tion and cell cycle analysis of natural populaEnumera-tions of marine picoplankton by flow cytometry using the nucleic acid stain SYBR Green I. Appl Environ Microbiol 63: 186–193
ORC (Observatoire des Récifs Coralliens de Mayotte) (2003) Surveillance de l’état de santé des récifs, Campagne ORC 4: suivi 2002 — Analyse des communautés benthiques sur la période 1998–2002. ARVAM, SPEM, Mamoudzou Parsons TR, Stephens K, Strickland JDH (1961) On the
chemical composition of eleven species of marine phyto-plankton. J Fish Res Board Can 18:1001–1016
Partensky F, Blanchot J, Vaulot D (1999) Differential distribu-tion and ecology of Prochlorococcus and Synechococcus in oceanic waters: a review. Cyanobacteria and related organisms. Bull Inst Oceanogr Monaco 19:457–475 Petersen JK, Riisgard HU (1992) Filtration capacity of the
ascidian Ciona intestinalis and its grazing impact in a shallow fjord. Mar Ecol Prog Ser 88:9–17
Porter ET, Cornwell JC, Sanford LP (2004) Effect of oyster Crassostrea virginica and bottom shear velocity on ben-thic–pelagic coupling and estuarine water quality. Mar Ecol Prog Ser 271:61–75
Putt M, Stoecker DK (1989) An experimentally determined carbon: volume ratio for marine ‘oligotrichous’ ciliates from estuarine and coastal waters. Limnol Oceanogr 34(6): 1097–1103
Ribes M, Coma R, Atkinson MJ, Kinzie RA III (2003) Particle removal by coral reef communities: picoplankton is a major source of nitrogen. Mar Ecol Prog Ser 257:13–23 Ribes M, Coma R, Atkinson MJ, Kinzie RA III (2005) Sponges
and ascidians control removal of particulate organic nitrogen from coral reef water. Limnol Oceanogr 50: 1480–1489
Richter C, Wunsch M (1999) Cavity-dwelling suspension feeders in coral reefs — a new link in reef trophodynamics. Mar Ecol Prog Ser 188:105–116
Richter C, Wunsch M, Rasheed M, Kötter I, Badran MI (2001) Endoscopic exploration of Red Sea coral reefs reveals dense populations of cavity-dwelling sponges. Nature 413:726–730
Riisgard HU, Poulsen L, Larsen PS (1996) Phytoplankton reduction in near bottom water caused by filter feeding Nereis diversicola. Implications for worm growth and population grazing impact. Mar Ecol Prog Ser 141:47–54 Shashar N, Kimane S, Jokiel PL, Patterson MR (1996) Hydro-mechanical boundary layers over a coral reef. J Exp Mar Biol Ecol 199:17–28
Shimada A, Hasegawa T, Umeda I, Kadoya N, Maruyama T (1993) Spatial mesoscale patterns of West Pacific pico-phytoplankton as analysed by flow cytometry: their contri-bution to subsurface chlorophyll maxima. Mar Biol 115:
209–215
Sorokin YI (1973) On the feeding of some scleractinian corals with bacteria and dissolved organic matter. Limnol Oceanogr 18(3):380–385
Torreton JP, Dufour P (1996) Bacterioplankton production determined by DNA synthesis, protein synthesis, and frequency of dividing cells in Tuamotu Atoll lagoons and surrounding ocean. Microb Ecol 32:185–202
Vacelet E, Arnoux A, Thomassin BA, Travers M (1999) Influ-ence of freshwater and terrigenous material on nutrients, bacteria, and phytoplankton in a high Island lagoon: May-otte, Comoro Archipelago, Indian Ocean. Hydrobiologia 380:165–178
Van Duyl FC, Gast GJ, Steinhoff W, Kloff S, Veldhuis MJW, Bak RPM (2002) Factors influencing the short-term varia-tion in phytoplankton composivaria-tion and biomass in coral reef waters. Coral Reefs 21:293–306
Verity PG, Robertson CY, Tronzo CR, Andrews MG, Nelson
JR, Sieracki ME (1992) Relationship between cell volume and the carbon and nitrogen content of marine photo-synthetic nanoplankton. Limnol Oceanogr 37:1434–1446 Welschmeyer NA (1994) Fluorometric analysis of chlorophyll a in the presence of chlorophyll b and pheopigments. Limnol Oceanogr 39:1985–1992
Wild C, Huettel M, Klueter A, Kremb SG, Rasheed MY, Jør-gensen BB (2004) Coral mucus as an energy carrier and particle trap in the reef ecosystem. Nature 428:66–70 Wunsch M, Richter C (1998) The CaveCam — an endoscopic
underwater videosystem for the exploration of cryptic habitats. Mar Ecol Prog Ser 169:277–282
Yahel G, Post AF, Fabricius K, Marie D, Vaulot D, Genin A (1998) Phytoplankton distribution and grazing near coral reefs. Limnol Oceanogr 43:551–563
Yahel R, Yahel G, Berman T, Jaffe JS, Genin A (2005) Diel pattern with abrupt crepuscular changes of zooplankton over a coral reef. Limnol Oceanogr 50(3):930–944 Editorial responsibility: Urania Christaki,
Wimereux, France
Submitted: January 2, 2006; Accepted: June 1, 2006 Proofs received from author(s): August 9, 2006
![Table 1. Percent cover of scleractinian, soft corals and sponges on the reef transect: (a) at Point B (depth: 6 m) (data are means [± SD] of 3 transects; ORC 2003) and (b) from Points C to E](https://thumb-eu.123doks.com/thumbv2/123doknet/13613170.424889/4.918.474.827.201.686/table-percent-scleractinian-corals-sponges-transect-transects-points.webp)


