HAL Id: hal-01356263
https://hal.archives-ouvertes.fr/hal-01356263
Submitted on 25 Aug 2016
HAL is a multi-disciplinary open access archive for the deposit and dissemination of sci-entific research documents, whether they are pub-lished or not. The documents may come from teaching and research institutions in France or abroad, or from public or private research centers.
L’archive ouverte pluridisciplinaire HAL, est destinée au dépôt et à la diffusion de documents scientifiques de niveau recherche, publiés ou non, émanant des établissements d’enseignement et de recherche français ou étrangers, des laboratoires publics ou privés.
Microfluidic separation of magnetic nanoparticles on an
ordered array of magnetized micro-pillars
G Orlandi, P Kuzhir, Y Izmaylov, J Alves Marins, H Ezzaier, Laurent Robert,
F Doutre, Xavier Noblin, C Lomenech, Georges Bossis, et al.
To cite this version:
G Orlandi, P Kuzhir, Y Izmaylov, J Alves Marins, H Ezzaier, et al.. Microfluidic separation of magnetic nanoparticles on an ordered array of magnetized micro-pillars. Physical Review E , American Physical Society (APS), 2016, 93 (6), pp.062604. �10.1103/PhysRevE.93.062604�. �hal-01356263�
Microfluidic separation of magnetic nanoparticles on an ordered array of
magnetized micro-pillars
G. Orlandi
1, P. Kuzhir
1a), Y. Izmaylov
1, J. Alves Marins
1, H. Ezzaier
1,2,
L. Robert
3, F. Doutre
1, X.Noblin
1, C. Lomenech
1, G.Bossis
1,
A. Meunier
1, G. Sandoz
4and A. Zubarev
51University of Nice-Sophia Antipolis, CNRS, Laboratory of Condensed Matter Physics – UMR 7336, Parc Valrose,
06100 Nice, France
2Laboratory of Physics of Lamellar Materials and Hybrid Nano-Materials, Faculty of Sciences of Bizerte, University of
Carthage, 7021 Zarzouna, Tunisia,
3Franche-Comté Electronique Mécanique Thermique et Optique - Sciences et Technologies, CNRS UMR 6174, 15B
avenue des Montboucons, 25030 Besançon, France
4University of Nice-Sophia Antipolis, CNRS, INSERM, Institut de Biologie de Valrose – UMR 7277, UMR-S 1091, Parc
Valrose, 06100 Nice, France
5Urals Federal University, Lenina Ave 51, 620083 Ekaterinburg, Russia
Microfluidic separation of magnetic particles is based on their capture by magnetized micro-collectors while the suspending fluid flows past micro-collectors inside a micro-channel. Separation of nanoparticles is often challenging because of strong Brownian motion. Low capture efficiency of nanoparticles limits their applications in bio-analysis. However, at some conditions, magnetic nanoparticles may undergo field-induced aggregation that amplifies the magnetic attractive force proportionally to the aggregate volume and considerably increases nanoparticle capture efficiency. In this paper, we have demonstrated the role of such aggregation on an efficient capture of magnetic nanoparticles (about 80 nm in diameter) in a microfluidic channel equipped with a nickel micro-pillar array. This array was magnetized by an external uniform magnetic field, of intensity as low as 6-10 kA/m, and experiments were carried out at flow rates ranging between 0.3-30 µL/min. Nanoparticle capture is shown to be mostly governed by Mason number Ma, while the dipolar coupling parameter α does not exhibit a clear effect in the studied range, 1.4 < α < 4.5. The capture efficiency Λ shows a strongly decreasing Mason number behavior, Λ∝Ma-1.78 within the range, 32 ≤ Ma ≤ 3250. We have proposed a simple theoretical model, which considers destructible nanoparticles chains and gives the scaling behavior, Λ∝Ma-1.7, close to the experimental findings.
2
I. Introduction
Magnetic fluids composed of nanoscale (ferrofluids) or micron-sized magnetizable particles (magnetorheological suspensions) attract considerable interest of researchers and engineers due to a rich set of physical properties that are valuable for many industrial and bio-medical technologies. Development of the modern and perspective applications of these systems requires detailed study of internal mechanisms of macroscopic phenomena and behavior of magnetic fluids. Magnetic separation is one of the fields for the practical use of magnetic fluids. Since large-scale applications in ore beneficiation and power industry [1], magnetic separation is nowadays gaining a new interest in view of emerging applications to bioanalysis [2]. The basic idea consists of adsorption of biological cells or molecules onto a surface of magnetic bead functionalized with specific chemical groups. The beads bearing the target cells or molecules are then separated from the solvent containing other cells/molecules by means of a magnetic field gradient. Microfluidic technology allows integration of the whole bioanalysis process onto a single microchip along with considerable reduction of the reagent consumption. Since last decade, an important number of microfluidic devices have been developed and applied to cell manipulation, nucleic acid assays and various immunoassays [3]. Among different technological solutions, microfluidic channels with an ordered array of nickel or iron columns (micro-pillars) provide an effective retention of micron-sized magnetic beads. Micro-pillars are magnetized by external electromagnets or on-chip integrated micro-magnets. Analyzed aqueous sample is pushed through the micro-pillar array. The magnetic beads are attracted to micro-pillars and separated from the solvent. Such arrays are usually created by electroplating coupled with soft lithography [4-6] and have been successfully applied for the controllable capture and release of cancer cells [7-9], isolation of lymphocytes [10], in situ generation of cancer cell patterns [11], and magnetically actuated adhesion process [12].
3
Efficiency of the magnetic separation depends mostly on the magnetic bead size (radius rn) or rather on the ratio of the magnetic-to-thermal energy called dipolar coupling parameter [13, 14]:
2 2 3 0 0 2 3 n n B H r k T πβ μ α = , (1)
where μ0=4π·10-7 H/m – the magnetic permeability of vacuum; H0 – the magnetic field intensity ( 1) /( 2)
n n n
β = μ − μ + - magnetic contrast factor, with μn – initial relative magnetic permeability of
beads; kB=1.38·10-23 J/K – Boltzmann constant and T – absolute temperature.
Micron-sized beads possess large values of α and are easily separated. Nanoparticles have a smaller α and their capture often requires a high-gradient magnetic separation, which is not easily integrated into small-scale devices. Magnetic nanoparticles with a diameter of about 250 nm can still be effectively captured by a micro-pillar array at moderate magnetic fields (20kA/m) [5,7,9]. However, microfluidic capture of nanoparticles as small as 50 nm in diameter requires much higher fields (200 kA/m) [15, 16] and, to the best of our knowledge, has never been reported for micro-pillar systems. Colloidal stability and high specific surface area of nanoparticles is their unconditional advantage in comparison to microbeads. Thus, substantial improvement of microfluidic separation of nanoparticles is a key feature for their successful applications in bioanalysis.
Despite the physical limitation related to small values of the α-parameter, we have recently shown that the capture of magnetic nanoparticles (as small as 50-60 nm in size) is still possible if they are able to undergo field-induced phase separation caused by dipole-dipole interactions [17]. In this case, nanoparticles gather into bulk drop-like aggregates having α 1. These aggregates are separated from the solvent much easier than isolated nanoparticles. Studies of the nanoparticle capture by a single collector or by a packed bed of magnetized micro-spheres of radius rm have shown that the capture efficiency is still efficient at magnetic fields as low as 10 kA/m [14,18] and is mostly governed by the ratio of the magnetic-to-hydrodynamic forces – Mason number, defined as follows [18, 19]:
4 0 2 2 0 0 3 m n n ur Ma H r η β μ = , (2)
where η0 is the solvent viscosity, and u is the filtration speed.
In this paper, we aim to demonstrate the feasibility of the low-field separation of magnetic nanoparticles on an ordered array of nickel micro-pillars integrated into a microfluidic channel. To this purpose, we develop a theoretical model predicting nanoparticle capture efficiency as function of Mason number. The role of the field-induced aggregation of nanoparticles on the capture efficiency is analyzed. To validate the theoretical model, the capture efficiency is quantified experimentally and compared to the calculated one.
II. Theory
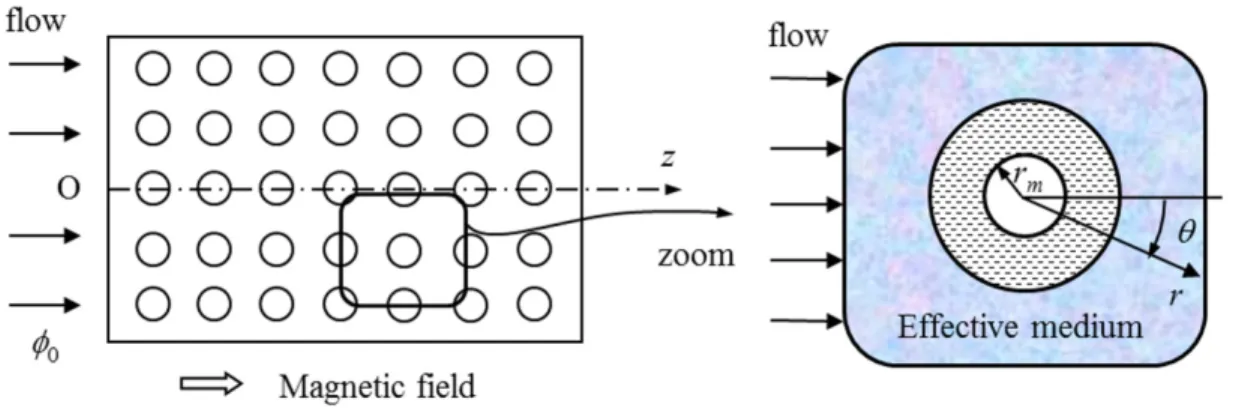
Consider a micro-filter composed of a microfluidic channel containing an ordered array of cylindrical micro-pillars oriented perpendicularly to the channel walls and spanning all the channel width. Assume a laminar flow of the nanoparticle suspension (dilute ferrofluid) through the micro-filter along its symmetry axis, z, with a filtration speed u=Q/A, as shown in Fig. 1, where Q and A are respectively the flow rate and the cross-section area of the filter. Micro-pillars are magnetized by an external magnetic field of an intensity, H0, applied parallel to the flow such they can capture a certain amount of nanoparticles situated in their vicinity. Depending on its initial position at the filter inlet, as well as on u and H0, a given nanoparticle is either captured and retained in the filter or passes through the filter. The capture efficiency of the micro-filter is defined through the ratio of the number of nanoparticles entering the filter to the number of particles leaving the filter. In this section, we seek to find the capture efficiency of the filter as function of Mason number.
This dependency will be found using a two-scale approach frequently used in filtration theory [20]. First, temporal evolution of the amount of the captured nanoparticles inside the micro-filter will be predicted on a macroscopic scale [Sec. II-A]. On this scale, microscopic mechanism of the capture (magnetic attraction with micro-pillars in our case) will be discarded and the capture efficiency will be
5
characterized by some unknown coefficient Λ. Then, on a microscopic scale, nanoparticle flux to each micro-pillar will be evaluated at different Mason numbers, Ma, and the coefficient Λ will be calculated as function of Ma. This calculation will be done under assumptions of isolated nanoparticles [Sec. II-B] and chained nanoparticles [Sec. II-C], the latter case allowing estimation of the effect of the field-induced aggregation on the capture efficiency.
Fig. 1 (Color online). Schematic description of the capture of magnetic nanoparticles on macroscopic (left) and microscopic (right) scales
A. Macroscopic scale: amount of captured nanoparticles
Filtration process implies some variation in particle concentration along the filter, which evolves with the time t and is described by the concentration profiles φ(t, z) and σ(t, z) of non-captured and captured particles, respectively. These quantities are obtained from the set of phenomenological filtration equations [20, 21]: ( ) F z σ λ σ σ ∂ = − ∂ ; (3a) 0 0 0 ( ) d u F dq σ = λ σ φ ; (3b) 0 0 ( , ) ( , ) ( ) q z q z q φ σ φ = σ (3c)
where φ0 and σ0 are concentrations of non-captured and captured nanoparticles at the filter inlet;
( , ) (1 ) /
6
hereinafter we put q t z( , )≈t for the present case ut L/ 1; λ is the phenomenological filter coefficient; ( ) 1 / m
F σ = −σ σ is the correction factor taking into account a decrease of the capture efficiency with a progressive particle deposition; σm is the maximum value of σ when the filter is saturated.
Equations (3a), (3b) were solved with respect to the desired quantity, σ, under initial and boundary conditions as follows: σ0(q= = ; 0) 0 σ( ,q z= =0) σ0( )q . The resulting expression is obtained in the dimensionless form:
0 0 1 / / ( , ) 1 1 m m Z m e Z e φ τ σ φ τ σ σ τ σ − Λ − Λ − Λ ⎡ ⎤ = ⎢ + ⎥ − ⎣ ⎦ (4)
where Z =z L/ is the dimensionless coordinate along the flow axis, τ =ut L/ is the dimensionless time, and Λ =λL is the dimensionless capture efficiency defined as a logarithm of the ratio of the inlet to outlet particle concentration at the beginning (τ=0) of the capture process: Λ =ln( /φ φ0 out). The
parameter Λ depends on the micro-filter geometry and on the forces driving nanoparticle capture, therefore, on Mason number, as shown below.
In the limit Λ 1, the volume fraction σ of captured particles becomes nearly-constant along the filter, and the equation (4) reduces to:
(
0 /)
( ) 1 m
m e φ τ σ
σ τ ≈σ − − Λ (5)
Comparison of the last two equations shows that the equation (5) works reasonably well beyond the limit Λ 1, until Λ ≈ . The majority of our experimental data fits into the range 1 0≤ Λ ≤1, thus, equation (5) will be employed hereinafter for the data processing in Sec. IV-A.
B. Microscopic scale: single particle capture
The Mason number dependency of the capture efficiency Λ can be estimated by considering the nanoparticle capture process at the micro-pillar scale. First, consider the simplest case of capture of isolated nanoparticles, which are not agglomerated under dipole-dipole interactions.
7
Since the micro-pillars are spaced relatively far apart from each other, a cell representation of the filter should be a reasonable approximation taking into account the effect of neighboring micro-pillars on particle capture by a given micro-pillar. According to this model, the space around a given micro-pillar is represented by a homogeneous effective medium except for an annular layer surrounding the micro-pillar and whose inner-to-outer diameter ratio is equal to the fraction c of filter volume occupied by micro-pillars [Fig. 1]. Using this geometry, the relationship Λ = f Ma( ) is obtained from the following considerations. The capture rate ∂σ / t∂ in the beginning of the capture process (τ=0) is related to the filter coefficient λ and to the flux J of nanoparticles captured by a single micro-pillar by the following expression [20]:
Au n Jcoll t σ λφ ∂ = = ∂ (6) where /( 2 ) coll m
n =c πr h is the number density of the micro-pillars of the radius rm and height h; φA is the volume fraction of nanoparticles arriving to the cell. Neglecting diffusion flux, the flux J of captured particles can be calculated by integration of the magnetophoretic flux density over a fraction Ω of the micro-pillar surface at which the flux is inward:
r J φξF dS
Ω
= −
∫
(7)where ξ =1/(6πη0rn) is the nanoparticle mobility, η0 is the viscosity of the suspending liquid; φ is the nanoparticle concentration on a micro-pillar surface and Fr is the radial component of the magnetic force acting on nanoparticles (possessing an induced dipole moment) at the micro-pillar surface and is given by the following expression [14]:
3 2 0 2 m r n n r r H F r r πμ β = ⎛∂ ⎞ = ⎜ ∂ ⎟ ⎝ ⎠ (8)
The distribution of the magnetic field intensity H inside the concentric cell around a magnetized micro-pillar is given by a solution of the magnetostatic problem in the concentric cylinder geometry
8
[Fig. 1] with the relative magnetic permeabilities of three different domains taking the following values: (i) μm for the inner cylinder (nickel micro-pillar); (ii) μ=1 for the annular fluid layer; and (iii)
(1 ) /(1 )
e c m c m
μ = + β − β for the effective medium outside the outer cylinder, where ( 1) /( 1)
m m m
β = μ − μ + is the magnetic contrast factor of the micro-pillar. The expression for μe comes from the mean field Maxwell-Garnett theory [22] applied to the cylindrical geometry. The magnetic field distribution takes the following form in polar coordinates (r,θ), with the origin set at the micro-pillar center and the polar angle θ counted from the direction of the applied external field H0:
2 0 1 cos 1 m r m m H r H c β r θ β ⎛ ⎛ ⎞ ⎞ = ⎜⎜ + ⎜ ⎟ ⎟⎟ − ⎝ ⎝ ⎠ ⎠ ; 2 0 1 sin 1 m m m H r H c r θ β β θ ⎛ ⎛ ⎞ ⎞ = − ⎜⎜ − ⎜ ⎟ ⎟⎟ − ⎝ ⎝ ⎠ ⎠ ; 2 2 2 r H =H +Hθ (9) The integration of Eq. (7) is considerably simplified in the limit of high Mason numbers,
1
Ma , encountered in our experiments. Analysis shows that in this case: (1) the nanoparticle concentration is nearly homogeneous in the whole cell and φ φ≈ ; (2) the nanoparticles are captured by A almost the whole surface of the micro-pillar [18], except for the regions where the magnetic interaction between nanoparticles and micro-pillar is repulsive; these regions correspond to the range of polar angles
[
± ± mθ π θ0; 0]
with the critical angle θ0 =(1/ 2)(π−acosβm) found from the condition0 2
(∂H / )∂r θ θ= = . Thus, in the limit 0 Ma 1, the magnetophoretic flux [Eq. (7)] and the capture efficiency can be found without the need of knowing the velocity distribution of the suspending liquid around micro-pillars. Combining together Eqs. (6) - (9) we arrive, after some algebra, at the final expression for the capture efficiency of isolated nanoparticles:
(
2)
1 2 8 1 ( acos ) (1 ) m m m m m m c L L Ma c r β λ β β π β π β − Λ = = − + − − , (10)valid for Ma 1. Note that, in the limit of small micro-pillar concentrations, c 1, our model predicts the capture efficiency two times larger than that calculated by Gerber under assumption of potential flow
9
within the framework of the theory of high gradient magnetic separation [23]. This discrepancy comes from the fact Gerber has considered the nanoparticle capture only by the front side of the micro-pillars, while in reality the nanoparticles are captured by both the front and the rear sides at Ma 1, whatever the flow type – potential or creeping. Finally, in the present case of micro-pillars with high magnetic permeability, μm 1 and βm ≈ , the last equation is reduced to: 1
1 2 8 (1 ) m cL Ma c r − Λ ≈ − , (11)
This last equation (11) will be used for comparison with experiments in Sec. IV-B.
C. Microscopic scale: capture of chain-like aggregates
The theoretical correlation [Eq.(11)] is obtained for the case of isolated nanoparticles. Field-induced clustering of nanoparticles is probably responsible for higher capture efficiency at low Mason numbers, while the clusters are destroyed by the flow at higher values of Ma. Nanoparticle chaining likely occurs at slow flows in the considered experimental range of dipolar coupling parameters and particle volume fractions (1.4<α<4.5, φ=3.2·10-3), according to the phase behavior predicted for dipolar particles [24, 25]. The magnetic force exerted by micro-pillars to N –particle chains is roughly N times the force experienced by isolated nanoparticles. Particle chaining is therefore expected to increase significantly the capture efficiency, Λ, while the flow destroys the chains leading to a strong decrease of Λ.
To check this hypothesis, let us assume that the nanoparticles are gathered to single straight chains containing N particles having a variable length depending on the intensity of the flow and of the magnetic field. The advective flux of the chains,
∫
Ωφv dSr , at the creeping flow in the vicinity of themicro-pillar is much smaller than the magnetophoretic flux [Eq. (7)] because the suspending liquid velocity (as well as its radial component vr) is close to zero. Behavior of the chains situated near the micro-pillar surface is therefore supposed to be governed mostly by the magnetic field. The chains are assumed to be oriented along the magnetic field lines, and their demagnetizing field is associated to the
10
longitudinal component, n , of the demagnetization factor tensor. Since, in high permeability limit, 1
m
μ , the magnetic field lines are almost perpendicular to the micro-pillar surface, the chains are almost perpendicular to the flow streamlines in the vicinity of the micro-pillar. Thus, their hydrodynamic drag will be described by a transverse component ξ⊥ of the mobility tensor. The magnetophoretic flux of the chains captured by the micro-pillar is still given by Eq. (7), in which the single-particle mobility ξ should be replaced by the chain mobility, ξ⊥. The quantities ξ⊥ and Fr intervening into Eq. (7) are given by the following expressions, derived under commonly used approximation where the particle chain is represented by an ellipsoid of revolution with diameter, length and aspect ratio equal to 2rn, 2rnN and N, respectively [26, 27]:
(
0 2)
16 2 (1 ) /( 1) n r N N πη ξ γ γ ⊥ = + − − (12a) 2 3 0 2 m r n r r H F Nr r πμ β = ⎛∂ ⎞ = ⎜ ∂ ⎟ ⎝ ⎠ (12b) acosh2 1/ 2 ( 1) N N N γ = − , (12c) 1 1 3 1 ( 1) n n n μ β μ − = + − (12d) 2 3/ 2 atanh( 2 1)1/ 2 ( 2 1)1/ 2 ( 1) N N N n N N N ⎡ − − ⎤ = − ⎢ − ⎥ ⎣ ⎦ (12e)Combining together Eqs. (6), (7), (9), (12), we show that the capture efficiency for chained nanoparticles, Λch, can be found from Eq. (11) by introducing a correction factor, K(N)≥1, increasing with the chain aspect ratio N (or number of particles per chain):
1 2 ( ) 8 ( ) (1 ) ch m cL K N K N Ma c r − Λ = Λ ≈ − (13a)
11 2 2 2 1 ( ) 2 8 1 ( 1) 1 n n N K N n N μ γ γ μ + ⎛ − ⎞ = ⎜ + ⎟ + − ⎝ − ⎠ (13b)
with γ and n given respectively by Eqs. (12c) and (12e). In the present case of the magnetic nanoparticles with relatively high magnetic permeability, μn ≈30 1, the correction factor [Eq. (13b)] can be fitted by a simple power law trend valid at a maximal error of 25% within the range of the chain aspect ratio 1≤N ≤8:
7 / 5
( )
K N ≈N (14)
Both exact [Eq. (13b)] and approximate [Eq. (14)] expressions for the correction factor are compared in Fig. 2 where they are plotted against the chain aspect ratio N. Notice that both expressions have the same first order term of the series expansion around the point N=1 in the limit μn 1,
2
( ) 1 (7 / 5)( 1) (( 1) )
K N = + N− +O N− . Thus, the exact function K(N) has the same slope at N=1 in a log-log scale, equal to 7/5, as the slope of the approximate power law dependency K N( )≈N7 / 5.
Fig.2 (Color online). Dependency of the correction coefficient of the capture efficiency on the chain aspect ratio
Since the micro-pillars perturb the flow streamlines, the chains travelling through the filter are subject to local shear fields that impose either tensile or compressive forces on the chains, depending on their orientation with respect to the streamlines and on their position with respect to the micro-pillars. The tensile hydrodynamic forces tend to destroy the chains while the compressive hydrodynamic force
12
and magnetic force between particles inside the chains tend to consolidate the chains. At this moment, we are unable to predict the chain length at any point of the micro-filter. Instead, we will provide a scaling behavior of the chain length with Mason number. To this purpose, we suppose that an average (over some effective layer adjacent to the micro-pillar surface) chain length is defined by a balance of the tensile hydrodynamic force and the magnetic attractive force. These both forces scale as
2 0 ( ) h n F η ε& Nr and 2 2 0 0 m n
F μ H r [28], where ε& u r/ m is the order of magnitude of the extension rate along the chain axis. Equalizing these forces, we arrive at the following scaling of the chain aspect ratio:
1/ 2 2 1/ 2 0 0 0 m H r N Ma u μ η − ⎛ ⎞ ∝ ⎜ ⎟ ⎝ ⎠ (15)
Such an approach is often used in magnetorheology for estimation of the length of magnetic particle chains under magnetic and shear fields [28]. Finally, substituting Eq. (15) into Eq. (14) and then into Eq. (13a), we get the following scaling behavior of the capture efficiency in frames of the chain model, approximately valid for the chain aspect ratios 1≤N≤8:
7 / 5 ( 1/ 2 7 / 5) 1 1.7
ch N b Ma− Ma− b Ma−
Λ = Λ = = ⋅ (16)
This equation (16) will then be fitted to experimental data [Sec. IV-B] and the numerical multiplier b at Ma-1.7 will be used as a single adjustable parameter.
III. Materials and methods
To carry out filtration experiments, we fabricated a microfluidic channel with a nickel micro-pillar array created on a glass substrate by electroplating and soft photolithography, according to a general procedure described by Deng et al. [4]. First, the glass substrate was covered with a seed layer to permit the electrodeposition of nickel. Then, a 50 µm thickness of a positive photosensitive resist AZ 9260 (MicroChemicals GmbH, Germany) was applied onto the metalized glass substrate by spray coating. A chromium glass mask (with a square array of circles) was used for the lithography step to expose the resist with ultraviolet radiation of an energy density of 1.3 J/cm2. The exposed part of the
13
resist was developed with the aqueous alkaline solution AZ 400K (MicroChemicals GmbH, Germany). Then, oxygen plasma was used for the removal of organic residues at the bottom of the patterns. At the end of this stage, ordered arrays of cylindrical holes were formed in the resist layer. After that, the nickel micro-pillars were formed in the pre-designed holes by electroplating using a nickel sulfamate (Sigma Aldrich, France) bath. At the end, the photosensitive resist was stripped with acetone, and the seed layer was removed by ionic etching in Argon plasma. Finally, a polydimethylsiloxane (PDMS, Sigma Aldrich, France) cover was fabricated by a photolithography with a photosensitive resist SU8-2075 (Microchem, United States) and glued to the glass substrate (bearing the nickel micro-pillars) using oxygen plasma. Aluminum needles were introduced to the PDMS cover at both its extremities allowing the channel inlet and outlet. The resulting microfluidic channel is schematically presented in Fig.3a along with an optical microscopy image of the micro-pillar array [Fig. 3b]. In experiments, we used a square 10x10 array with micro-pillar diameter of 2rm=50µm and expected height of h=50µm and a distance between micro-pillar axes of Δ=100µm. The fraction of the filter volume occupied by the pillars is 2/ 2 0.2
m
c=πr Δ ≈ . The width of the PDMS channel was equal to 3 mm, the height was fitted to the micro-pillar height (50µm) and the distance between inlet and outlet was 12 mm.
Water-dispersible iron oxide nanoparticles, or rather aqueous ferrofluids, were synthesized by a co-precipitation method, as described in details in [17]. At the issue of the synthesis, instead of isolated nanoparticles, we obtained permanent isotropic nanoclusters of a mean diameter of 2rn≈84 nm and an initial magnetic permeability μn≈30, as inferred from magnetization measurements. The prepared ferrofluid was diluted by distilled water (viscosity η0=10-3 Pa.s) to the particle volume fraction of
14
Fig.3 (Color online). Sketch of the microfluidic channel with a micro-pillar array (a). An optical microscopy image of a fragment of the micro-pillar array is shown on figure (b), the deposits of nanoparticles captured by the micro-pillars are schematically presented in figure (c); the deposit area is S is hatched.
The diluted ferrofluid was pushed through the microfluidic channel by a syringe pump Harvard PHD Ultra (United States) at the flow rates ranging from Q=0.3 to 30 µL/min, corresponding to the range of filtration speeds u=Q/A=3.4×10-5-3.4×10-3 m/s, with A being the channel cross section. The channel was placed into a transmitted light inverted microscope Nikon Diaphot-TMD (Japan) equipped with the complementary metal oxide semiconductor (CMOS) camera PixelInk PL-B742U (Canada). A homogeneous external magnetic field, of an intensity ranging from H0=6.05 to10.9 kA/m, was generated by a pair of home-made Helmholtz coils placed around the microscope. The external field was oriented along the main flow in the channel and transversely to the micro-pillars [Fig. 3a]. The experimental range of the magnetic field corresponded to the range of the dipolar coupling parameters 1.4<α<4.5 [Eq.(1)].
The experimental procedure can be summarized as follows. After careful filling of the system, the diluted ferrofluid was pushed through the channel at a desired flow rate for 5 min in the absence of the magnetic field. Then, the magnetic field, of a desired intensity, was applied. The applied field magnetized the micro-pillars and they became capturing the ferrofluid nanoparticles. As a result, a
15
progressive formation of nanoparticle deposits was observed in the vicinity of the magnetic poles of each micro-pillar, as presented schematically in Fig. 3c. The snapshots of the micro-pillar array were taken each minute during 1h of observation. The snapshots were processed with the ImageJ software allowing calculation of the surface S occupied by nanoparticle deposits [Fig. 3c], as well of the relative deposit area s=S/Stot as function of dimensionless time τ =ut L/ , flow rate and field intensity, where L=1 mm is the length of the micro-pillar array and Stot is the total area of the filter including the micro-pillars and the voids between them. For comparison with the theoretical model, the relative deposit area s was related to the volume fraction of captured particles σ [Eq. (5)] through the deposit internal volume fraction Φ (ratio of the total volume of captured particles to the deposit volume). Namely, we get σ = Φ ⋅ for any elapsed time s τ, and σm = Φm ms at steady state (saturated filter, τ → ∞), with Φm and sm being the values of Φ and s at steady state. In the considered limit τ 1, one may suppose
m
Φ ≈ Φ , with the value Φ ≈m 0.70 being close to the maximum packing fraction of the body-centered tetragonal (bct) lattice, as inferred from the theoretical analysis [14]. This allows fitting the experimental dependencies s( )τ by the following equation:
(
0 /( ))
( ) 1 sm
m
sτ ≈s −e− Λφ τ Φ (17)
valid for Λ ≤ . The capture efficiency, Λ, was used as an adjustable parameter of this fit, and was 1 compared to the theoretical one [Eq. (11) or Eq. (16)] in function of Mason number.
IV. Results and discussion A. Kinetics of nanoparticle capture
Progressive capture of nanoparticles is shown in Fig.4 where a sequence of snapshots of the micro-pillar array is presented at different elapsed times since the application of the magnetic field (each row corresponds to t=0, 15, 30, and 45 min), at different filtration speeds u and at the same external magnetic field H0=6.05 kA/m oriented along the flow, horizontally with respect to the figure. In the
16
absence of field (t=0, the 1st row of the snapshots), a homogeneous medium filling the space between pillars is observed. In the presence of field and flow (t>0), nanoparticles form deposits extended along the applied field around each pillar. The size of these deposits increases with time and decreases with the filtration speed because of increasing hydrodynamic forces eroding the particles from the interface between the deposit and the ambient fluid. At higher speeds (u>1.88 mm/s), the deposits achieve a steady shape and size corresponding to a balance between nanoparticle fluxes arriving to and leaving the deposits.
Fig. 4 (Color online). Snapshots of the micro-pillar array with deposits of the captured nanoparticles at the applied magnetic field, H0=6.05 kA/m, oriented along the main flow, horizontally with respect to the snapshots. Each row of snapshots
corresponds to the fixed elapsed time equal to t=0, 15, 30, and 45 min from the upper to the bottom row. The first row at t=0 corresponds to micro-pillars clear from nanoparticle deposits. Each column corresponds to different filtration speeds, u, whose value is given on the top of the figure. The scale bar of 100µm is presented on the left upper snapshot
17
At steady state, our micro-filter is saturated and no more captures the nanoparticles. At sufficiently long elapsed times, stripe patterns of percolated deposits are observed at lower speeds, u≤1.88 mm/s. They are replaced by separate patterns at higher speeds, u≥3.41 mm/s, whose oval shape is qualitatively similar to the one predicted and observed for a single spherical collector [14,17].
Unfortunately, we were unable to reliably measure the nanoparticle concentration downstream the micro-filter. However, the quantity of the captured particles is quantified in terms of the relative deposit area s [cf. Sec. III], plotted as function of the dimensionless elapsed time τ in Fig. 5 for the fixed value of the applied magnetic field, H0=6.05 kA/m, and for six different filtration speeds u (or Mason numbers Ma). The relative deposit area increases progressively with time and tends to saturation at high Mason numbers, Ma≥1790. Apparently, one hour experiments were too short for achieving steady state plateau at relatively low speeds corresponding to Ma≤818. As expected, at any fixed time, the relative deposit area increases with a decrease in flow rate and consequently with a decrease in Mason number.
Fig.5 (Color online). Experimental time dependencies of the relative deposit area for the applied magnetic field
H0=6.05kA/m and at different filtration speeds u corresponding to different values of Mason number. The inset shows two
upper curves in an extended time scale. Symbols stand for experimental data; solid lines correspond to the fit of the data by Eq.(17). The upper curve at Ma=323 was fitted by Eq. (4).
18
Figure 5 shows that experimental dependencies s(τ) are fitted reasonably well with Eq. (17) (solid lines) in all cases except for the lowest Mason number, Ma=323. This signifies that the classical filtration equations (3) can be safely used for the macroscopic description of the microfluidic filtration of magnetic nanoparticles. In the case of Ma=323, corresponding to Λ>1, the flow was stopped (because of time limitation) long before achieving the steady state, and the data were fitted with Eq. (4), in which
σ and σm were replaced by Φ·s and Φ·sm, respectively, with Φ ≈ Φ ≈m 0.70. Both fitting parameters of
Eqs. (17) and (4), the maximum deposit relative area sm and the capture efficiency Λ quantify the filtration process and are studied in details in the next Section.
B. Retention capacity and capture efficiency
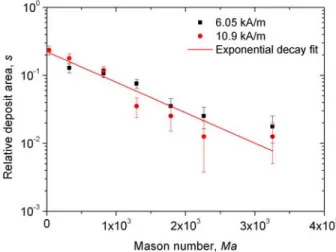
The maximum deposit relative area sm describes the maximum amount of nanoparticles that the micro-filter is able to retain at the given magnetic field intensity H0 and filtration speed u, thus at a given value of Mason number Ma. The values of sm are plotted against Mason number in Fig. 6 for two values of the applied magnetic field, H0=6.05 kA/m and 10.9 kA/m.
Fig. 6 (Color online). Experimental Mason number dependency of the relative deposit area
As is seen from this figure 6, experimental dependencies sm(Ma), are gathered along a single straight line in a semi-log scale. They exhibit an exponential decay, 0 a Ma
m
s =s e− ⋅ , valid in the range of
Mason numbers 30<Ma< ×3 103, with the fitting parameters,
0 0.223 0.025
19
3 4
1.03 10 1.8 10
a= × − ± × − . Such behavior agrees qualitatively with the one of the size of nanoparticle
deposits formed around a single spherical collector [14]. Quantitatively, at Mason numbers as high as Ma=2×10³ (at u≈2 and 7 mm/s for H
0=6.05 and 10.9 kA/m, respectively), the deposit size is about 10% of the micro-pillar size and the particle capture is still guaranteed. The experimental value s0 ≈0.22 of the relative deposit area at Ma→0 is consistent with the value 2
0 2 /m ( / )m 0.3
s = r Δ −π r Δ ≈ (with Δ - a distance between micro-pillar axes) estimated under assumption of straight stripe patterns observed in steady state at slow flows [Fig.4].
The second fitting parameter, Λ, describes capture efficiency at the beginning of the separation process and is plotted in function of Mason number in Fig. 7 for two values of the applied magnetic field, H0=6.05 kA/m and 10.9 kA/m. The data for both values of the magnetic field (corresponding to
α=1.4 and 4.5) collapse onto a straight line in a log-log scale. Such a collapse shows that the dipolar coupling parameter α [Eq. (1)] does not influence the capture process in the considered range, 1.4<α<4.5; this justifies the neglect of Brownian motion in our model. The master curve shows a power law decay of Λ with Mason number: Λ = ⋅b Ma−n, with b=(4.09 0.32) 10± × 3 and n=1.78 0.38± (solid
line).
20
The theoretical correlations, obtained in the frame of isolated particle model [Eq.(11)] and chain model [Eq. (16)], correspond to the dashed black and dotted blue lines in Fig.7. We remark a quantitative difference between the single particle model (Λ ∝Ma−1) and the experimental behavior (
1.78 Ma−
Λ ∝ ). Such discrepancy cannot be explained only by the interplay between magnetic and hydrodynamic forces acting on isolated nanoparticles, even including Brownian motion into consideration. As, stated in Sec. II-C, field-induced clustering of nanoparticles is responsible for higher capture efficiency at low Mason numbers, while the clusters are destroyed by the flow at higher values of Ma. The chain model takes into account these effects and gives the scaling law, 1.7
ch b Ma−
Λ = [Eq.
(16)] fitted to the experimental data with the free parameter b (3.00 0.22) 103
= ± × . This scaling law (blue dotted line in Fig. 7) appears to be very close to the initial power-law fit Λ =b Ma−n of
experimental data with n=1.78 0.38± (solid line). This qualitatively supports our hypothesis on a strong decrease of the capture efficiency with Mason number because of destruction of particle aggregates (chains) with increasing filtration speeds. A more precise determination of the chain length taking into account a local force balance and kinetics of their growth and destruction is required for quantitative predictions of the capture efficiency. Notice that the previous study of the nanoparticle separation in a three-dimensional (3D) filter composed of a packed bed of micron-sized magnetizable beads showed a less strong decrease of the capture efficiency with Mason number [18]: Λ ∝Ma−1 at
4
10
Ma> . This is probably because, in the range of such high Mason numbers, all the nanoparticle chains are destroyed by the flow and the capture behavior is well reproduced by the single particle model giving Λ ∝Ma−1 [Eq. (11)] while, in the present work, the Mason numbers are lower and the
chains resist to the flow.
V. Conclusions
In summary, we attempted to demonstrate efficient capture of magnetic nanoparticles (about 80 nm in diameter) in a microfluidic channel equipped with a micro-pillar array at small applied magnetic
21
fields. At filtration speed u=0.034 mm/s and applied field, H0≈10.9 kA/m (Mason number Ma=32), the capture efficiency was Λ≈5.5, indicating that more than 99.5% of particles were retained by the micro-filter during a characteristic time t Φs Lm /(φ0Λ ≈ min, allowing analysis of a few-µ-liter samples. u) 5 Alternatively, similar retention capacity can be achieved at lower magnetic fields and higher speeds using a closed-loop configuration, i.e. forcing the sample to pass several times through the micro-filter [18].
From the physical point of view, nanoparticle capture is mostly governed by Mason number and the capture efficiency exhibits a strongly decreasing Mason number behavior, Λ ∝Ma−1.78 0.38± in the
range 32≤Ma≤3250. The chain model assuming destructible nanoparticle chains allowed us to recover this experimental trend. The predicted scaling Λ ∝Ma−1.7 is very close to the experimental one
and is explained by a product of the two following effects: (a) a decrease of the capture efficiency with increasing filtration speed washing the nanoparticles away from the micro-pillars and giving a contribution to the capture efficiency proportional to Ma−1; (b) a decrease of the capture efficiency with
a decreasing chain length providing a term scaling with Ma−0.7.
Despite of such a strong loss of the capture efficiency with increasing filtration speed, we believe that nanoparticle clustering is a key feature that will allow in future an efficient microfluidic separation of magnetic nanoparticles. An appropriate magneto-fluidic design could promote nanoparticle aggregation before they arrive to the micro-pillar array. Thus, a separate fundamental study is required for the better understanding how kinetics of nanoparticle aggregation affects the capture process. On the other hand, the use of optimized geometry of the micro-pillar array (hexagonal lattice, transverse magnetic field) is expected to significantly improve the nanoparticle capture efficiency as compared to that reported in the present paper.
22
Acknowledgements
The authors are very grateful to the LPMC director Prof. F. Mortessagne for financial support. This work was partly supported by the Project PICS 6102 CNRS/Ural Federal University as well as by the French RENATECH network and its FEMTO-ST technological facility which has fabricated the micro-pillar arrays. One of the authors (J. AM) acknowledges CNPq through its post-doctoral fellowship (ref. 203100/2014-0), another author (H.E.) acknowledges FSB through its PhD collaboration fellowship and the author A.Z. acknowledges the Program of Ministry of Science and Education of the Russian Federation (3.12.2014/К) as well as the Russian Fund of Fundamental Investigations, project 14-08-00283.
[1] J. Svoboda, Magnetic Techniques for the Treatment of Materials (Kluwer Academic Publishers, Dordrecht, 2004).
[2] M. Zborowski and J. J. Chalmers, Magnetic Cell Separation (Elsevier, Amsterdam, 2008). [3] M. A.M. Gijs, F. Lacharme and U. Lehmann, Chem. Rev. 110, 1518 (2010)
[4] T. Deng, M. Prentiss, and G. M. Whitesides, Appl. Phys. Lett. 80, 461 (2002)
[5] S.S. Guo, C.C. Zuo, W.H. Huang, C. Peroz and Y. Chen., Microelectron. Eng. 83, 1655 (2006). [6] J.J. Palfreyman, F. van Belle, W-S. Lew, Th. Mitrelias, J.A.C. Bland, M. Lopalco and M. Bradley, IEEE Trans. Magn. 43, 2439 (2007)
[7] Y-J. Liu, S.S. Guo, Z.L. Zhang, W.H. Huang, D. Baigl, M. Xie, Y. Chen and D.W. Pang, Electrophoresis 28, 4713 (2007)
[8] K. Zhang, L.B. Zhao, S.S. Guo, B.X. Shi, T.L. Lam, Y.Ch. Leung, Y. Chen, X.Z. Zhao, H.L.W. Chan, and Y. Wang, Biosens. Bioelectron. 26, 935 (2010).
[9] X. Yu, R. He, S. Li, B. Cai, L. Zhao, L. Liao, W. Liu, Q. Zeng, H. Wang, S.S. Guo, and X.Z. Zhao, Small, 22, 3895 (2013).
[10] T. Dong, Q. Su, Z. Yang, Y. Zhang, E.B. Egeland, D.D. Gu, P. Calabrese, M.J. Kapiris, F. Karlsen, N.T. Minh, K. Wang, and H. Jakobsen, J. Micromech. Microeng. 20, 115021 (2010).
[11] X. Yu, X. Feng, J. Hu, Z.L. Zhang, and D.W. Pang, Langmuir 27, 5147 (2011). [12] D.M. Drotlef, P. Blümler, and A. del Campo, Adv. Mater. 26, 775 (2014).
[13] R. E. Rosensweig, Ferrohydrodynamics (Cambridge University Press, Cambridge, U.K., 1985). [14] C. Magnet, P. Kuzhir, G. Bossis, A. Meunier, S. Nave, A. Zubarev, C. Lomenech and V. Bashtovoi, Phys. Rev. E 89, 032310 (2014).
[15] D.W. Inglis, R. Riehn, R.H. Austin, and J.C. Sturm, Appl. Phys Lett. 85, 5093 (2004). [16] D.W. Inglis, R. Riehn, J.C. Sturm, and R.H. Austin, J. Appl. Phys. 99, 08K101 (2006)
[17] C. Magnet, P. Kuzhir, G. Bossis, A. Meunier, L. Suloeva, and A. Zubarev, Phys. Rev. E 86, 011404 (2012).
[18] C. Magnet, M. Akouala, P. Kuzhir, G. Bossis, A. Zubarev, and N.M. Wereley, J. Appl. Phys. 117; 17C719 (2015)
[19] G. Bossis, O. Volkova, S. Lacis, and A.Meunier, in Magnetorheology: Fluids, Structures and Rheology, edited by S. Odenbach (Springer, Berlin, 2002)
23
[20] C. Tien, and B. V. Ramarao, Granular Filtration of Aerosols and Hydrosols (Elsevier Science & Technology Books, New York, 2007)
[21] J.P. Herzig, D. M. Leclerc, and P. Le Goff, Ind. Eng. Chem. 62, 8 (1970) [22] S. Berthier, Optique des Milieux Composites (Polytechnica, Paris, 1993).
[23] R. Gerber, in Applied Magnetism (eds. R. Gerber et al., Kluwer Academic Publishers, 1994) [24] A. Yu. Zubarev and L. Yu. Iskakova, Phys. Rev. E 65, 061406 (2002)
[25] A.P. Hynninen and M. Dijkstra, Phys. Rev. Lett. 94, 138303 (2005) [26] H. Brenner, Int. J. Multiphase Flow 1, 195 (1974).
[27] L. D. Landau, and E.M. Lifshitz, Electrodynamics of Continuous Media (Pergamon, New York, 1984).