HAL Id: hal-02998152
https://hal.archives-ouvertes.fr/hal-02998152
Submitted on 23 Nov 2020HAL is a multi-disciplinary open access archive for the deposit and dissemination of sci-entific research documents, whether they are pub-lished or not. The documents may come from teaching and research institutions in France or abroad, or from public or private research centers.
L’archive ouverte pluridisciplinaire HAL, est destinée au dépôt et à la diffusion de documents scientifiques de niveau recherche, publiés ou non, émanant des établissements d’enseignement et de recherche français ou étrangers, des laboratoires publics ou privés.
Age-dependent phenological plasticity in a wild bird
Suzanne Bonamour, Luis-miguel Chevin, Denis Réale, Céline Teplitsky, Anne
Charmantier
To cite this version:
Suzanne Bonamour, Luis-miguel Chevin, Denis Réale, Céline Teplitsky, Anne Charmantier. Age-dependent phenological plasticity in a wild bird. Journal of Animal Ecology, Wiley, 2020, 89 (11), pp.2733-2741. �10.1111/1365-2656.13337�. �hal-02998152�
1
2
Age-dependent phenological plasticity in
3
a wild bird
4
Suzanne Bonamour1, Luis-Miguel Chevin1, Denis Réale2, Céline Teplitsky1* and Anne Charmantier1*
5 *Co-last authors 6 7 Author’s affiliation: 8
1 CEFE, Univ Montpellier, CNRS, EPHE, IRD, Univ Paul Valéry Montpellier 3, Montpellier, France.
9
2 Université du Québec à Montréal, Département des sciences biologiques, Case postale 8888,
10
succursale Centre-ville, Montréal (Québec), H3C 3P8, Canada. 11
12 13
Author for correspondence: 14 Suzanne Bonamour 15 E-mail: [email protected] 16 17 18
Abstract
191. Life-history traits are often plastic in response to environmental factors such as temperature or 20
precipitation, and they also vary with age in many species. Trait variation during the lifetime could thus 21
be partly driven by age-dependent plasticity in these traits. 22
2. We study whether plasticity of a phenological trait – the egg-laying date – with respect to spring 23
temperature, varies with age, and explore whether this variation relates to changes in breeding success 24
throughout the life cycle. 25
3. We use data from a four-decade long-term monitoring of a wild population of blue tits in Corsica to 26
estimate age-dependent plasticity of reproductive phenology and annual reproductive success. 27
4. We show that both laying date plasticity and annual reproductive success vary with age: young and 28
old females are less plastic, and fledge fewer offspring, than middle-age females. Furthermore, in 29
contrast to young and prime-age females, in old females fledging success does not depend on laying 30
date. 31
5. Phenological plasticity is a major mechanism for coping with rapid environmental variation. Our 32
results suggest that understanding its role in adaptation to climate change and population persistence 33
requires integrating the age structure of the population. 34
35 36
Key words: Phenotypic plasticity, Laying date, Phenology, Aging, Passerines, Wild birds 37
38 39
Introduction
40
Phenotypic plasticity – the capacity of a given genotype to express different phenotypes according to 41
environmental conditions (Pigliucci, 2001) – is a widespread phenomenon in nature (DeWitt & 42
Scheiner, 2004). Theoretical and empirical studies highlight the importance of phenotypic plasticity for 43
population persistence (e.g. Ashander et al., 2016; Chevin et al., 2010; Reed et al., 2011). When 44
plasticity is adaptive, it may allow the population mean phenotype to track an environment-dependent 45
phenotypic optimum, thus minimizing the impact of environmental change on mean fitness and 46
population growth. This is especially true for phenological traits, which determine the timing of key 47
life history events such as reproduction, dormancy/diapause, or dispersal, synchronizing these events 48
with the optimal timing set by a seasonal – and often also noisy – environment (e.g. Visser, 2008). 49
Phenological traits have been shown to represent a major phenotypic response to rapid climate change 50
(Davis et al., 2005; Parmesan & Yohe, 2003; Radchuk et al., 2019; Visser & Both, 2005; Walther et al., 51
2002). It is also increasingly clear that plastic changes contribute a large proportion of observed 52
phenotypic change in the wild (e.g. Gienapp et al., 2007; Merilä & Hendry, 2014; Walther et al., 2002), 53
especially for phenological traits (Anne Charmantier & Gienapp, 2014; Vedder et al., 2013). 54
Life-history traits (e.g. fecundity), in addition to often being phenotypically plastic, also vary 55
with age in many iteroparous species. Empirical studies in vertebrates commonly show patterns of 56
age-dependent reproductive performance, with increasing annual reproductive success in the 57
beginning of life, followed by maximal reproductive performance in middle age, and finally, a 58
decreasing success due to reproductive senescence (e.g. Balbontín et al., 2007; Clutton-Brock, 1988; 59
Dingemanse et al., 2020; Warner et al., 2016). Since plastic phenology is a strong driver of reproductive 60
performance in many species, notably in birds inhabiting temperate forests (e.g. Marrot et al., 2018; 61
Perrins & McCleery, 1989), it is likely that variation with age of phenological reaction norms underlies 62
age-dependent patterns in reproductive success to some extent. If reaction norms vary with age, then 63
understanding the role of plasticity in adaptation to rapid environmental change and population 64
persistence requires integrating the age structure of the population (see e.g. van de Pol et al., 2012). 65
Theoretical studies on the evolution of age-dependent plasticity are still rare. They have 66
focused so far on traits that are established once during development (developmental plasticity, 67
according to West-Eberhard, 2003) in binary environments, and predict a decrease of plasticity with 68
age (e.g. Fawcett & Frankenhuis, 2015; Fischer et al., 2014; Stamps & Krishnan, 2017). Formal 69
theoretical predictions are still missing for traits that change repeatedly in life (labile traits), and with 70
continuous expression under continuous environmental variation. But the general mechanisms 71
responsible for an effect of senescence on plasticity, such as the decrease of selection strength with 72
age (Charlesworth, 1993; Hamilton, 1966; Monaghan et al., 2008; Williams, 1957), should lead to a 73
similar decrease in plasticity as individuals get older. 74
Within-individual variation of plasticity over the lifetime of individuals has been highlighted in 75
some experimental studies, mainly in behavioural traits (e.g. Atwell & Wagner, 2014; Ericsson et al., 76
2016), with highest plasticity in juveniles or young adults followed by decreasing plasticity with age, 77
thus corroborating theoretical predictions. However, evidence is scarce for age-specific plasticity in 78
wild populations. Araya-Ajoy & Dingemanse (2016) compared the seasonal plasticity of aggressiveness 79
in great tits (Parus major) between two age classes, and found that first-year-old breeders showed 80
higher seasonal plasticity than older birds, also aligned with theoretical predictions. A study on 81
phenological trait plasticity in superb fairywrens (Malurus cyaneus) demonstrated that the variation 82
of moult timing with rainfall changed with age (van de Pol et al., 2012). Contrary to theoretical 83
predictions, in this study older birds were more plastic than younger ones. Overall, the scarce empirical 84
evidence means we still poorly understand the origin of age-dependent plasticity of labile phenotypic 85
traits over a lifetime. The study of age-specific variation in plasticity in wild populations is an arduous 86
task because of the combined challenges of studying phenotypic plasticity and senescence (Nussey et 87
al., 2013; Nussey, Wilson, et al., 2007), both of which demand a long-term study with individual 88
marking and repeated measures on the same individuals. In addition, plasticity estimation requires 89
identifying the main environmental cue(s) explaining within-individual phenotypic variation (Gienapp, 90
2018). These challenges explain why age-specific variation of plasticity has been widely neglected so 91
far in empirical studies. 92
We studied age-specific plasticity of a phenological trait, the egg-laying date, in a wild blue tit 93
population. We used linear mixed models to explore the relationship between age-related plasticity 94
and annual reproductive success across female lifetime. In this species, as in most temperate 95
passerines, laying date varies plastically among years in response to spring temperature (e.g. Porlier et 96
al., 2012). This variation allows birds to synchronize their reproductive period with the timing of 97
maximal abundance of caterpillars, which constitute the main nutritive resource for nestlings (Blondel 98
et al., 1991). Annual reproductive performances also vary with age in blue tits: young birds have low 99
annual reproductive success (partially) due to inexperience (Gienapp & Brommer, 2014), while old 100
individuals suffer from reproductive senescence (Auld & Charmantier, 2011). As a result, reproductive 101
success increases and then decreases with age, with most traits peaking around 3 years of age. Since 102
laying date is a plastic trait in response to temperature, age-related variation of reproductive timing 103
and annual reproductive success could be associated with age-specific laying date plasticity with 104
temperature. We expected a nonlinear variation of laying date plasticity with age. Plasticity should first 105
increase in the early years of life, because of maturation and learning processes as suggested by an 106
empirical study of Grieco et al. (2002). It should then decrease in old ages, because senescence is 107
generally expected to lead to an overall decrease in performance. We expected similar quadratic age-108
specific variation in reproductive success. 109
Materials & Methods
110
Species and data collection
111
We used a long-term study (initiated by Jacques Blondel in 1975) of a wild Mediterranean population 112
of Blue tit (Cyanistes caeruleus ogliastrae), a small insectivorous and cavity-nesting passerine. Breeding 113
dates were collected every spring on the study site. The population is on the island of Corsica, in an 114
evergreen forest (E-Pirio population, 42°34'N, 08°44'E) dominated by holm oaks (Quercus ilex) (see 115
reviews on the long-term study in Blondel et al., 2006; Charmantier et al., 2016). Blue tits bred in 205 116
nest boxes (natural cavities are rare in this forest, Charmantier, pers. com.), which were monitored 117
weekly from March to June to record laying date, clutch size and reproductive success. Breeding birds 118
and nestlings were individually marked with a unique numbered metal ring. 119
We restricted our analyses to first broods of the season only (second broods represent less 120
than c. 1% of the clutches). Age was estimated based on birth year for individuals born in nest boxes, 121
or on plumage patterns for immigrants (see Supporting Information 1 Figure S1 for the number of 122
females in each age class). Based on plumage patterns, captured immigrant females can be classified 123
either as one year old (juvenile plumage), or two years or older (mature plumage pattern). In the 124
present dataset, the exact age was known for c. 60% of females (corresponding to locally born and 125
immigrant females first captured at one year old), while we used minimum age for the remaining 40% 126
(corresponding to immigrant females first captured at two years or older). Dispersal in blue tits mainly 127
happens before the first breeding event (i.e. natal dispersal, Greenwood & Harvey, 1982; Matthysen 128
et al., 2010), and the mortality rate in the focal population was high (about half of the individuals in 129
each age class die every year, Dubuc-Messier et al., 2016). Hence the recruitment in the focal nest-box 130
area of birds older than two years was likely to be uncommon (see Supporting Information 1 Figure 131
S1). This suggests that allocating a minimum age of two years to immigrant females displaying adult 132
plumage should lead to a low error rate in age estimation, as we confirmed by a sensitivity analysis 133
(see Supporting Information 2). 134
Overall, the dataset contained 1696 laying date observations from 1976 to 2017, for 854 135
identified females (Supporting Information 1 Figure S1 and Table S1, Bonamour et al., 2020). The 136
temperature cue was the average daily temperature between 31st March and 7th May, which is the
period most correlated with inter-annual laying date variation at the population scale according to 138
sliding-window analyses (Bonamour et al., 2019). 139
Statistical analyses
140
We estimated age-dependent laying date plasticity in response to temperature using the following 141
linear mixed model (e.g. Nussey, Kruuk, et al., 2007), 142 143 𝐿𝐷𝑖𝑗 = µ + 𝛼1𝑇𝑗+ 𝛼2𝐴𝑖𝑗+ 𝛼3𝐴2𝑖𝑗+ 𝛼4(𝑇𝑗𝐴𝑖𝑗) + 𝛼5(𝑇𝑗𝐴2𝑖𝑗) + 𝛼6𝐴𝐿𝑅𝑖+ 𝑖𝑛𝑑𝑖+ 𝑦𝑒𝑎𝑟𝑗+ 𝜀𝑖𝑗 (model 144 1) 145 146
where the laying date 𝐿𝐷 (1 = 1st January) of female 𝑖 in year 𝑗 is explained by several fixed effects: cue
147
temperature 𝑇𝑗 of year 𝑗 (temperature was mean-centered across years), age 𝐴𝑖𝑗 and age-squared 𝐴𝑖𝑗2
148
of female 𝑖 in year 𝑗 (with age a continuous variable ranking from 1 to 9 years old). The terms 𝑇𝑗𝐴𝑖𝑗
149
and 𝑇𝑗𝐴𝑖𝑗2 are interactions estimating respectively the linear and quadratic age dependence of plasticity
150
in laying date with temperature. We controlled for female longevity by adding an effect of age at last 151
reproduction of female 𝑖, 𝐴𝐿𝑅𝑖, modelling a selective disappearance effect on laying date variation
152
(e.g. Bouwhuis et al., 2009). To account for the non-independence of data collected on the same 153
female and the same year, we included female identity (𝑖𝑛𝑑𝑖) and year (𝑦𝑒𝑎𝑟𝑗) as random effects. The
154
final term in model 1 is the residual error term 𝜀𝑖𝑗. Avian laying date is expressed by females, but can
155
also be seen as a trait shared by the two sexes as some male characteristics may influence the timing 156
of reproduction (e.g. Brommer & Rattiste, 2008). However, in this population, a previous analysis 157
detected no effect of male identity on breeding time (Auld & Charmantier, 2011) and we thus 158
restricted analyses to female birds. We also confirmed that there was no difference between the 159
population- and individual-level plasticity (i.e. variation in laying date with temperature was not driven 160
by between-female differences in reaction norm intercept across years), using the within-subject 161
centering method (Supporting Information 3; van de Pol & Wright, 2009). 162
We estimated the effects of age and laying date on annual reproductive success 𝐴𝑅𝑆 163
(approximated as the number of fledglings per breeding attempt) using the following generalized 164
linear mixed model, 165
166
𝐴𝑅𝑆𝑖𝑗= 𝛾 + 𝛽1𝐴𝑖𝑗+ 𝛽2𝐴𝑖𝑗2 + 𝛽3𝐿𝐷𝑖𝑗+ 𝛽4(𝐴𝑖𝑗𝐿𝐷𝑖𝑗) + 𝑖𝑛𝑑𝑖+ 𝑦𝑒𝑎𝑟𝑗+ 𝑟𝑖𝑗 (model 2)
167 168
where annual reproductive success 𝐴𝑅𝑆𝑖𝑗 of female 𝑖 in year 𝑗 is explained by the female age 𝐴𝑖𝑗 and
169
age-square 𝐴𝑖𝑗2, the laying date 𝐿𝐷𝑖𝑗 and the interaction between laying date and age (𝐴𝑖𝑗𝐿𝐷𝑖𝑗). We
170
included two random effects, female identity (𝑖𝑛𝑑𝑖) and year (𝑦𝑒𝑎𝑟𝑗), and 𝑟𝑖𝑗 are residuals. Annual
171
reproductive success was not normally distributed (see Supporting Information 1 Figure S2), we thus 172
ran the model as a generalized linear mixed model with a Poisson distribution. Females with clutch 173
manipulation and all other experiments that could affect reproductive success were removed from the 174
data set for model 2, reducing the dataset to 1092 laying date observations for 667 identified females. 175
All statistical analyses were carried out using the software R (version 3.3.2, R Core Team, 2016), 176
and performed in a Bayesian framework using a Markov Chain Monte Carlo estimation algorithm (R 177
package MCMCglmm, Hadfield, 2010). For all random effects (including the residual variance), we used 178
a weakly informative prior, corresponding to an inverse-Wishart 𝑊−1(𝜓, 𝜈) distribution with 𝜓 equal 179
to the phenotypic variance of laying date (or 𝐴𝑅𝑆 variance, depending on the model 1 or 2) divided by 180
the number of estimated variance components. 𝜈 is the degree of belief in the prior and we tested the 181
robustness of results to the prior specification using 𝜈 = 1, 0.2 or 0.02. The default Gaussian non-182
informative prior in MCMCglmm with mean zero and variance 108 was used for the fixed effects.
183
Models were run for 1,010,000 iterations, including a burn-in period of 10,000 iterations. We ran three 184
chains which were sampled every 1000 iteration to avoid autocorrelation. The maximum 185
autocorrelation between estimates was < 0.05 for fixed and random effects. Convergence of chains 186
was tested using Gelman and Rubin’s convergence diagnostic (Brooks & Gelman, 1998; Gelman & 187
Rubin, 1992) and models converged well, with average Gelman’s diagnostic 𝑅̂ = 1.00 for fixed and 188
random effects, comparing chains from different priors. 189
Results
190
Laying date varied within a female’s lifetime, in response to both temperature and age (Table 1). Laying 191
date was earlier with warmer springs, with a median value of c. 3 days earlier every 1°C warmer (Table 192
1, Figure 1a&b). It also varied non-linearly with age, decreasing until age 4 and then increasing (Table 193
1, Figure 1a&c). Our results suggested that shorter-lived females tend to breed later, but note that the 194
95% credible interval in the posterior distribution of the 𝐴𝑅𝑆 marginally included zero (Table 1, but 195
see Supporting Information 2 Table S3). 196
We also found age-dependent plasticity in reproductive phenology. The response of laying 197
date to temperature changed with age, as evidenced by the interaction between temperature and the 198
linear age effect (Table 1). This resulted in reaction norm slopes getting steeper as female age 199
increased, until c. 5 years old (Figure 1b&c). In addition, our results suggested that plasticity declines 200
for older females (after 6 years old, Figure 1c); however small sample sizes for these late age classes 201
resulted in large credible intervals (Table 1, Supporting Information 1 Figure S1). The largest difference 202
in reaction norm slopes was between 1 year-old (i.e. yearling) and 5 year-old females: the estimated 203
median slope of laying date reaction norm with respect to temperature was -3.68 days/°C (± 0.002, p-204
value <2.10^16) for yearlings, and -4.94 days/°C (± 0.001, p-value <2.10^16) for 5 year-old females 205
(Figure 1b), leading to a median difference of c. 1.5 days/°C between both age classes. 206
Annual reproductive success also varied with female age (Table 2). Model 2 revealed a 207
quadratic relationship between annual reproductive success and age, such that young and especially 208
old females displayed lower annual reproductive success than middle-age females (Table 2, Figure 2a). 209
Annual reproductive success also decreased with laying date (Table 2, Figure 2b). There was no 210
statistical evidence for an interaction between age and laying date (Table 2; preliminary analyses 211
showed no evidence for an interaction between laying date and age-squared). Importantly, the 212
relationship between laying date and reproductive success was negative for all ages except for females 213
older than 5 years old (Figure 2b). Hence, despite low statistical power in old age classes (Supporting 214
Information 1 Figure S1), these results suggest that reproductive success in old females was low 215
independently of their laying date. 216
Discussion
217
To our knowledge, our study is the first to report age-dependent phenotypic plasticity of laying date 218
with temperature. Laying date plasticity with spring temperature is a common pattern observed in 219
many avian natural populations (e.g. Dunn, 2004; Visser et al., 2009). In temperate regions, this 220
plasticity causes among-year variation in phenology, which allows synchronization between predators 221
(birds) and their preys (in particular caterpillars, see e.g. Dunn, 2004; Van Noordwijk et al., 1995). 222
Laying date variation with female age is likewise a well-known pattern in free-living as well as in 223
controlled iteroparous animal populations (e.g. Auld & Charmantier, 2011; Nussey et al., 2008), 224
although the senescent delay in avian breeding phenology was only revealed in the last two decades. 225
Similarly to previous investigations (Auld & Charmantier, 2011), model 1 shows that young and old 226
females lay later than middle-age birds (Table 1, Figure 1). 227
More importantly, model 1 also reveals changes in plasticity with age. The age dependence of 228
laying date reaction norms is complex, as both the slope and intercept vary with female age (Table 1, 229
Figure 1). This leads to a pattern whereby young and old females lay later on average (i.e. higher 230
median reaction norm intercept), and the age-dependent reaction norm slope accentuates the 231
phenological delay between young or old and middle-age females (Figure 1). For instance, in warm 232
springs with temperature 1.5 °C higher than average, the resulting median laying date is ≈ 5 days earlier 233
in 5-year-old than 1-year-old females (Figure 1b). This difference among age classes represents about 234
13% of the total phenotypic range in laying date in the entire dataset (c. 39 days), while the among-235
individual (averaged across years and environments) and among-year effects explain respectively 236
about 28% (c. 11 days) and 36% (c. 14 days) of this range. 237
Under current environmental conditions, age-dependent laying date plasticity should not have 238
extensive impacts on population dynamics and persistence in our short-lived passerine population, 239
because females of 5 years and older represent only 8% of the total population (Supporting 240
Information 1 Figure S1 and population annual adult survival probability of c. 0.5, Dubuc-Messier et 241
al., 2016). However, warmer springs in the future should lead to higher among-individual variation of 242
laying date, as the influence of age-dependent plasticity on laying date variation becomes more 243
marked (assuming no evolutionary change of laying date reaction norm). 244
Our results seem consistent with theoretical models of age-dependent plasticity (e.g. Fawcett 245
& Frankenhuis, 2015; Fischer et al., 2014; Stamps & Krishnan, 2017) despite substantial differences 246
between our blue tit biological model and some assumptions of the theoretical models. As predicted 247
by theoretical studies, plasticity decreased at old ages in our study population. However, the pattern 248
was complex, as we observed quadratic variation of both laying date plasticity (Table 1, Figure 1) and 249
annual reproductive success (Table 2, Figure 2). From a more mechanistic perspective, Fawcett & 250
Frankenhuis (2015) highlight that age-dependent plasticity will evolve if there is variation across the 251
lifetime of either i) cue reliability, ii) the relationship between fitness and the plastic response, or iii) 252
constraints on the expression of phenotypic plasticity. First, we have no a priori reason to expect 253
changes in cue reliability with female blue tit age: spring temperature should predict the caterpillar 254
peak date independently of female age. However, the physiological ability to detect environmental 255
cues such as temperature (Caro et al., 2013; Visser et al., 2009) or photoperiod (Dawson, 2008) may 256
change with age. This could explain age-dependent plasticity, since the optimal reaction norm slope 257
increases as a function of cue reliability (Gavrilets & Scheiner, 1993), but little is known about changes 258
in perception abilities with age in birds. Second, the fitness benefits associated with laying date 259
plasticity may vary during female lifetime. For example, their foraging capacity may increase with age, 260
leading to a reduced importance – for annual reproductive success – of the synchronisation between 261
the peak of nutritive resources and bird reproductive timing in older females. In our population, such 262
age-dependent fitness benefits of plasticity could not explain the increasing plasticity before 5 years 263
old. However, the fitness advantage of earlier breeding seems to decrease in old ages (Figure 2b), 264
which could lead to lower fitness benefits to being plastic and induce selection for reduced (assumed 265
costly) plastic capacity in old female birds. Third, a learning process of plasticity early in life may explain 266
variation in laying date plasticity. Grieco et al. (2002) showed that blue tits laid in the same period as 267
their previous breeding season if they were supplied with additional food, but they laid earlier if they 268
were short of nutritive resources. Such a pattern may explain increasing plasticity in young females, 269
especially following warmer springs, when the caterpillar peak is earlier than the average. Finally, 270
plasticity is expected to require resources, especially to acquire information to track environmental 271
changes (Dewitt, 1998), which may lead to constraints on plastic capacity. Hence, yearlings may not 272
have accumulated enough resources during their first winter to adequately modulate their laying date 273
according to temperature, again especially in warmer years when breeding phenology is optimally 274
early. In the same vein, old females suffering from reproductive senescence may not be able to display 275
steeper plasticity because of lack of resources. Further investigations on the physiological conditions 276
of young and old females are needed to better understand proximal causes of age-dependent 277
plasticity. 278
To evaluate the fitness costs of a late laying date, which partially depends on a lack of plastic 279
response to temperature, we analysed the relationships between laying date, age and a fitness 280
component. We used an estimate of annual reproductive success – the number of fledglings – as 281
fitness component. Results from model 2 and Figure 2 show that breeding too late decreases annual 282
reproductive success for young and middle-age females but not for the oldest birds. In other words, 283
plasticity of laying date, has no consequences on reproductive success of old females. This suggests 284
that selection for plasticity could decrease with age in this population. Exploring whether the selection 285
on laying date reaction norms changes with age, including the possibility that selection on laying date 286
across environments (i.e. selection depending on temperature) causes indirect selection on its 287
plasticity (e.g. Ramakers et al., 2018; van Tienderen & Koelewijn, 1994) is an exciting perspective. 288
However, such a study would require a data set much larger than ours based on 42 years of monitoring. 289
A full understanding of these complex relationships between laying date, age and fitness would also 290
require to investigate selection beyond fledging (e.g. through recruitment success) but also including 291
lifetime reproductive success and/or survival, to integrate the potential fecundity-survival trade-offs. 292
Conclusion and perspectives
293
To conclude, this study reveals age-dependent plasticity of laying date in response to spring 294
temperature in a wild blue tit population. Young and old females were less plastic than middle-aged 295
females. Our results suggest that, unlike prime-age females, young females may have not reached their 296
full reproductive capacities, while the older ones may no longer be subject to natural selection on 297
laying date. Such age-dependent effects result in a quadratic variation of laying date plasticity. 298
Considering the importance of plastic responses for population persistence in a rapidly changing world 299
(Chevin et al., 2013; Reed et al., 2010), within-individual variability of plasticity has to be taken into 300
account in studies of plasticity in the wild. Models of age-structured populations could help to 301
comprehend how age-related plasticity impacts adaptation and population persistence. As chronic 302
stress is known to speed up senescence (Hayward et al., 2009; Monaghan et al., 2008; Ricklefs, 2008), 303
current global change could increase variation of plasticity with age, and its impact could be even 304
stronger for phenological traits for which plasticity is an important component of response to climate 305
change (Davis et al., 2005; Parmesan & Yohe, 2003; Radchuk et al., 2019; Visser & Both, 2005; Walther 306
et al., 2002). We suggest that age-specific phenological plasticity should be studied in other systems, 307
particularly in long-lived species, to get a fuller understanding of the importance of within-individual 308
variation in plasticity for population persistence in nature. 309
References
310
Araya-Ajoy, Y. G., & Dingemanse, N. J. (2016). Repeatability, heritability, and age-dependence in the 311
aggressiveness reaction norms of a wild passerine bird. Journal of Animal Ecology, 227–238. 312
https://doi.org/10.1111/1365-2656.12621 313
Ashander, J., Chevin, L.-M., & Baskett, M. L. (2016). Predicting evolutionary rescue via evolving 314
plasticity in stochastic environments. Proceedings of the Royal Society B: Biological Sciences, 315
283(1839), 20161690. https://doi.org/10.1098/rspb.2016.1690 316
Atwell, A., & Wagner, W. E. (2014). Female mate choice plasticity is affected by the interaction 317
between male density and female age in a field cricket. Animal Behaviour, 98, 177–183. 318
https://doi.org/10.1016/j.anbehav.2014.10.007 319
Auld, J. R., & Charmantier, A. (2011). Life history of breeding partners alters age-related changes of 320
reproductive traits in a natural population of blue tits. Oikos, 120(8), 1129–1138. 321
https://doi.org/10.1111/j.1600-0706.2010.19161.x 322
Balbontín, J., Hermosell, I. G., Marzal, A., Reviriego, M., De Lope, F., & Møller, A. P. (2007). Age-323
related change in breeding performance in early life is associated with an increase in 324
competence in the migratory barn swallow Hirundo rustica. Journal of Animal Ecology, 76(5), 325
915–925. https://doi.org/10.1111/j.1365-2656.2007.01269.x 326
Blondel, J., Dervieux, A., Maistre, M., & Perret, P. (1991). Feeding ecology and life history variation of 327
the blue tit in Mediterranean deciduous and sclerophyllous habitats. Oecologia, 88(1), 9–14. 328
http://link.springer.com/article/10.1007/BF00328397 329
Blondel, J., Thomas, D. W., Charmantier, A., Perret, P., Bourgault, P., & Lambrechts, M. M. (2006). A 330
thirty-year study of phenotypic and genetic variation of blue tits in mediterranean habitat 331
mosaics. BioScience, 56(8), 661. https://doi.org/10.1641/0006-332
3568(2006)56[661:ATSOPA]2.0.CO;2 333
Bonamour, S., Chevin, L., Charmantier, A., & Teplitsky, C. (2019). Phenotypic plasticity in response to 334
climate change : the importance of cue variation. Philosophical Transactions of the Royal 335
Society B, 374: 20180178. https://doi.org/http://dx.doi.org/10.1098/rstb.2018.0178 336
Bonamour, S., Réale, D., Chevin, L., Teplitsky, C., & Charmantier, A. (2020). Data from: Age-337
dependent phenological plasticity in a wild bird. Journal of Animal Ecology. 338
https://doi.org/10.5061/dryad.msbcc2fw8 339
Bouwhuis, S., Sheldon, B. C., Verhulst, S., & Charmantier, A. (2009). Great tits growing old: selective 340
disappearance and the partitioning of senescence to stages within the breeding cycle. 341
Proceedings of the Royal Society B: Biological Sciences, 276(1668), 2769–2777. 342
https://doi.org/10.1098/rspb.2009.0457 343
Brommer, J. E., & Rattiste, K. (2008). “Hidden” reproductive conflict between mates in a wild bird 344
population. Evolution, 62(9), 2326–2333. https://doi.org/10.1111/j.1558-5646.2008.00451.x 345
Brooks, S. P., & Gelman, A. (1998). General methods for monitoring convergence of iterative 346
simulations. Journal of Computational and Graphical Statistics, 7(4), 434–455. 347
Caro, S. P., Schaper, S. V., Hut, R. A., Ball, G. F., & Visser, M. E. (2013). The case of the missing 348
mechanism: how does temperature influence seasonal timing in endotherms? PLoS Biology, 349
11(4). https://doi.org/10.1371/journal.pbio.1001517 350
Charlesworth, B. (1993). Evolutionary mechanisms of senescence. Genetica, 91(1–3), 11–19. 351
Charmantier, Anne, Doutrelant, C., Dubuc-Messier, G., Fargevieille, A., & Szulkin, M. (2016). 352
Mediterranean blue tits as a case study of local adaptation. Evolutionary Applications, 9(1), 353
135–152. https://doi.org/10.1111/eva.12282 354
Charmantier, Anne, & Gienapp, P. (2014). Climate change and timing of avian breeding and 355
migration: evolutionary versus plastic changes. Evolutionary Applications, 7(1), 15–28. 356
https://doi.org/doi:10.1111/eva.12126 357
Chevin, L.-M., Gallet, R., Gomulkiewicz, R., Holt, R. D., & Fellous, S. (2013). Phenotypic plasticity in 358
evolutionary rescue experiments. Philosophical Transactions of the Royal Society of London. 359
Series B, Biological Sciences, 368(1610), 20120089. https://doi.org/10.1098/rstb.2012.0089 360
Chevin, L.-M., Lande, R., & Mace, G. M. (2010). Adaptation, plasticity, and extinction in a changing 361
environment: towards a predictive theory. PLoS Biology, 8(4), e1000357. 362
https://doi.org/10.1371/journal.pbio.1000357 363
Clutton-Brock, T. H. (1988). Reproductive success: studies of individual variation in contrasting 364
breeding systems. (University). 365
Davis, M. B., Shaw, R. G., & Etterson, J. R. (2005). Evolutionary responses to changing climate. 366
Ecology, 86(7), 1704–1714. https://doi.org/https://doi.org/10.1890/03-0788 367
Dawson, A. (2008). Control of the annual cycle in birds: Endocrine constraints and plasticity in 368
response to ecological variability. Philosophical Transactions of the Royal Society B: Biological 369
Sciences, 363(1497), 1621–1633. https://doi.org/10.1098/rstb.2007.0004 370
Dewitt, T. J. (1998). Costs and limits of phenotypic plasticity : Tests with morphology and life history 371
in a freshwater snail. Journal of Evolutionary Biology, 11, 465–480. 372
https://doi.org/https://doi.org/10.1046/j.1420-9101.1998.11040465.x 373
DeWitt, T. J., & Scheiner, S. M. (2004). Phenotypic plasticity: Functional and conceptual approaches 374
(T. J. DeWitt & S. M. Scheiner (eds.)). Oxford University Press. 375
Dingemanse, N. J., Moiron, M., Araya-Ajoy, Y. G., Mouchet, A., & Abbey-Lee, R. N. (2020). Individual 376
variation in age-dependent reproduction: Fast explorers live fast but senesce young? Journal of 377
Animal Ecology, 89(2), 601–613. https://doi.org/10.1111/1365-2656.13122 378
Dubuc-Messier, G., Réale, D., Perret, P., & Charmantier, A. (2016). Environmental heterogeneity and 379
population differences in blue tits personality traits. Behavioral Ecology, 00(00), 1–12. 380
https://doi.org/10.1093/beheco/arw148 381
Dunn, P. (2004). Breeding dates and reproductive performance. Advances in Ecological Research, 382
35(04), 69–87. https://doi.org/10.1016/S0065-2504(04)35004-X 383
Ericsson, M., Henriksen, R., Bélteky, J., & Sundman, A. (2016). Long-term and transgenerational 384
effects of stress experienced during different life phases in chickens (Gallus gallus). PLoS ONE, 385
11(4), 9–12. https://doi.org/10.1371/journal.pone.0153879 386
Fawcett, T. W., & Frankenhuis, W. E. (2015). Adaptive explanations for sensitive windows in 387
development. Frontiers in Zoology, 12(Suppl 1), 1–14. 388
Fischer, B., van Doorn, G. S., Dieckmann, U., & Taborsky, B. (2014). The evolution of age-dependent 389
plasticity. The American Naturalist, 183(1), 108–125. https://doi.org/10.1086/674008 390
Gavrilets, S., & Scheiner, S. M. (1993). The genetics of phenotypic of reaction norm shape V . 391
Evolution of reaction norm shape. Journal of Evolutionary Biology, 6, 31–48. 392
Gelman, A., & Rubin, D. B. (1992). Inference from iterative simulation using multiple sequences. 393
Statistical Science, 7(4), 457–511. 394
Gienapp, P. (2018). The choice of the environmental covariate affects the power to detect variation 395
in reaction norm slopes. BioRxiv, 1–19. https://doi.org/10.1101/311217 396
Gienapp, P., & Brommer, J. E. (2014). Evolutionary dynamics in response to climate change. In A 397
Charmantier, D. Garant, & L. Kruuk (Eds.), Quantitative genetics in the wild (pp. 254–272). 398
Oxford University Press. 399
Gienapp, P., Teplitsky, C., Alho, J. S., Mills, J. A., & Merilä, J. (2007). Climate change and evolution: 400
Disentangling environmental and genetic responses. Molecular Ecology, 17(1), 167–178. 401
https://doi.org/10.1111/j.1365-294X.2007.03413.x 402
Greenwood, P. J., & Harvey, P. H. (1982). The natal and breeding dispersal of birds. Annual Review of 403
Ecology and Systematics. Volume 13, 1–21. 404
Grieco, F., van Noordwijk, A. J., & Visser, M. E. (2002). Evidence for the effect of learning on timing of 405
reproduction in blue tits. Science, 296(April), 136–138. 406
https://doi.org/10.1126/science.1068287 407
Hadfield, J. (2010). MCMC Methods for Multi-Response Generalized Linear Mixed Models: The 408
MCMCglmm R Package. Journal of Statistical Software, 33(2), 1–22. 409
Hamilton, W. D. (1966). The moulding of senescence by natural selection. Journal of Theoretical 410
Biology, 12(1), 12–45. https://doi.org/10.1016/0022-5193(66)90184-6 411
Hayward, A. D., Wilson, A. J., Pilkington, J. G., Pemberton, J. M., & Kruuk, L. E. B. (2009). Ageing in a 412
variable habitat: environmental stress affects senescence in parasite resistance in St Kilda Soay 413
sheep. Proceedings of the Royal Society B: Biological Sciences, 276(1672), 3477–3485. 414
https://doi.org/10.1098/rspb.2009.0906 415
Marrot, P., Charmantier, A., Blondel, J., & Garant, D. (2018). Current Spring Warming as a Driver of 416
Selection on Reproductive Timing in a Wild Passerine. Journal of Animal Ecology, May 2016, 1– 417
11. https://doi.org/10.1111/ijlh.12426 418
Matthysen, E., van Overveld, T., van de Casteele, T., & Adriaensen, F. (2010). Family movements 419
before independence influence natal dispersal in a territorial songbird. Oecologia, 162(3), 591– 420
597. https://doi.org/10.1007/s00442-009-1483-x 421
Merilä, J., & Hendry, A. P. (2014). Climate change, adaptation, and phenotypic plasticity: The problem 422
and the evidence. Evolutionary Applications, 7(1), 1–14. https://doi.org/10.1111/eva.12137 423
Monaghan, P., Charmantier, A., Nussey, D. H., & Ricklefs, R. E. (2008). The evolutionary ecology of 424
senescence. Functional Ecology, 22(3), 371–378. https://doi.org/10.1111/j.1365-425
2435.2008.01418.x 426
Nussey, D. H., Coulson, T., Festa-Bianchet, M., & Gaillard, J. M. (2008). Measuring senescence in wild 427
animal populations: Towards a longitudinal approach. Functional Ecology, 22(3), 393–406. 428
https://doi.org/10.1111/j.1365-2435.2008.01408.x 429
Nussey, D. H., Froy, H., Lemaitre, J. F., Gaillard, J. M., & Austad, S. N. (2013). Senescence in natural 430
populations of animals: Widespread evidence and its implications for bio-gerontology. Ageing 431
Research Reviews, 12(1), 214–225. https://doi.org/10.1016/j.arr.2012.07.004 432
Nussey, D. H., Kruuk, L. E. B., Morris, A., & Clutton-Brock, T. H. (2007). Environmental conditions in 433
early life influence ageing rates in a wild population of red deer. Current Biology, 17(23), 1000– 434
1001. https://doi.org/10.1016/j.cub.2007.10.005 435
Nussey, D. H., Wilson, A. J., & Brommer, J. E. (2007). The evolutionary ecology of individual 436
phenotypic plasticity in wild populations. Journal of Evolutionary Biology, 20(3), 831–844. 437
https://doi.org/10.1111/j.1420-9101.2007.01300.x 438
Parmesan, C., & Yohe, G. (2003). A globally coherent fingerprint of climate change impacts across 439
natural systems. Nature, 421(6918), 37–42. https://doi.org/10.1038/nature01286 440
Perrins, C. M., & McCleery, R. H. (1989). Laying date and clutch size in the great tit. Wilson Bulletin, 441
101(2), 236–253. http://elibrary.unm.edu/sora/Wilson/v101n02/p0236-p0253.pdf 442
Pigliucci, M. (2001). Phenotypic plasticity: beyond nature and nurture (John Hopkins University Press 443
(ed.)). 444
Porlier, M., Charmantier, A., Bourgault, P., Perret, P., Blondel, J., & Garant, D. (2012). Variation in 445
phenotypic plasticity and selection patterns in blue tit breeding time: Between- and within-446
population comparisons. Journal of Animal Ecology, 81(5), 1041–1051. 447
https://doi.org/10.1111/j.1365-2656.2012.01996.x 448
Radchuk, V., Reed, T., Teplitsky, C., van de Pol, M., Charmantier, A., Hassall, C., Adamík, P., 449
Adriaensen, F., Ahola, M. P., Arcese, P., Miguel Avilés, J., Balbontin, J., Berg, K. S., Borras, A., 450
Burthe, S., Clobert, J., Dehnhard, N., de Lope, F., Dhondt, A. A., … Kramer-Schadt, S. (2019). 451
Adaptive responses of animals to climate change are most likely insufficient. Nature 452
Communications, 10(1), 3109. https://doi.org/10.1038/s41467-019-10924-4 453
Ramakers, J. J. C., Gienapp, P., & Visser, M. E. (2018). Phenological mismatch drives selection on 454
elevation, but not on slope, of breeding time plasticity in a wild songbird. Evolution, 175–187. 455
https://doi.org/10.1111/evo.13660 456
Reed, T. E., Schindler, D. E., & Waples, R. S. (2011). Integrating effects of phenotypic plasticity and 457
evolution on population persistence in a changing climate. Conservation Biology, 25(1), 56–63. 458
https://doi.org/10.1111/j.1523-1739.2010.01552.x 459
Reed, T. E., Waples, R. S., Schindler, D. E., Hard, J. J., & Kinnison, M. T. (2010). Phenotypic plasticity 460
and population viability: the importance of environmental predictability. Proceedings of the 461
Royal Society B: Biological Sciences, 277(1699), 3391–3400. 462
https://doi.org/10.1098/rspb.2010.0771 463
Ricklefs, R. E. (2008). The evolution of senescence from a comparative perspective. Functional 464
Ecology, 22(3), 379–392. https://doi.org/10.1111/j.1365-2435.2008.01420.x 465
Stamps, J. A., & Krishnan, V. V. (2017). Age-dependent changes in behavioural plasticity: insights from 466
Bayesian models of development. Animal Behaviour, 126, 53–67. 467
https://doi.org/10.1016/j.anbehav.2017.01.013 468
van de Pol, M., Osmond, H. L., & Cockburn, A. (2012). Fluctuations in population composition 469
dampen the impact of phenotypic plasticity on trait dynamics in superb fairy-wrens. Journal of 470
Animal Ecology, 81(2), 411–422. https://doi.org/10.1111/j.1365-2656.2011.01919.x 471
van de Pol, M., & Wright, J. (2009). A simple method for distinguishing within- versus between-472
subject effects using mixed models. Animal Behaviour, 77(3), 753–758. 473
https://doi.org/10.1016/j.anbehav.2008.11.006 474
Van Noordwijk, A. J., McCleery, R. H., & Perrins, C. M. (1995). Selection for the timing of great tit 475
breeding in relation to caterpillar growth and temperature. Journal of Animal Ecology, 64(4), 476
451–458. 477
van Tienderen, P. H., & Koelewijn, H. P. (1994). Selection on reaction norms, genetic correlations and 478
constraints. Genet. Res., Camb., 64, 115–125. 479
Vedder, O., Bouwhuis, S., & Sheldon, B. C. (2013). Quantitative assessment of the importance of 480
phenotypic plasticity in adaptation to climate change in wild bird populations. PLoS Biology, 481
11(7), 1–10. https://doi.org/10.1371/journal.pbio.1001605 482
Visser, M. E. (2008). Keeping up with a warming world; assessing the rate of adaptation to climate 483
change. Proceedings of the Royal Society B: Biological Sciences, 275(1635), 649. 484
https://doi.org/10.1098/rspb.2007.0997 485
Visser, M. E., & Both, C. (2005). Shifts in phenology due to global climate change: the need for a 486
yardstick. Proceedings of the Royal Society B: Biological Sciences, 272(1581), 2561–2569. 487
https://doi.org/10.1098/rspb.2005.3356 488
Visser, M. E., Holleman, L. J. M., & Caro, S. P. (2009). Temperature has a causal effect on avian timing 489
of reproduction. Proceedings of the Royal Society B: Biological Sciences, 276(1665), 2323–2331. 490
https://doi.org/10.1098/rspb.2009.0213 491
Walther, G. R., Post, E., Convey, P., Menzel, A., Parmesan, C., Beebee, T. J. C., Fromentin, J. M., 492
Hoegh-Guldberg, O., & Bairlein, F. (2002). Ecological responses to recent climate change. 493
Nature, 416(6879), 389–395. https://doi.org/10.1038/416389a 494
Warner, D. A., Miller, D. A. W., Bronikowski, A. M., & Janzen, F. J. (2016). Decades of field data reveal 495
that turtles senesce in the wild. PNAS, 113(23). https://doi.org/10.1073/pnas.1600035113 496
West-Eberhard, M. J. (2003). Developmental plasticity and evolution (Oxford Uni). 497
Williams, G. C. (1957). Pleiotropy, natural selection, and the evolution of senescence. Evolution, 498
11(4), 398–411. 499
Ethics
500
All experimental protocols described here were approved by the ethics committee for animal 501
experimentation of Languedoc Roussillon (305-CEEA-LR-12066 approved in 2012 and 2018) as well as 502
by Regional Institutions (bylaw issued by the Prefecture on 08/12/2015 n° 2015-491). Captures and 503
bird ringing were performed under a personal ringing permit delivered by the CRBPO (Centre de 504
Recherches par le Baguage des Populations d'Oiseaux) to Anne Charmantier (ringing permit number 505
1907). 506
Data accessibility
507
Data available from the Dryad Digital Repository: https://doi.org/10.5061/dryad.msbcc2fw8 508
Author’s contributions
509
C.T., A.C., L.-M.C. and S.B. designed the research. A.C., C.T. and S.B. (and many other contributors) 510
collected field data. S.B. conducted statistical analyses. S.B., C.T., L.-M.C., A.C., D.R. wrote the paper. 511
Competing interests
512
We declare we have no competing interests. 513
Acknowledgments
514
We thank Andy Russel and Patrice David for useful discussions. We also thank Maxime Dubart for 515
useful advice for the statistical analyses. We thank all the people who helped maintain the study site 516
and conduct the blue tit monitoring in the past 45 years, in particular Jacques Blondel, Phillippe Perret, 517
Marcel Lambrechts, Claire Doutrelant, Christophe de Franceschi (who also managed the database), 518
Annick Lucas and Pablo Giovannini. We thank the APEEM, the ONF and Achille Sanroma for field 519
logistics, and the Fango valley MAB reserve. 520
Funding
521
This project was funded by a long-term support by the OSU-OREME, and by the European Research 522
Council (Starting grant ERC-2013-StG-337365-SHE to AC). 523
Tables and Figures
524
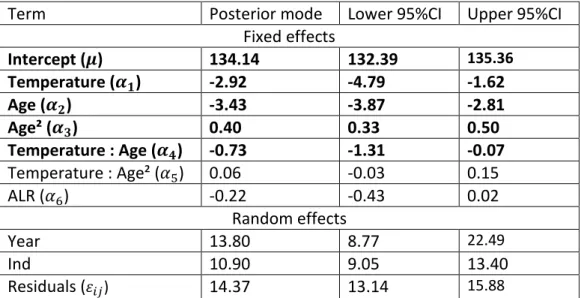
Table 1: Model 1 for laying date.
525
Laying date variation according to temperature and age. Results are from the mixed model 1 526
implemented with MCMCglmm on 1696 laying date observations from 854 females. Posterior modes 527
of estimates are indicated together with 95% credible intervals. Fixed effect estimates with 95% 528
credible intervals that do not include zero are represented in bold. ALR = age at last reproduction. 529
Term
Posterior mode
Lower 95%CI
Upper 95%CI
Fixed effects
Intercept (𝝁)
134.14
132.39
135.36Temperature (𝜶
𝟏)
-2.92
-4.79
-1.62
Age (𝜶
𝟐)
-3.43
-3.87
-2.81
Age² (𝜶
𝟑)
0.40
0.33
0.50
Temperature : Age (𝜶
𝟒)
-0.73
-1.31
-0.07
Temperature : Age² (𝛼
5)
0.06
-0.03
0.15
ALR (𝛼
6)
-0.22
-0.43
0.02
Random effects
Year
13.80
8.77
22.49Ind
10.90
9.05
13.40
Residuals (
𝜀𝑖𝑗)14.37
13.14
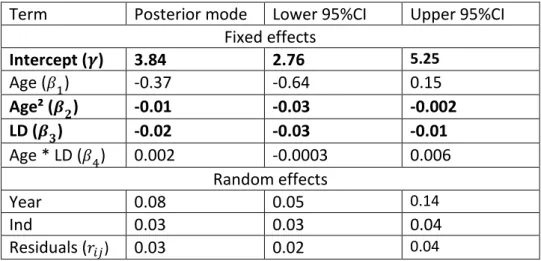
15.88 530Table 2: Model 2 for annual reproductive success.
Annual reproductive success variation according to laying date (LD) and age. Results are from the mixed model 2 implemented with MCMCglmm on 1092 laying date observations from 667 females. Posterior modes of estimates are represented together with 95% credible intervals. Fixed effect estimates with 95% credible intervals that do not include zero are represented in bold.
Term
Posterior mode
Lower 95%CI
Upper 95%CI
Fixed effects
Intercept (𝜸)
3.84
2.76
5.25Age (
𝛽1)
-0.37
-0.64
0.15
Age² (
𝜷𝟐)
-0.01
-0.03
-0.002
LD (
𝜷𝟑)
-0.02
-0.03
-0.01
Age * LD (
𝛽4)
0.002
-0.0003
0.006
Random effects
Year
0.08
0.05
0.14Ind
0.03
0.03
0.04
Residuals (
𝑟𝑖𝑗)0.03
0.02
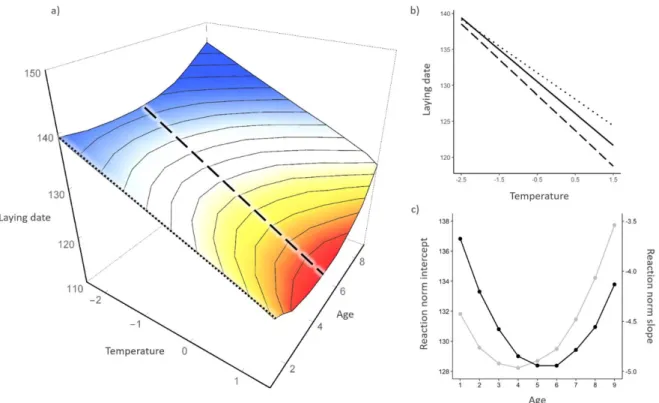
0.04Figure 1: Age-dependent reaction norm of laying date with respect to temperature.
Age-dependent reaction norm of laying date with respect to mean-centered temperature. a) Bivariate reaction norm representing predicted laying date (vertical axis and colour gradient) against temperature and age. Also represented are the univariate reaction norms with respect to the environment showing plasticity at age 1 (dotted line) and 5 (long dashed line). b) Reaction norms of predicted laying date with respect to temperature at age 1 (dotted line) and 5 (long dashed line, same as Figure 1a) are shown together with the average reaction norm across all females regardless of age (solid line). For a and b, predicted values of laying date were obtained from the posterior mode of predictions across all iterations from model 1. Predictions were estimated for all combinations of temperature (from -2.5 to +1.5 degree around the average cue temperature) and age (from 1 to 9 years old). c) Median reaction norm intercept (in grey) and slope (in black) of laying date with respect to temperature are plotted against female age (over its observed range). The slope was estimated as 𝛼1+ 𝛼4𝐴𝑖𝑗+ 𝛼5𝐴2𝑖𝑗 (model 1 and Table 1).
Figure 2: Influence of age and phenology on annual reproductive success.
Average annual reproductive success (± standard error) plotted according to a) age categories, or to b) laying date for different female age categories. In b), the slopes of average annual reproductive success with respect to laying date are significantly negative for the three first age classes (slope= -0.05 [SE= 0.02, p-value= 0.01], -0.08 [SE= 0.01, p-value= 4.88e-08], and -0.06 [SE= 0.01, p-value= 1.99e-05], for 1-year-old, 2-3 year-old, and 4-5 year-old females, respectively), but not for the oldest females of 6 and more years old (slope= 0.01 [SE= 0.03, p-value= 0.67]). Annual reproductive success is estimated as the number of fledglings per breeding attempt in the year. Note that some points have no standard error bars because of a single observation in the laying date – age class combination.