HAL Id: hal-01984857
https://hal.archives-ouvertes.fr/hal-01984857
Submitted on 17 Jan 2019
HAL is a multi-disciplinary open access
archive for the deposit and dissemination of
sci-entific research documents, whether they are
pub-lished or not. The documents may come from
teaching and research institutions in France or
abroad, or from public or private research centers.
L’archive ouverte pluridisciplinaire HAL, est
destinée au dépôt et à la diffusion de documents
scientifiques de niveau recherche, publiés ou non,
émanant des établissements d’enseignement et de
recherche français ou étrangers, des laboratoires
publics ou privés.
Yannis Nevers, Arnaud Kress, Audrey Defosset, Raymond Ripp, Benjamin
Linard, Julie Thompson, Olivier Poch, Odile Lecompte
To cite this version:
Yannis Nevers, Arnaud Kress, Audrey Defosset, Raymond Ripp, Benjamin Linard, et al..
OrthoIn-spector 3.0: open portal for comparative genomics. Nucleic Acids Research, Oxford University Press,
2019, 47 (D1), pp.D411-D418. �10.1093/nar/gky1068�. �hal-01984857�
OrthoInspector 3.0: open portal for comparative genomics
Yannis Nevers1, Arnaud Kress1, Audrey Defosset1, Raymond Ripp1, Benjamin Linard2,3,4, Julie D. Thompson1, Olivier Poch1 and Odile Lecompte1,*
1
Department of Computer Science, ICube, UMR 7357, University of Strasbourg, CNRS, Fédération de Médecine Translationnelle de Strasbourg, Strasbourg, France
2
LIRMM, Univ Montpellier, CNRS, Montpellier, France 3
ISEM, Univ Montpellier, CNRS, IRD, EPHE, CIRAD, INRAP, Montpellier, France 4
AGAP, Univ Montpellier, CIRAD, INRA, Montpellier Supagro, Montpellier, France
* To whom correspondence should be addressed. Tel: +33 (0)3 68 85 32 96 ; Email: [email protected]
ABSTRACT
OrthoInspector is one of the leading software suites for orthology relations inference. In this paper, we describe a major redesign of the OrthoInspector online resource along with a significant increase in the number of species: 4753 organisms are now covered across the three domains of life, making OrthoInspector the most exhaustive orthology resource to date in terms of covered cellular species. The new website integrates original data exploration and visualization tools in an ergonomic interface. Distributions of protein orthologs are represented by heatmaps summarizing their evolutionary histories, and proteins with similar profiles can be directly accessed. Two novel tools have been implemented for comparative genomics: a phylogenetic profile search that can be used to find proteins with a specific presence-absence profile and investigate their functions and, inversely, a GO profiling tool aimed at deciphering evolutionary histories of molecular functions, processes or cell components. In addition to the re-designed website, the OrthoInspector resource now provides a REST interface for programmatic access. OrthoInspector 3.0 is available at http://lbgi.fr/orthoinspectorv3.
INTRODUCTION
Genes descending from a common ancestor, or homologs, are commonly divided into two classes: orthologs, that are derived from a speciation event, and paralogs, that are derived from a duplication event (1). According to the ortholog conjecture (2), which has been debated recently but still holds (3, 4), orthologs generally conserve the same function in distinct species while paralogs can evolve different or specialized functions. Furthermore, a discrimination between outparalogs and inparalogs is needed when studying evolutionary and functional relationships between proteins (5). Outparalogs are produced by a duplication event anterior to a given speciation event, while inparalogs result from a ‘recent’ duplication, posterior to a speciation event. Thus, inparalogs in one species are assumed to be relatively close to each other and are considered co-orthologs to their counterparts in another species deriving from the considered speciation event.
These notions are key principles in current biology and inferring the true orthologs or co-orthologs of proteins is crucial for comparative genomics and molecular biology. For example, it is essential in the transfer of data from experimental studies between species, thus making it possible to study human health in model organisms. It is also the keystone of phylogenetic profiling, an approach that exploits the presence and absence of protein orthologs across multiple species (6). The method is based on the principle that two proteins that interact or are involved in the same biological process tend to be conserved and lost together (7). Applications of phylogenetic profiling include protein-protein interaction inference and genotype-phenotype correlation as genes associated with a certain phenotypic trait tend to have a profile correlated with that trait’s phylogenetic distribution (8) .
3 4 5 6 7 8 9 10 11 12 13 14 15 16 17 18 19 20 21 22 23 24 25 26 27 28 29 30 31 32 33 34 35 36 37 38 39 40 41 42 43 44 45 46 47 48 49 50 51 52 53 54 55 56
More than thirty resources have been developed to address the challenges of orthologous relation inference and community efforts have been directed towards standardization and benchmarking of these resources, in the form of the Quest for Orthologs consortium (9). OrthoInspector (10, 11) was shown to be one of the three most balanced methods of orthology inference in terms of precision and recall in a standardized benchmarking test (12) and performed well in other comparative studies (13). The previous release of OrthoInspector (11) provided two precomputed databases (Prokaryotes and Eukaryotes) that could be queried from its website, however since the last release the number of available annotated genomes has significantly increased and standards for web interfaces have evolved.
Here, we present the third release of OrthoInspector that includes a number of important developments. First, we report a major increase in the number of species represented in the OrthoInspector precomputed databases across the three domains of cellular life, including both in-domain and cross-domain relations, making the OrthoInspector databases the most exhaustive orthology resource to date in terms of covered species. Second, to manage the massive increase of data, the OrthoInspector website has been entirely redesigned to provide a streamlined and intuitive experience for users, including a summary visualization of ortholog distributions and novel tools allowing powerful comparative genomics analyses.
RESULTS
Improved coverage of the tree of life Proteome selection
When designing the OrthoInspector databases, we focused on providing a broad coverage of the tree of life, with a selection of organisms that are representative of the taxonomic diversity. In order to meet this goal, we used the Uniprot Reference Proteomes (14), which result from an effort to efficiently sample the tree of life and limit redundancy. Incomplete genomes, mispredicted or fragmentary protein sequences constitute an important source of errors in orthology inference. Therefore, we used a combination of filters (see supplementary materials and methods) to exclude proteomes with abnormally small proteome size, a high proportion of small proteins or of proteins that do not start with a methionine.
Starting from the 5443 Reference Proteomes, the quality filtering step resulted in the exclusion of 690 proteomes (13%). The percentages of excluded proteomes were similar across domains: 119 out of 830 eukaryotes (14%), 537 out of the 4400 Bacteria (12%) and 34 out of 213 Archaea (16%). In one case, we privileged the coverage of the tree of life over quality measures and kept the proteome of Lokiarchaeum sp. GC14_75 owing to the general interest for representatives of the Asgard group in comparative genomics (15, 16).
Database architecture
The OrthoInspector 3.0 databases cover 4753 organisms (+144% compared with the previous release): 3863 bacteria (+146%), 711 (+174%) eukaryotes and 179 archaea (+49%) (Figure 1). This is, to our knowledge, the widest coverage available for an orthology inference resource in terms of cellular species. The database architecture is designed to cover the essential use cases for orthology data. It relies on three main databases, one for each domain of life. Each database provides all the orthologous relations between proteins of each species within the domain. This exhaustive coverage of each domain is suitable for fine grained studies, as it provides a good resolution at low taxonomic levels.
We designed a fourth database to provide orthologous relationships across a wider evolutionary spectrum and specifically, to cover the three domains simultaneously. To facilitate handling and interpretation of these cross-domain comparisons, we defined a subset of significant species that we will refer to as “model species” (see supplementary Table 1). We selected these species according to their importance in the biological field (e.g. model species such as Mus musculus or Caenorhabditis elegans) and/or to ensure a good taxonomic sampling (Figure 1). This selection corresponds to 317 species: 144 eukaryotes, 142 bacteria and 31 archaea.
3 4 5 6 7 8 9 10 11 12 13 14 15 16 17 18 19 20 21 22 23 24 25 26 27 28 29 30 31 32 33 34 35 36 37 38 39 40 41 42 43 44 45 46 47 48 49 50 51 52 53 54 55 56 57
OrthoInspector can thus be used to find intra-domain orthologs in a large number of species and to find inter-domain orthologs in fewer, well-studied, species. Users interested in orthology relationships between non-model species from different domains can find them by transitivity, by first finding orthologs in close ‘model species’. This original implementation involving the co-existence of databases with different levels of granularity implies that orthologs can be found in all our available species without the huge computational burden a ‘full’ inference would require.
Complete information about the database content is available in supplementary Table 1 and in the database tab on the website.
A new information design
To cope with the massive increase in the number of species available in the OrthoInspector databases and the corresponding increase in the number of orthology relationships, we implemented a new website interface providing a smooth navigation in the new datasets.
Access to protein entries
The OrthoInspector website offers two main ways to access the data: by protein identifier and by sequence similarity searches.
The protein identifier search is accessible from the main page, or anywhere on the site using the navigation bar. The user should define the appropriate database by selecting the domain of life of the query protein. Typing in the search bar triggers autocompletion and dynamically proposes a list of clickable protein entries available in the selected OrthoInspector database. The identifier search currently supports both Uniprot identifiers and Uniprot access numbers.
A sequence similarity search is also available from the OrthoInspector webpage or by selecting ‘BLAST search’ on the database tab. This launches a BLASTp (17, 18) search against all protein sequences in the OrthoInspector databases. The result is a formatted BLAST output of the 50 best hits along with their corresponding local alignments and links to the corresponding protein pages in OrthoInspector.
Protein page
The data in OrthoInspector can be explored from protein pages. The protein page header gives a quick summary of the protein (gene name, description, organism). All Gene Ontology (19) terms associated with this protein are displayed in an extendable panel when available, as well as the protein sequence and a schematic view of InterPro (20) domains found in the protein. The protein page is the core section of the website architecture and provides access to orthology relations, taxonomic distribution and proteins with similar distribution (detailed below).
Orthology data
Orthologous relationships are presented in the ‘Orthologs and taxonomic distribution’ section of the protein page. A menu allows users to choose display options, depending on their needs:
• Domain’s model organisms: only orthologs found in the “model organisms” of Eukaryotes, Bacteria or Archaea are shown in this tab. This view is used to find orthologs in popular species and avoids overwhelming the user with superfluous information. The page shown by default should meet the requirements of most users and thus serves as a suitable entry point.
• Whole domain: orthologs in all species of the in-domain databases are shown in this tab. This exhaustive view is suitable for an in-depth exploration of intra-domain relationships.
• Three domains: orthologs in “model organisms” of the three domains of life are shown in this tab. This view, which provides orthologs across all domains of life, is relevant for broader comparative genomics studies. This tab is only available for proteins belonging to “model organisms”.
3 4 5 6 7 8 9 10 11 12 13 14 15 16 17 18 19 20 21 22 23 24 25 26 27 28 29 30 31 32 33 34 35 36 37 38 39 40 41 42 43 44 45 46 47 48 49 50 51 52 53 54 55 56
All ortholog relations are shown in a table giving basic information: the type of relations (to-one, one-to-many, many-to-one, many-to-many), identifiers of all inparalogs (for many-to-*) and orthologs with links to their respective protein pages on the OrthoInspector and Uniprot web sites, the species name (linking to the NCBI taxonomy) and a summary of the species taxonomy. Additional information about orthologs (protein description and length) can be shown by customizing the output using the columns output button, in the top right corner.
By default, the table is ordered according to the taxonomic distance of the target species from the query species, as inferred from the NCBI taxonomy. Thus, except in the case of unusual evolutionary events, the first orthologs shown will be more closely related to the query protein. In the case of proteins with a large number of orthologs, a search bar allows the user to search specific results by identifier, species name, species taxid or even a specific clade name. For example, if a user is interested in orthologs of a human protein in representatives of the carnivore clade only, typing ‘carnivora’ on the search bar will achieve this. Data export
From the protein page, multiple export options are available. Exports of the table itself are available in numerous formats (Excel, CSV, XML...) via the top right corner ’Export’ button. User can also retrieve all sequences involved in selected relations (all inparalogs and orthologs) in FASTA format, which could
serve as a starting point for further analyses.
OrthoInspector also offers the possibility to directly generate a multiple sequence alignment of the query protein and all its orthologs in selected species (and inparalogs, if any) using the latest version of the alignment workflow PipeAlign 2.0 (http://www.lbgi.fr/pipealign) (Kress, in prep).
Finally, on each protein page, the selected orthologous relations can be downloaded in the standardized OrthoXML format, as defined by the Quest for Orthologs consortium (21).
Taxonomic distribution summary
The orthologs table contains, as seen above, all information about orthology relations. However, making sense of such tables can be a daunting task, especially for proteins involved in many orthology relations. To facilitate knowledge extraction, the OrthoInspector protein page provides a summary view of the ortholog distribution at three levels of granularity: the domain’s model organisms, the whole domain and all three domains.
This information appears in a banner above the orthologs table after complete loading and is displayed as a heatmap (see Figure 2) on a single row. Each tile of the heatmap corresponds to a major clade (Figure 1) of the selected domain, defined either from the NCBI taxonomy (22) or in some cases from the consensus in the literature (for example, ‘Excavata ‘ appears in the cross-domains banner and is widely accepted by the community despite not existing as such in the NCBI taxonomy). For each clade, the corresponding tile is colored in green if orthologs are found in all its representatives and red if no orthologs are found, with intermediary states between these two colors if orthologs are found in a subset of representatives. The number of species in which orthologs are found and the total number of species belonging to the clade represented in the OrthoInspector database are both displayed when hovering over the tiles.
The clades on the heatmap are ordered according to the taxonomy: clades close to each other are side by side on the heatmap. The heatmap provides users with preliminary information about the evolutionary history (emergence and losses in major clades) of their protein family at a glance.
The clades displayed in this view depend on the granularity level selected by the user. In the cross-domain view, only high-level clades are indicated (‘First level’ in Figure 1, Figure 2a), for instance Opisthokonta. The domain of each clade is clearly indicated in the banner, by an indicator above the heatmap and by a color code. Some of the high-level clades are detailed in the ‘domain’s model organisms’ and ‘whole domain’ views. For instance, Opisthokonta appear as Fungi, Choanoflagellida,
3 4 5 6 7 8 9 10 11 12 13 14 15 16 17 18 19 20 21 22 23 24 25 26 27 28 29 30 31 32 33 34 35 36 37 38 39 40 41 42 43 44 45 46 47 48 49 50 51 52 53 54 55 56 57
Metazoa and Other Opisthokonta (‘Second level’ in Figure 1, Figure 2b). Additionally, major clades referencing many species can be further divided by clicking on the tile to display subtaxa and show a more nuanced version of the distribution (see ‘Third level’ in Figure 1, Figure 2c). For instance, 15 phyla or subphyla can be visualized for the Metazoa kingdom (156 species including 47 ‘model’ species). These clickable tiles are identified by a blue frame.
Inparalogs distribution
Information about presence and absence of orthologs is fundamental when studying the evolutionary histories of proteins, but can miss some evolutionary events, notably duplication events. To address this issue, the taxonomic summary banner also provides a ‘See inparalogs’ button, that shows all inparalogs of the query protein relative to the considered clade. They are represented by ticks under the heatmap tiles that provide information about the timing of each duplication during the gene’s evolutionary history (Figure 2a). For example, an inparalog of a human protein found in relation to all species except Opisthokonts may indicate a duplication of the ancestral gene in the Opisthokonta common ancestor.
Finally, the summary section also includes the list of species in which no orthologs were found. Phylogenetic profiling tools
The presence and absence of orthologs summarized in the above section can be represented as detailed binary profiles, the phylogenetic profiles.
Searching for proteins with similar evolutionary histories
The OrthoInspector protein page can be used to find other proteins of the same species with similar phylogenetic profiles. This information is available under the ‘Proteins with similar distribution’ section on the Protein page. The data available in these sections are based on the Jaccard distance between all phylogenetic profiles of proteins in the same species (see supplementary materials and methods). The identifiers of proteins exhibiting a phylogenetic profile distance below 0.4 are shown, along with a short description of their functions and the exact value of the distance. For clarity, only the five closest proteins are shown; additional proteins can be visualized by clicking ‘See more’.
Distances are available both from a domain centric point of view (calculated on profiles limited to species of the same domain) or from a cross-domain point of view. While the domain specific section is available for all species in OrthoInspector, the cross-domain section is only available for ‘model species’. Distances between intra-domain and cross-domain profiles may differ significantly only for proteins that are present in multiple domains.
Ciliary proteins are a good example of proteins whose phylogenetic profiles are clearly correlated to their function, since the cilium has a very specific evolutionary history in Eukaryotes including multiple independent losses (8). The cilium critically depends on molecular complexes to function properly, notably the intraflagellar transport (IFT) complexes (23). We searched a core protein of the IFT-A complex, IFT122 (IF122_HUMAN) on the OrthoInspector website. In the ‘Proteins with similar distribution in Eukaryota’ section, we found a list of 33 proteins, showing a significative enrichment in the GO term ‘cilium’ (P-value:4.93*10-43). This list includes 4 out of the 5 other components of the IFT-A complex and 8 out of the 16 components of IFT-B, most of them with a distance <0.3.
As illustrated by this example, these sections provide an original perspective when studying the function of proteins and can be used to obtain a list of other proteins with potentially similar functions and possible interaction partners.
Searching proteins with a known profile
Genes associated with a given phylogenetic trait tend to share the same distribution. The distribution of a trait can thus be exploited to identify associated genes. OrthoInspector offers an original tool for
3 4 5 6 7 8 9 10 11 12 13 14 15 16 17 18 19 20 21 22 23 24 25 26 27 28 29 30 31 32 33 34 35 36 37 38 39 40 41 42 43 44 45 46 47 48 49 50 51 52 53 54 55 56
phylogenetic profiling, i.e. to search for proteins with orthologs present in a defined set of species or clades and absent in others. This tool is available from the home page and under the ‘Access/Search by profile’ tab. Users should select their query species on the dropdown menu and then interact with a dynamic representation of the NCBI taxonomic tree to define the profile. Clicking once on a clade imposes the presence of orthologs in at least one species of the clade, double clicking imposes the absence in all species, a third click removes the constraints. Once the constraints are set, the database is queried to find all proteins meeting the user’s requirements (Figure 3).
The resulting proteins are displayed as panels in the result windows with their distribution summary (see above) to facilitate identification of distribution subcategories within the results. Each protein panel also contains a short description of the protein along with the associated Gene Ontology terms. For a functional analysis of the complete protein list, a button can be clicked to run a GO term enrichment analysis using the Panther webservice (24). The full list of proteins obtained can be exported using the ‘Download list’ button, for further analysis.
Using this tool, we performed a phylogenetic profile search on the cross-domain database. Our objective was to identify Eukaryotic Signature Proteins (ESP) that were also present in Asgard Archaea, a clade whose discovery sparked interest due to its unexpected similarity to Eukaryotes (15, 16). We searched for orthologs of Homo sapiens proteins present in Archaea of the Asgard group but absent in other Archaea and in Bacteria (Figure 3a). This operation resulted in a total of 69 proteins with the required distributions (Figure 3b). The list shows a strong enrichment in proteins with GTPase activity (P-value:4.97*10-28) and vesicle-mediated transport (P-value:5.12*10-36), in agreement with previous studies (16). We also retrieved actin-cytoskeleton proteins and ubiquitin-associated proteins, two iconic examples of ESP previously reported in the Asgard group (16). As shown here, the phylogenetic profile search rapidly provides both a list of genes associated with specific distributions and the tools required to extract functional knowledge.
Identifying profiles linked to a functional category
OrthoInspector provides an original tool to explore the evolutionary history of a biological function, process or component. This module, available on the home page or via the ‘Access/GO profile’ tab, provides the distribution of all proteins of a species associated with a given GO term. After selecting the database, species, and GO term of interest, the user retrieves the list of matching proteins, in the format described above with the summary of the distribution of each associated protein. In this way, users can derive the distribution associated with their function of interest and explore the different evolutionary histories of proteins involved in the same biological system.
Data and software accessibility
This database update is complemented by the release of the new version 3.0 of the OrthoInspector software suite, developed in Java, and available for download on the website in the download section (http://www.lbgi.fr/orthoinspectorv3/download_Package). This release does not involve changes to the main algorithm (10) but provides several software improvements.
Software improvement
Several code modifications were performed to optimize the management of the massive quantities of data. This implies type changes to handle larger datasets, code optimization by reducing loop redundancy, the use of more optimized data structures (library Fastutil, (25)) and more efficient database access from the software (fewer SQL queries). This version of OrthoInspector runs faster than the precedent for large computations and can still be parallelized when installing a large database.
Improved accessibility
Following feedback from users, the new OrthoInspector version provides an easier accessibility for small datasets. Until now, fully supported database systems included MySQL and PostgreSQL, which require
3 4 5 6 7 8 9 10 11 12 13 14 15 16 17 18 19 20 21 22 23 24 25 26 27 28 29 30 31 32 33 34 35 36 37 38 39 40 41 42 43 44 45 46 47 48 49 50 51 52 53 54 55 56 57
prior experience of SQL management systems. This version comes with full support for SQLite database, which eliminates most of the preliminary steps for computing a local database since no database server configuration is required. We recommend the use of the easily accessible SQLite database option when installing small local databases and, for performance reasons, the use of PostgreSQL and MySQL systems for larger databases (several hundred of species). Updated tutorials for the installation procedure are available on the website.
Precomputed databases
All four precomputed databases (Eukaryotes, Bacteria, Archaea, Cross-Domain) can be accessed via the website interface. Due to the data volume (up to multiple terabytes in a single database), the database dump is not available for direct download but could be made available on demand.
Quest for Ortholog consortium reference proteome
The Quest for Ortholog (QFO) consortium is part of an ongoing effort from the community pushing for standardization in orthology inferences. The QFO consortium published a list of 78 reference proteomes representing high quality proteomes and recommend using it for benchmarking purposes. The precomputed orthology relationship made using this benchmark are available on http://www.lbgi.fr/orthoinspectorv3/QFO.
Webservices
In addition to the web interface, a programming access is a major requirement for modern databases, as it allows more flexible use of data. In this release, we introduce a Representational State Transfer (REST) API providing access to most data available from the website, through the Swagger framework (https://swagger.io). The documentation is available on the website (http://www.lbgi.fr/orthoinspectorv3/API) where all endpoints and their parameters are described. All queries can be executed with custom parameters directly from the documentation page.
CONCLUSIONS AND FUTURE DIRECTIONS
With this new release of OrthoInspector, we provide improvement in two main areas: proteome coverage and information design.
The new databases boast a massive increase in the number of species across the three domains of life and provide the most comprehensive ortholog relations resource in terms of species coverage. Nevertheless, this increase did not involve simply adding a substantial number of species. Special attention was paid to both quality of proteomes and taxonomic coverage. With the increasing rate of genome sequencing, our scheduled strategy to ensure scalability will include regular updates of the current proteome content and the addition of new species while maintaining our standard of proteome quality. This will come with an updating procedure directly added to the software suite to allow any user to easily update their local databases with the latest data.
In terms of accessibility, the installation process of local databases using the software suite has been simplified and more importantly, the web interface of the OrthoInspector precomputed databases has been significantly reorganized. The new design offers improved access to orthologous data in the three domains of life. In addition, we believe that the implementation of original and user-friendly comparative genomics tools will be useful for anyone interested in comparative genomics and evolutionary studies of protein families. The next step for OrthoInspector will be the automated definition and analysis of orthologous families among ‘model species’ by exploiting our experience in multiple sequence alignment construction (26, 27) (Kress, in prep). This will allow the exploration of protein evolution through the three life domains at different levels of resolution, from presence/absence of orthologs to subtler patterns of differential conservation at domain or block levels.
SUPPLEMENTARY DATA 3 4 5 6 7 8 9 10 11 12 13 14 15 16 17 18 19 20 21 22 23 24 25 26 27 28 29 30 31 32 33 34 35 36 37 38 39 40 41 42 43 44 45 46 47 48 49 50 51 52 53 54 55 56
Additional information about proteome selection, database computations and retrieval of data displayed on the website are available in Supplementary material and methods.
Supplementary table 1. Species available in OrthoInspector. List of all species available in the OrthoInspector databases, along with their domain and their classification under our 3 levels of taxonomic granularity. Model species are indicated.
Supplementary table 2. Species for which a Uniprot Reference proteome was available and filters applied to include and exclude them in the final release.
ACKNOWLEDGEMENTS
We thank the Bio-statistics, Informatics and Complex System platform (BICS) and BISTRO bioinformatics platforms for informatics support and the European Grid Infrastructure for cloud computing facilities. We also thank our users for their feedback that helped to improve our suite and website.
FUNDING
This work was supported by the Agence Nationale de la Recherche [BIPBIP: ANR-10-BINF-03-02, ReNaBi-IFB: ANR-11-INBS-0013, Labex Agro: LABX-0001-01 to B.L., Labex CeMEB: ANR-10-LABX-0004 to B.L., Labex NUMEV: ANR-10-LABX-20 to B.L.]; and Institute funds from the Centre National de la Recherche Scientifique and the Université de Strasbourg. Funding for open access charge: Centre National de la Recherche Scientifique.
REFERENCES
1. Fitch,W.M. (1970) Distinguishing homologous from analogous proteins. Syst. Zool., 19, 99–113.
2. Tatusov,R.L., Koonin,E.V. and Lipman,D.J. (1997) A Genomic Perspective on Protein Families. Science,
278
, 631–637.
3. Nehrt,N.L., Clark,W.T., Radivojac,P. and Hahn,M.W. (2011) Testing the Ortholog Conjecture with
Comparative Functional Genomic Data from Mammals. PLOS Comput. Biol., 7, e1002073.
4. Altenhoff,A.M., Studer,R.A., Robinson-Rechavi,M. and Dessimoz,C. (2012) Resolving the ortholog
conjecture: orthologs tend to be weakly, but significantly, more similar in function than paralogs.
PLoS Comput. Biol., 8, e1002514.
5. Koonin,E.V. (2005) Orthologs, paralogs, and evolutionary genomics. Annu. Rev. Genet., 39, 309–338.
6. Pellegrini,M., Marcotte,E.M., Thompson,M.J., Eisenberg,D. and Yeates,T.O. (1999) Assigning protein
functions by comparative genome analysis: protein phylogenetic profiles. Proc. Natl. Acad. Sci. U.
S. A., 96, 4285–4288.
7. Pellegrini,M. (2012) Using phylogenetic profiles to predict functional relationships. Methods Mol. Biol.
Clifton NJ, 804, 167–177.
8. Nevers,Y., Prasad,M.K., Poidevin,L., Chennen,K., Allot,A., Kress,A., Ripp,R., Thompson,J.D., Dollfus,H.,
Poch,O., et al. (2017) Insights into Ciliary Genes and Evolution from Multi-Level Phylogenetic
Profiling. Mol. Biol. Evol., 34, 2016–2034.
3 4 5 6 7 8 9 10 11 12 13 14 15 16 17 18 19 20 21 22 23 24 25 26 27 28 29 30 31 32 33 34 35 36 37 38 39 40 41 42 43 44 45 46 47 48 49 50 51 52 53 54 55 56 57
9. Forslund,K., Pereira,C., Capella-Gutierrez,S., Silva,D., Sousa,A., Altenhoff,A., Huerta-Cepas,J.,
Muffato,M., Patricio,M., Vandepoele,K., et al. (2018) Gearing up to handle the mosaic nature of
life in the quest for orthologs. Bioinformatics, 34, 323–329.
10. Linard,B., Thompson,J.D., Poch,O. and Lecompte,O. (2011) OrthoInspector: comprehensive orthology
analysis and visual exploration. BMC Bioinformatics, 12, 11.
11. Linard,B., Allot,A., Schneider,R., Morel,C., Ripp,R., Bigler,M., Thompson,J.D., Poch,O. and
Lecompte,O. (2015) OrthoInspector 2.0: Software and database updates. Bioinforma. Oxf. Engl.,
31
, 447–448.
12. Altenhoff,A.M., Boeckmann,B., Capella-Gutierrez,S., Dalquen,D.A., DeLuca,T., Forslund,K.,
Huerta-Cepas,J., Linard,B., Pereira,C., Pryszcz,L.P., et al. (2016) Standardized benchmarking in the quest
for orthologs. Nat. Methods, 13, 425–430.
13. Liebeskind,B.J., McWhite,C.D. and Marcotte,E.M. (2016) Towards Consensus Gene Ages. Genome
Biol. Evol., 8, 1812–1823.
14. UniProt: the universal protein knowledgebase (2017) Nucleic Acids Res., 45, D158–D169.
15. Spang,A., Saw,J.H., Jørgensen,S.L., Zaremba-Niedzwiedzka,K., Martijn,J., Lind,A.E., van Eijk,R.,
Schleper,C., Guy,L. and Ettema,T.J.G. (2015) Complex archaea that bridge the gap between
prokaryotes and eukaryotes. Nature, 521, 173–179.
16. Zaremba-Niedzwiedzka,K., Caceres,E.F., Saw,J.H., Bäckström,D., Juzokaite,L., Vancaester,E.,
Seitz,K.W., Anantharaman,K., Starnawski,P., Kjeldsen,K.U., et al. (2017) Asgard archaea
illuminate the origin of eukaryotic cellular complexity. Nature, 541, 353–358.
17. Altschul,S.F., Gish,W., Miller,W., Myers,E.W. and Lipman,D.J. (1990) Basic local alignment search tool.
J. Mol. Biol., 215, 403–410.
18. Camacho,C., Coulouris,G., Avagyan,V., Ma,N., Papadopoulos,J., Bealer,K. and Madden,T.L. (2009)
BLAST+: architecture and applications. BMC Bioinformatics, 10, 421.
19. Gene Ontology Consortium (2015) Gene Ontology Consortium: going forward. Nucleic Acids Res., 43,
D1049-1056.
20. Finn,R.D., Attwood,T.K., Babbitt,P.C., Bateman,A., Bork,P., Bridge,A.J., Chang,H.-Y., Dosztányi,Z.,
El-Gebali,S., Fraser,M., et al. (2017) InterPro in 2017—beyond protein family and domain
annotations. Nucleic Acids Res., 45, D190–D199.
21. Dessimoz,C., Gabaldón,T., Roos,D.S., Sonnhammer,E.L.L., Herrero,J., Altenhoff,A., Apweiler,R.,
Ashburner,M., Blake,J., Boeckmann,B., et al. (2012) Toward community standards in the quest
for orthologs. Bioinformatics, 28, 900–904.
22. Sayers,E.W., Barrett,T., Benson,D.A., Bryant,S.H., Canese,K., Chetvernin,V., Church,D.M., DiCuccio,M.,
Edgar,R., Federhen,S., et al. (2009) Database resources of the National Center for Biotechnology
Information. Nucleic Acids Res., 37, D5-15.
3 4 5 6 7 8 9 10 11 12 13 14 15 16 17 18 19 20 21 22 23 24 25 26 27 28 29 30 31 32 33 34 35 36 37 38 39 40 41 42 43 44 45 46 47 48 49 50 51 52 53 54 55 56
23. Lechtreck,K.F. (2015) IFT-Cargo Interactions and Protein Transport in Cilia. Trends Biochem. Sci., 40,
765–778.
24. Mi,H., Poudel,S., Muruganujan,A., Casagrande,J.T. and Thomas,P.D. (2016) PANTHER version 10:
expanded protein families and functions, and analysis tools. Nucleic Acids Res., 44, D336-342.
25. Boldi,P., Marino,A., Santini,M. and Vigna,S. (2016) BUbiNG: Massive Crawling for the Masses.
ArXiv160106919 Cs.
26. Vanhoutreve,R., Kress,A., Legrand,B., Gass,H., Poch,O. and Thompson,J.D. (2016) LEON-BIS: multiple
alignment evaluation of sequence neighbours using a Bayesian inference system. BMC
Bioinformatics, 17, 271.
27. Kress,A., Lecompte,O., Poch,O. and Thompson,J.D. (2018) PROBE: analysis and visualization of
protein block-level evolution. Bioinforma. Oxf. Engl., 10.1093/bioinformatics/bty367.
TABLES AND FIGURE LEGENDS
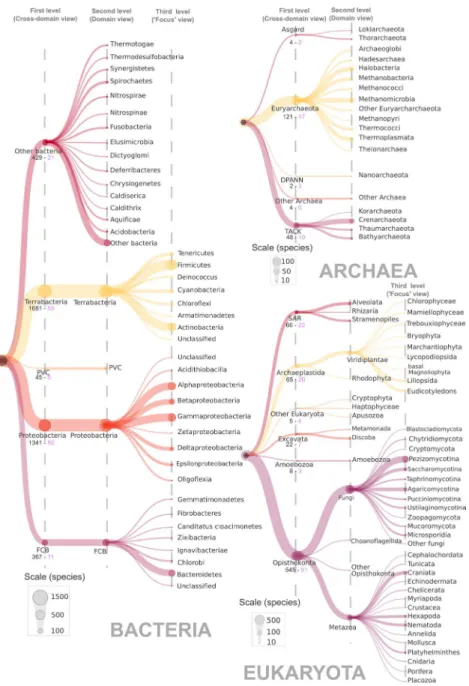
Figure 1. Taxonomic distribution of species represented in OrthoInspector. The domain trees are distributed on three ‘levels’. The first level corresponds to the cross-domain taxonomic distribution heatmap shown when browsing the cross-domain database, the second level is shown on the heatmap for domain specific databases and the third level is the ‘focus view’ available for certain clades (See figure 2). The size of a node is proportional to the number of species in the corresponding clades according to indicated scales. The number of species and model species in first-level clades are displayed in black and pink respectively.
Figure 2. Taxonomic distribution heatmaps. Each labelled tile corresponds to a clade and is colored according to the proportion of species in the clade with at least one ortholog. Colors range from red (no species) to green (all species). a. Heatmap corresponding to the cross-domain database. The domain of life of the clades is shown by an additional label and a color code. Inparalogs distribution is indicated by a tick under each clade. b. Heatmap corresponding to the eukaryotic database. The box framed by a thin blue outline can be expanded to ‘focus view’. c. Heatmap corresponding to the ‘focus view’ of Metazoa. Figure 3. Phylogenetic profile search interface. a. Definition of the phylogenetic profile. User selects: (1) the database, (2) the query species in the drop-down menu and (3) the presence/absence constraints using the phylogenetic tree. A summary of constraints is shown below the tree. Here, human proteins absent in Prokaryotes except the archaeal Asgard group are selected. b. Output of the profile search. Constraints are included on the top with the number of proteins found. Proteins are displayed in panels, showing their distributions and functional information. Gene Ontology enrichment can be performed on the protein list. 3 4 5 6 7 8 9 10 11 12 13 14 15 16 17 18 19 20 21 22 23 24 25 26 27 28 29 30 31 32 33 34 35 36 37 38 39 40 41 42 43 44 45 46 47 48 49 50 51 52 53 54 55 56 57
Figure 1. Taxonomic distribution of species represented in OrthoInspector. The domain trees are distributed on three ‘levels’. The first level corresponds to the cross-domain taxonomic distribution heatmap shown when browsing the cross-domain database, the second level is shown on the heatmap for domain specific databases and the third level is the ‘focus view’ available for certain clades (See figure 2). The size of a node
is proportional to the number of species in the corresponding clades according to indicated scales. The number of species and model species in first-level clades are displayed in black and pink respectively.
3 4 5 6 7 8 9 10 11 12 13 14 15 16 17 18 19 20 21 22 23 24 25 26 27 28 29 30 31 32 33 34 35 36 37 38 39 40 41 42 43 44 45 46 47 48 49 50 51 52 53 54 55 56
Figure 2. Taxonomic distribution heatmaps. Each labelled tile corresponds to a clade and is colored according to the proportion of species in the clade with at least one ortholog. Colors range from red (no species) to
green (all species). a. Heatmap corresponding to the cross-domain database. The domain of life of the clades is shown by an additional label and a color code. Inparalogs distribution is indicated by a tick under each clade. b. Heatmap corresponding to the eukaryotic database. The box framed by a thin blue outline can
be expanded to ‘focus view’. c. Heatmap corresponding to the ‘focus view’ of Metazoa.
3 4 5 6 7 8 9 10 11 12 13 14 15 16 17 18 19 20 21 22 23 24 25 26 27 28 29 30 31 32 33 34 35 36 37 38 39 40 41 42 43 44 45 46 47 48 49 50 51 52 53 54 55 56 57
Figure 3. Phylogenetic profile search interface. a. Definition of the phylogenetic profile. User selects: (1) the database, (2) the query species in the drop-down menu and (3) the presence/absence constraints using the
phylogenetic tree. A summary of constraints is shown below the tree. Here, human proteins absent in Prokaryotes except the archaeal Asgard group are selected. b. Output of the profile search. Constraints are
included on the top with the number of proteins found. Proteins are displayed in panels, showing their distributions and functional information. Gene Ontology enrichment can be performed on the protein list.
3 4 5 6 7 8 9 10 11 12 13 14 15 16 17 18 19 20 21 22 23 24 25 26 27 28 29 30 31 32 33 34 35 36 37 38 39 40 41 42 43 44 45 46 47 48 49 50 51 52 53 54 55 56
Supplementary Materials
MATERIAL AND METHODSProteome selection
The goal in constructing the new OrthoInspector databases was to cover species representatives of most of the known tree of life, while avoiding incomplete proteomes and fragmentary or misannotated proteins. We generated four main databases: one dedicated to each of the three life domains (Eukaryotes, Bacteria, Archaea) and a cross-domain database. To construct them, we downloaded all Uniprot Reference Proteomes (1) that are specifically designed to adequately cover the tree of life (downloaded in November 2016). However, incomplete or fragmentary annotation of genomes (for example, due to lack of coverage) can be a source of orthology misprediction. Thus, all proteomes were submitted to a preliminary quality control based on three criteria: protein number, distribution of protein lengths and the nature of the first amino acid of the protein sequences.
First, we excluded proteomes with outlier numbers of proteins that are not explained by biological peculiarities (e.g. symbiosis or parasitism for small proteomes) and that did not correspond to the literature. Second, we examined the distribution of protein lengths in each proteome and the proportion of small proteins (< 100 aa) as well as the proportion of protein sequences starting with an amino acid other than methionine (hereafter referred to as ‘false-start’). The last two parameters were used as a proxy to estimate the number of fragmentary proteins in proteomes and used to filter low quality ones. For Archaea and Bacteria, we excluded proteomes with more than 20% of small proteins and/or 10% of false-start proteins and/or more than 10% proteins annotated as fragments. For Eukaryotes, we kept the same threshold for small proteins and excluded proteomes with more than 55% of false start proteins. This more lenient threshold takes into account the higher proportion of false start proteins generally observed in Eukaryotes due to the complex nature of eukaryotic genomes, which are classically more challenging to assemble and annotate.
Orthology inference
For each precomputed database, we constructed a BLAST database with all the corresponding selected reference proteomes and performed all-vs-all BLASTp searches using BLAST+ (2, 3) with the following parameters: wordsize=3, output size=5000, expect threshold=10-5 and compositional adjustment. BLAST outputs were processed to construct the precomputed databases using the latest OrthoInspector Suite release (available at http://www.lbgi.fr/orthoinspectorv3/download) with expect threshold set to 10-5.
Phylogenetic profiling and distance computing
Phylogenetic (presence-absence) profiles were generated using an in-house python script, directly connected to the databases. For each protein of a query species, all relations (one-to-one, one-to-many, many-to-one, many-to-many) were retrieved from the databases. A presence was assigned for a given target species if an orthologous relationship exists between the query protein and one or more proteins of the target species. The output is a binary matrix saved in a tab separated file with row corresponding to proteins and columns corresponding to species. We ran this script for each species in OrthoInspector. Profiles were generated for all proteins in all species for the small Archaea database and in ‘model species’ (see below for a definition) for Bacteria and Eukaryotes.
The Jaccard distance, a distance measure suitable for binary vectors, was calculated for each presence/absence matrix using the dist.binary function in ade4 packages (4) and saved in another tab separated file. Finally, we saved each pair of proteins with a distance less than a threshold of 0.4 in a dedicated PostgreSQL database. These distances can be accessed on the website from the corresponding protein pages.
Protein domains and Gene Ontology
3 4 5 6 7 8 9 10 11 12 13 14 15 16 17 18 19 20 21 22 23 24 25 26 27 28 29 30 31 32 33 34 35 36 37 38 39 40 41 42 43 44 45 46 47 48 49 50 51 52 53 54 55 56 57
Information about protein domains is retrieved from InterPro (5) via the EBI webservice. Functional enrichment analyses available on the website are performed on the three Gene Ontology (GO) categories (parameters: ‘function’, ‘process’ ‘cellular_localisation’) using the Panther (6) enrichment webservice. GO annotations available on the websites are extracted from our local instance of the official GO database (7). REFERENCES
1. UniProt: the universal protein knowledgebase (2017) Nucleic Acids Res, 45, D158–D169. 2. Altschul,S.F., Madden,T.L., Schäffer,A.A., Zhang,J., Zhang,Z., Miller,W. and Lipman,D.J. (1997) Gapped BLAST and PSI-BLAST: a new generation of protein database search programs. Nucleic Acids Res., 25, 3389–3402.
3. Camacho,C., Coulouris,G., Avagyan,V., Ma,N., Papadopoulos,J., Bealer,K. and Madden,T.L. (2009) BLAST+: architecture and applications. BMC Bioinformatics, 10, 421.
4. Dray,S. and Dufour,A.-B. (2007) The ade4 Package: Implementing the Duality Diagram for Ecologists. Journal of Statistical Software, Articles, 22, 1–20.
5. Finn,R.D., Attwood,T.K., Babbitt,P.C., Bateman,A., Bork,P., Bridge,A.J., Chang,H.-Y., Dosztányi,Z., El-Gebali,S., Fraser,M., et al. (2017) InterPro in 2017—beyond protein family and domain annotations. Nucleic Acids Res, 45, D190–D199.
6. Mi,H., Poudel,S., Muruganujan,A., Casagrande,J.T. and Thomas,P.D. (2016) PANTHER version 10: expanded protein families and functions, and analysis tools. Nucleic Acids Res., 44, D336-342.
7. Gene Ontology Consortium (2015) Gene Ontology Consortium: going forward. Nucleic Acids Res., 43, D1049-1056. 3 4 5 6 7 8 9 10 11 12 13 14 15 16 17 18 19 20 21 22 23 24 25 26 27 28 29 30 31 32 33 34 35 36 37 38 39 40 41 42 43 44 45 46 47 48 49 50 51 52 53 54 55 56