HAL Id: hal-02968642
https://hal.archives-ouvertes.fr/hal-02968642
Submitted on 16 Oct 2020
HAL is a multi-disciplinary open access
archive for the deposit and dissemination of
sci-entific research documents, whether they are
pub-lished or not. The documents may come from
teaching and research institutions in France or
abroad, or from public or private research centers.
L’archive ouverte pluridisciplinaire HAL, est
destinée au dépôt et à la diffusion de documents
scientifiques de niveau recherche, publiés ou non,
émanant des établissements d’enseignement et de
recherche français ou étrangers, des laboratoires
publics ou privés.
The AMBRE project: The thick thin disk and thin thick
disk of the Milky Way
M. R. Hayden, A. Recio-Blanco, P. de Laverny, S. Mikolaitis, C. C. Worley
To cite this version:
M. R. Hayden, A. Recio-Blanco, P. de Laverny, S. Mikolaitis, C. C. Worley. The AMBRE project:
The thick thin disk and thin thick disk of the Milky Way. Astronomy and Astrophysics - A&A, EDP
Sciences, 2017, 608, pp.L1. �10.1051/0004-6361/201731494�. �hal-02968642�
DOI:10.1051/0004-6361/201731494 c ESO 2017
Astronomy
&
Astrophysics
Letter to the Editor
The AMBRE project: The thick thin disk and thin thick disk
of the Milky Way
M. R. Hayden
1, A. Recio-Blanco
1, P. de Laverny
1, S. Mikolaitis
2, and C. C. Worley
31 Laboratoire Lagrange (UMR 7293), Université de Nice Sophia Antipolis, CNRS, Observatoire de la Côte d’Azur, BP 4229,
06304 Nice Cedex 4, France e-mail: [email protected]
2 Institute of Theoretical Physics and Astronomy, Vilnius University, Saul˙etekio al. 3, 10257 Vilnius, Lithuania 3 Institute of Astronomy, Cambridge University, Madingley Road, Cambridge CB3 0HA, UK
Received 3 July 2017/ Accepted 4 November 2017
ABSTRACT
We analyze 494 main sequence turnoff and subgiant stars from the AMBRE:HARPS survey. These stars have accurate astrometric information from Gaia DR1, providing reliable age estimates with relative uncertainties of ±1 or 2 Gyr and allowing precise or-bital determinations. The sample is split based on chemistry into a low-[Mg/Fe] sequence, which are often identified as thin disk stellar populations, and [Mg/Fe] sequence, which are often associated with thick disk stellar populations. We find that the high-[Mg/Fe] chemical sequence has extended star formation for several Gyr and is coeval with the oldest stars of the low-high-[Mg/Fe] chem-ical sequence: both the low- and high-[Mg/Fe] sequences were forming stars at the same time. We find that the high-[Mg/Fe] stellar populations are only vertically extended for the oldest, most-metal poor and highest [Mg/Fe] stars. When comparing vertical veloc-ity dispersion for the low- and high-[Mg/Fe] sequences, the high-[Mg/Fe] sequence has lower vertical velocveloc-ity dispersion than the low-[Mg/Fe] sequence for stars of similar age. This means that identifying either group as thin or thick disk based on chemistry is misleading. The stars belonging to the high-[Mg/Fe] sequence have perigalacticons that originate in the inner disk, while the peri-galacticons of stars on the low-[Mg/Fe] sequence are generally around the solar neighborhood. From the orbital properties of the stars, the high-[Mg/Fe] and low-[Mg/Fe] sequences are most likely a reflection of the chemical enrichment history of the inner and outer disk populations, respectively; radial mixing causes both populations to be observed in situ at the solar position. Based on these results, we emphasize that it is important to be clear in defining what populations are being referenced when using the terms thin and thick disk, and that ideally the term thick disk should be reserved for purely geometric definitions to avoid confusion and be consistent with definitions in external galaxies.
Key words. Galaxy: disk – Galaxy: structure – Galaxy: evolution – Galaxy: abundances – Galaxy: stellar content
1. Introduction
Unraveling the chemodynamic structure of the Milky Way is a key constraint for models of chemical and galaxy evolution. However, there has been much debate over the current structure of the disk (e.g.,Rix & Bovy 2013), in which the interplay be-tween the thin and thick disks is unclear. The advent of high-resolution spectroscopic surveys, along with data from the Gaia
(Gaia Collaboration 2016a,b) satellite, has the potential to
un-ravel the current mysteries surrounding the formation and evolu-tion of the Milky Way disk.
The thick disk was first identified by Yoshii (1982),
Gilmore & Reid (1983) as an overdensity of stars at large
dis-tances from the Galactic plane. The stars of the thick disk in the solar neighborhood have been found to be α-enhanced relative to the Sun (e.g., Fuhrmann 1998; Bensby et al. 2003;
Adibekyan et al. 2013; Recio-Blanco et al. 2014) and subsolar
metallicity at around −0.5 dex. More recent observations have led to the discovery of intermediate α populations at much higher metallicities (e.g., Bensby et al. 2007; Hayden et al.
2015; Mikolaitis et al. 2017), although there may be a
promi-nent gap between the metal-poor high-[Mg/Fe] populations and the more metal-rich intermediate-[Mg/Fe] populations (e.g.,Adibekyan et al. 2011). The origin of these intermediate-[Mg/Fe] populations is difficult to discern. It is possible that they
are chemically related to the high-[Mg/Fe] metal-poor stars (e.g.,
Haywood et al. 2016), are a distinct population (e.g.,Jofré et al.
2017), or could also result from extra mixing along the RGB for metal-rich populations (Masseron & Gilmore 2015). If the high-[Mg/Fe] metal-poor stars are chemically related with the intermediate-[Mg/Fe] stars, there appears to be two distinct stellar population sequences in the solar neighborhood. One sequence starts at high-[Mg/Fe] with the [Mg/Fe] decreasing as [Fe/H] increases even past solar metallicities, and one se-quence begins at solar-[Mg/Fe] abundances spanning a wide range of metallicities from ∼−0.6 < [Fe/H] < 0.4. The thick and thin disks are often identified in the [Mg/Fe] versus [Fe/H] plane chemically; these intermediate-α high-metallicity stars are sometimes lumped in with the thick disk populations and the solar-[Mg/Fe] populations are identified with the thin disk. However, the connections, if there are any, between the thin and thick disk chemical sequences is unclear. Furthermore, there is overlap between the sequences at the highest metallicities at solar-[Mg/Fe] abundances and it is also uncertain to which se-quence (or both) these stellar populations belong. It has been argued that what we identify as the thick disk in the chemical plane is not a distinct phase of the disk evolution, but is instead the chemical evolution track of stellar populations from the inner Galaxy that is brought to the solar neighborhood through radial mixing processes (Haywood et al. 2013). In this case, it is likely
A&A 608, L1 (2017) that the super solar-metallicity populations currently identified
as thin disk are actually the metal-rich extension of the high-[Mg/Fe] thick disk sequence.
With the advent of precision astrometric measurements from Gaia, we can now measure accurately ages, velocities, and or-bital properties for large numbers of stars that can be used in conjunction with ground-based spectroscopic surveys. In this pa-per, we describe the AMBRE:HARPS dataset of main sequence turnoff (MSTO)/subgiant stars for which we obtain reliable ages and measure the chemical, kinematic, and temporal properties of the disk. We then discuss the structure of the disk in the solar neighborhood based on the HARPS-TGAS dataset.
2. Data
2.1. AMBRE:HARPS
The AMBRE project is a uniform analysis of high-resolution archival ESO spectra, as described inde Laverny et al.(2013). We focused on spectra taken from the HARPS instrument as this sample has large overlap with the Gaia/TGAS catalog. Stellar parameters are derived using the MATISSE algorithm
(Recio-Blanco et al. 2006), as described in De Pascale et al.
(2014) for the HARPS instrument. Individual abundances for this sample are derived in Mikolaitis et al. (2017). In particu-lar, our analysis uses the effective temperature measurements from AMBRE, along with the [Fe/H] and [Mg/Fe] derived in
theMikolaitis et al.(2017) analysis. Typical errors are <100 K
in Teffand 0.05 dex in [Fe/H] and [Mg/Fe]. 2.2. Gaia DR1
Parallaxes and proper motions for the AMBRE:HARPS sam-ple were taken from Gaia DR1 (Lindegren et al. 2016). This sample is hereafter referred to as HARPS-TGAS and contains ∼1500 stars. We computed distances using a Bayesian approach as outlined in Bailer-Jones (2015), consisting of a single disk with an exponential scale height of 300 pc and exponential scale length of 2.7 kpc. Additionally, we used the luminosity function derived byRobin et al.(2012). As the majority of the sample is within 50 pc, the choice of prior has little impact on the overall results, as the fractional parallax error at these distances is very small (<5%).
2.3. Ages
We used Bayesian inference to determine ages for the HARPS-TGAS sample using methods similar to those described in
Jørgensen & Lindegren(2005) by comparing the derived stellar
parameters to Dartmouth isochrones (Dotter et al. 20081). We
select main sequence turnoff and subgiant stars for which the age estimates are most reliable. A more detailed description of the ages is given in Appendix A. The average (1σ) relative er-rors for the ages are 1−2 Gyr when using simulated observations from TRILEGAL (Girardi et al. 2005) or comparing to the sam-ple analyzed byHaywood et al.(2013). The isochrones range in age from 0 to 15 Gyr, so the absolute age scale used in this anal-ysis is somewhat stretched, particularly for the oldest stars. 2.4. Velocities and orbits
Velocities and orbits were determined via Galpy (Bovy 2015) using distances and proper motions from Gaia DR1, along with radial velocities as determined by AMBRE. For the orbit integra-tion, we used the MWPotential2014 described in Bovy(2015)
1 http://stellar.dartmouth.edu/models/isolf_new.html −1.0 −0.8 −0.6 −0.4 −0.2 0.0 0.2 0.4 [Fe/H] −0.2 −0.1 0.0 0.1 0.2 0.3 0.4 0.5 [M g /F e ] 4.0 4.5 5.0 5.5 6.0 6.5 7.0 Rp(kpc)
Fig. 1.[Mg/Fe] vs. [Fe/H] plane for the HARPS sample with reliable
age estimates. The blue line denotes our chemical separation between thin and thick disks, where the thick disk stars (star symbol) are shown above the line and thin disk stars (circle symbol) below the line. The size of each data point denotes the relative age of each star; the larger points are older than smaller points. Stars are color coded by their Rp.
The color bar stops at Rp = 7 kpc to prevent color saturation of stars
coming from the inner Galaxy. Which sequence the most metal-rich, solar-[Mg/Fe] stars belong to is unclear, and we show the red line as an example of a different potential split between stellar population groups. for the Galactic potential. We assume a solar position of 8 kpc and a rotational velocity of the disk of 220 km s−1. Typical un-certainties in individual velocity components are.1 km s−1and in the orbital parameters such as Rpor zmaxof ∼5%. Errors in the velocities and orbital parameters are computed using a Monte Carlo (MC) of the dervied and observed parameters (e.g., Teff, MK, µ). The method for measuring the vertical velocity disper-sion is described inGuiglion et al. (2015) andHayden (2017). We measured the vertical velocity dispersion in bins of 2 Gyr and required a minimum of eight stars per bin to compute the velocity measurements.
3. Results
3.1. Ages of the thin and thick disk stars
We separated the stars into low- and high-[Mg/Fe] sequences based on a combination of their [Mg/Fe] and [Fe/H] abundances as shown by the blue line in Fig.1; the high-[Mg/Fe] stars (star symbols) represent those above the blue line, while the low-[Mg/Fe] stars (circles) represent those below the blue line. Indi-vidual stars are color coded by the estimated perigalacticon Rp. The Rpis the closest approach to galactic center of the orbit of a star and is a useful tracer, particularly for the most metal-rich populations, in constraining the relative importance of the dif-ferent mechanisms responsible for radial mixing of stellar pop-ulations (i.e., blurring versus churning; seeSellwood & Binney 2002). The color bar has a cutoff of Rp= 7 kpc, but many of the stars actually have larger Rp that extend all the way to the solar radius at ∼8 kpc. The cutoff prevents color saturation of the stars belonging to the inner disk.
In Fig. 2 we find that the oldest stellar populations, with τ > 12 Gyr, belong to the high-[Mg/Fe] sequence (star sym-bols) and are the most metal-poor and high-α stars in the sam-ple. Many of these stars come from the inner Galaxy, with Rp< 5 kpc (Fig.1), and are likely associated with the classical thick disk. We find that there is extended star formation for many Gyr along the high-[Mg/Fe] sequence, as shown in Fig.3. Follow-ing the high-[Mg/Fe] track, we find that the [Mg/Fe] ratio begins to decrease at [Fe/H] ∼ −0.5, as Type Ia supernovae begin to L1, page 2 of5
0 2 4 6 8 10 12 14 τ (Gyr) −0.1 0.0 0.1 0.2 0.3 0.4 [M g /F e ] −0.7 −0.5 −0.3 −0.1 0.1 0.3 [Fe/H]
Fig. 2. [Mg/Fe] vs. age relation for the HARPS sample, with stars
color-coded by metallicity. The symbols used are the same as in Fig.1, where the high-[Mg/Fe] track is represented by stars and the low-[Mg/Fe] track as circles.
pollute the ISM. As shown in Figs.1and2there is a clear age-α-metallicity relation for the thick disk stars up until τ ∼ 6 Gyr ([Fe/H] ∼ 0.2), where the [Mg/Fe] ratio decreases and metallic-ity increases for younger stellar populations. For stars along the high-[Mg/Fe] sequence, we see a general trend in increasing Rp with increasing metallicity: that is to say, the orbits for younger stars along the high-[Mg/Fe] sequence are more circular than those of older high-[Mg/Fe] stars. It is unclear to which stellar populations the most metal-rich solar-[Mg/Fe] stars belong: it is possible that the stars with [Fe/H] > 0.2 that are currently la-beled as thin disk are in fact the most metal-rich extension of the high-[Mg/Fe] chemical track. As an example, the red line in Fig.1 shows a different potential split between stellar
popula-tions for which the highest metallicity populapopula-tions all belong to the high-[Mg/Fe] sequence. In this case, star formation along the thick disk sequence has continued up to present day.
Along the low-[Mg/Fe] track, we find that the oldest stars ap-pear ∼10 Gyr ago at intermediate [Mg/Fe] abundances and low (<−0.6 dex) metallicity. We define a star as having a roughly cir-cular orbit if it has e < 0.2. We find that many of these older thin disk stars are on circular orbits in the solar neighborhood or come from larger radii with apogalacticons greater than 10 kpc; very few of such thin disk stars are on orbits that stray into the in-ner disk. The thin disk sequence has a slight τ -α-metallicity re-lation for older, more metal-poor popure-lations. As age increases, α decreases and metallicity decreases. However, this relationship breaks down at around ∼6 Gyr, as stars with these ages have a large range in metallicity. For τ < 6 Gyr, there is a spread for −0.5 < [Fe/H] < 0.4 in metallicity: for these stars there is no age-α-metallicity relation and there is a large dispersion in the derived metallicities for the youngest stellar populations. For the most metal-rich stars on the thin disk track ([Fe/H] > 0.1−0.2), we find that more than half are on circular orbits (e < 0.2), de-spite their likely origin in the inner Galaxy based on their high metallicities.
Finally, we find significant age overlap between the low-and high-[Mg/Fe] sequences for many Gyr between ∼6 < τ < 10 Gyr: the stellar populations belonging to the low- and high-[Mg/Fe] populations are coeval and both tracks formed stars of very different metallicities at the same time, as shown in Fig.3. 3.2. Vertical distribution of the low- and high-[Mg/Fe] tracks Using bins of 2 Gyr, we measured the vertical velocity dis-persion for both the low- (green line) and high-[Mg/Fe] (blue
−1.0 −0.8 −0.6 −0.4 −0.2 0.0 0.2 0.4 −0.2 −0.1 0.0 0.1 0.2 0.3 0.4 0.5 τ > 12 (Gyr) −1.0 −0.8 −0.6 −0.4 −0.2 0.0 0.2 0.4 τ > 10 (Gyr) −1.0 −0.8 −0.6 −0.4 −0.2 0.0 0.2 0.4 −0.2 −0.1 0.0 0.1 0.2 0.3 0.4 0.5 τ > 8 (Gyr) −1.0 −0.8 −0.6 −0.4 −0.2 0.0 0.2 0.4 τ > 6 (Gyr) 4.0 4.5 5.0 5.5 6.0 6.5 7.0 Rp [M g /F e] [Fe/H]
Fig. 3.[Mg/Fe] vs. [Fe/H] plane as a function of various age ranges,
going from oldest to younger stellar populations. Stars are color coded by their perigalacticons Rp. The blue and red lines are the same as in
Fig.1, where the high-[Mg/Fe] population are denoted by star symbols
and the low-[Mg/Fe] population are denoted by circles.
0 2 4 6 8 10 12 14 τ
(Gyr)
10 20 30 40 50 σV Z(k
m
s
− 1)
High [Mg/Fe] Stars
Low [Mg/Fe] Stars
All Stars
Fig. 4.Vertical velocity dispersion as a function of age for the
low-[Mg/Fe] (green), high-low-[Mg/Fe] (blue), and total (black) stellar sample. Velocity dispersion is measured in bins of 2 Gyr, where each bin has a minimum of 8 stars per bin.
line) sequences as shown in Fig.4. We find little evidence for a step function in the vertical velocity dispersion, and instead find that the vertical velocity dispersion generally smoothly increases with age for both tracks, save for a dip at τ ∼ 8 Gyr for the older thin disk stars. This means that the high-[Mg/Fe] sequence is only vertically extended for the oldest, highest [Mg/Fe] popu-lations and the vertical extent of the high-[Mg/Fe] stars drops rapidly with age. Most striking is that the velocity dispersion for the high-[Mg/Fe] track is, at the same age, always equal to or lower than the low-[Mg/Fe] track. The high-[Mg/Fe] sequence is no more vertically extended than the low-[Mg/Fe] sequence when the populations are coeval.
4. Discussion
We find that the high-[Mg/Fe] sequence has an extended star for-mation history, potentially up to the present day and that the low-and high-[Mg/Fe] sequences have significant age overlap and are coeval. Chemically, there are two distinct sequences forming stars at the same time at vastly different metallicities. The high-[Mg/Fe] sequence is traditionally identified with the thick disk, but is only vertically extended for the oldest, highest [Mg/Fe], most metal-poor populations. At the ages where the low- and high-[Mg/Fe] sequences overlap, there is little difference in the vertical heights of the two populations.
A&A 608, L1 (2017) We also note that our results could be dependent on the
selec-tion funcselec-tion for the AMBRE:HARPS sample. However, these results have been observed previously byBovy et al.(2012) and
Bovy et al. (2016), using SEGUE and APOGEE data,
respec-tively, but were not commented on extensively in these papers. Additionally, we note that any large errors in age determina-tion could cause an error in the measurement of the velocity dispersion.
What we are likely seeing is the mixing of two stellar pop-ulations coming from different locations: the high-[Mg/Fe] se-quence, which formed in the inner Galaxy where star formation rates were significantly higher than the low-[Mg/Fe] sequence, which formed stars at much lower rates and had a more gradual build up of metallicity. Stars belonging to the high-[Mg/Fe] se-quence are observed in the solar neighborhood via radial mixing, wherein the older stars are primarily blurred to the solar cylin-der, while those of higher metallicity and lower [Mg/Fe] come from both blurring and churning mechanisms. The idea that the solar neighborhood is the juxtaposition of the inner and outer disk is not new.Haywood et al.(2013) argued that this is a po-tential explanation for the observations of the two sequences in the solar neighborhood, and the potential mixing of the high-[Mg/Fe] sequence with a more in situ population was initially seen in Fig. 20 of Edvardsson et al. (1993), who found that stars coming from the inner disk were often metal poor and [Mg/Fe] enhanced, while more in situ stars generally had so-lar type abundances. Qualitatively, our results are very simiso-lar to those ofEdvardsson et al.(1993) with respect to the inner disk being dominated by high-[Mg/Fe] populations. With the addi-tion of extremely precise kinematics and distances from Gaia and a larger sample size of stars with reliable ages, we find that the high-[Mg/Fe] sequence was likely not a completely separate phase of disk evolution but indeed formed stars for many Gyr and was coeval with the the low-[Mg/Fe] sequence of popula-tions. This inner disk origin for the bulk of the high-[Mg/Fe] se-quence explains the relative similarity of the high-[Mg/Fe] se-quence with radius (e.g.,Nidever et al. 2014), as radially mixing of the high-[Mg/Fe] population out to larger radii preserves its appearance in the chemical plane.
Turning our attention to the super solar-metallicity popu-lations, many of these stars are on circular orbits and never reach the radii at which they likely formed based on their high metallicity and the observed radial abundance gradients in the disk (e.g., Hayden et al. 2014). For these populations, churn-ing is an important mechanism for brchurn-ingchurn-ing them to the solar neighborhood, which is in agreement with observations from
Kordopatis et al.(2015) andHayden(2017). If we consider the
super-solar metallicity stars as the metal-rich extension of the high-[Mg/Fe] sequence, the relative importance of various mix-ing processes for the high-[Mg/Fe] sequence depends on the age/metallicity of the stellar populations: older (more metal-poor) populations are most likely observed in the solar neigh-borhood via blurring, while the younger (more metal-rich) pop-ulations appear to be radially mixed via churning.
Based on these arguments, we find that the current chemical definitions of thin and thick disk are misleading. We urge that the term thick disk be reserved for the geometric thick disk, with the realization that the chemistry of stars making up the geometric thick disk vary depending on the radius at which they are observed. In the inner Galaxy and solar neigh-borhood, the geometric thick disk is dominated by metal-poor
high-[Mg/Fe] populations, however in the outer disk the geomet-ric thick disk is dominated by flaring solar-[Mg/Fe] populations (e.g.,Hayden et al. 2015;Minchev et al. 2015;Bovy et al. 2016;
Mackereth et al. 2017). Chemically, the two sequences observed
in the [Mg/Fe] plane in the solar neighborhood are mostly likely a reflection of their birth radius, rather than a thin or thick disk, and the sequences are coeval. Inner and outer disk stellar popu-lations is a less ambiguous definition for these sequences, as we have shown that calling the high-[Mg/Fe] sequence the chemical thick disk is a misleading and these populations are no thicker than the chemical thin disk for stars of the same age.
Acknowledgements. The authors thank Misha Haywood for providing derived ages from their 2013 paper and for useful discussions. M.R.H. and A.R.B. re-ceived financial support from ANR, reference 14-CE33-0014-01. This work has made use of data from the European Space Agency (ESA) mission Gaia (https://www.cosmos.esa.int/gaia), processed by the Gaia Data Pro-cessing and Analysis Consortium (DPAC;https://www.cosmos.esa.int/ web/gaia/dpac/consortium). Funding for the DPAC has been provided by national institutions, in particular the institutions participating in the Gaia Multilateral Agreement.
References
Adibekyan, V. Z., Santos, N. C., Sousa, S. G., & Israelian, G. 2011,A&A, 535, L11
Adibekyan, V. Z., Figueira, P., Santos, N. C., et al. 2013,A&A, 554, A44
Bailer-Jones, C. A. L. 2015,PASP, 127, 994
Bensby, T., Feltzing, S., & Lundström, I. 2003,A&A, 410, 527
Bensby, T., Zenn, A. R., Oey, M. S., & Feltzing, S. 2007,ApJ, 663, L13
Bovy, J. 2015,ApJS, 216, 29
Bovy, J., Rix, H.-W., Hogg, D. W., et al. 2012,ApJ, 755, 115
Bovy, J., Rix, H.-W., Schlafly, E. F., et al. 2016,ApJ, 823, 30
Chabrier, G. 2003,PASP, 115, 763
de Laverny, P., Recio-Blanco, A., Worley, C. C., et al. 2013,The Messenger, 153, 18
De Pascale, M., Worley, C. C., de Laverny, P., et al. 2014,A&A, 570, A68
Dotter, A., Chaboyer, B., Jevremovic, D., et al. 2008, ApJS, 178 Edvardsson, B., Andersen, J., Gustafsson, B., et al. 1993,A&A, 275, 101
Fuhrmann, K. 1998,A&A, 338, 161
Gaia Collaboration (Brown, A. G. A., et al.) 2016a,A&A, 595, A2
Gaia Collaboration (Prusti, T., et al.) 2016b,A&A, 595, A1
Gilmore, G., & Reid, N. 1983,MNRAS, 202, 1025
Girardi, L., Groenewegen, M. A. T., Hatziminaoglou, E., & Da Costa, L. 2005,
A&A, 436, 895
Guiglion, G., Recio-Blanco, A., de Laverny, P., et al. 2015,A&A, 583, A91
Hayden, M. R., Holtzman, J. A., Bovy, J., et al. 2014,AJ, 147, 116
Hayden, M. R., Bovy, J., Holtzman, J. A., et al. 2015,ApJ, 808, 132
Hayden, M., Recio-Blanco, A., de Laverny, P., et al. 2017, A&A, in press, DOI:10.1051/0004-6361/201730412
Haywood, M., Di Matteo, P., Lehnert, M. D., Katz, D., & Gómez, A. 2013,A&A, 560, A109
Haywood, M., Lehnert, M. D., Di Matteo, P., et al. 2016,A&A, 589, A66
Hernández, J. I. G., & Bonifacio, P. 2009,A&A, 497, 497
Jofré, P., Das, P., Bertranpetit, J., & Foley, R. 2017,MNRAS, 467, 1140
Jørgensen, B. R., & Lindegren, L. 2005,A&A, 436, 127
Kordopatis, G., Wyse, R. F. G., Gilmore, G., et al. 2015,A&A, 582, A122
Lindegren, L., Lammers, U., Bastian, U., et al. 2016,A&A, 595, A4
Mackereth, J. T., Bovy, J., Schiavon, R. P., et al. 2017,MNRAS, 471, 3057
Masseron, T., & Gilmore, G. 2015,MNRAS, 453, 1855
Mikolaitis, Š., de Laverny, P., Recio-Blanco, A., et al. 2017,A&A, 600, A22
Minchev, I., Martig, M., Streich, D., et al. 2015,ApJ, 804, L9
Nidever, D. L., Bovy, J., Bird, J. C., et al. 2014,ApJ, 796, 38
Recio-Blanco, A., Bijaoui, A., & De Laverny, P. 2006,MNRAS, 370, 141
Recio-Blanco, A., de Laverny, P., Kordopatis, G., et al. 2014,A&A, 567, A5
Rix, H.-W., & Bovy, J. 2013,A&ARv, 21, 61
Robin, A. C., Luri, X., Reylé, C., et al. 2012,A&A, 543, A100
Sellwood, J. A., & Binney, J. J. 2002,MNRAS, 336, 785
Yoshii, Y. 1982,PASJ, 34, 365
Appendix A: Ages
As noted above, we used Bayesian inference to determine ages to individual stars by comparing derived stellar parameters to isochrones. The Dartmouth isochrones (Dotter et al. 2008) used have metallicities ranging from −2.0 < [Fe/H] < 0.6 in steps of 0.1 dex, are linearly spaced in age in steps of 100 Myr from 0.1 Gyr to 15 Gyr, and have [Mg/Fe] spacing of 0.2 dex from 0.0 < [Mg/Fe] < 0.4. The isochrones and the AMBRE stellar parameters are on a slightly different temperature scale based on the V-K colors of the stars. We find an offset of 100 K using the color-temperature relations derived in Hernández & Bonifacio
(2009) between the temperatures derived from AMBRE and those of the isochrones, and apply a shift of 100 K to the Teffto place the derived AMBRE temperatures on the same scale as the isochrone temperatures. A complete description of the method, along with a catalog of the ages presented in this paper, will be described in a later paper (Hayden, in prep.).
To determine the stellar ages, we adopt several simple priors. We assume a uniform star formation history and additionally weight each isochrone point by mass using a Chabrier IMF
(Chabrier 2003). No prior for age as a function of metallicity
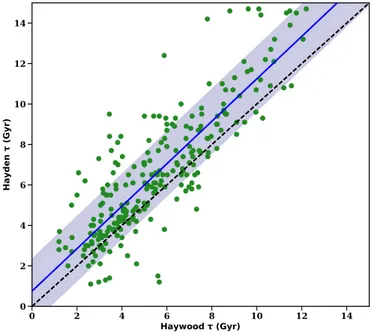
or [Mg/Fe] is used (i.e., we do not force a high-[Mg/Fe] or metal-poor star to be old). The mode of the generated PDF is used to characterize the age of an individual star. While carrying out tests with simulated observations using stars from TRILEGAL, we find ages are reliable (relative errors <1−2 Gyr) for turnoff and subgiant stars only, which are selected by re-quiring MJ < 3.75 and 3.6 < log g < 4.4. From our initial sample of nearly 1500 stars, 494 meet our selection criteria. Additionally, we compared these remaining stars to stars in common with (Haywood et al. 2013) as shown in Fig.A.1. We find a systematic offset of 1 Gyr, identical to the right panel of Fig. 3 ofHaywood et al.(2013) when comparing their method using Dartmouth and Y2 isochrones. Other than the systematic offset, the ages are very similar, with a linear 1:1 relation found
0 2 4 6 8 10 12 14 Haywood τ (Gyr) 0 2 4 6 8 10 12 14 H a y d e n τ (G y r)
Fig. A.1.Comparison between our derived ages and those provided by
Haywood et al.(2013). The dashed black line denotes the 1:1 relation,
while the blue line denotes the relation between our derived ages and those of Haywood with a slope of 1.03. The blue shaded region shows the 1σ scatter of 1.6 Gyr.
between the age estimates and a random scatter of 1.6 Gyr be-tween the samples, despite using independent stellar parameters, abundances, and isochrone sets. The largest outliers are driven primarily by differences in temperature between AMBRE and those adopted by Haywood et al. (2013). Additionally, for the oldest stars the different age ranges covered by the isochrones also has an impact.
![Fig. 1. [Mg / Fe] vs. [Fe / H] plane for the HARPS sample with reliable age estimates](https://thumb-eu.123doks.com/thumbv2/123doknet/13570701.421084/3.892.471.817.120.358/fig-mg-fe-plane-harps-sample-reliable-estimates.webp)
![Fig. 2. [Mg/Fe] vs. age relation for the HARPS sample, with stars color-coded by metallicity](https://thumb-eu.123doks.com/thumbv2/123doknet/13570701.421084/4.892.470.816.112.380/fig-relation-harps-sample-stars-color-coded-metallicity.webp)