THE CHOREOGRAPHY OF BELONGING: TOOTHED WHALE SPATIAL COHESION AND ACOUSTIC COMMUNICATION
By
Nicholas Blair Wootton Macfarlane
A.B., Princeton University, 2008
S.M., Massachusetts Institute of Technology, 2015
Submitted in partial fulfillment of the requirements for the degree of Doctor of Philosophy
at the
MASSACHUSETTS INSTITUTE OF TECHNOLOGY and the
WOODS HOLE OCEANOGRAPHIC INSTITUTION February 2016
0 2016 Nicholas B. W. Macfarlane All rights reserved.
The author hereby grants to MIT and WHOI permission to reproduce and to distribute publicly paper and electronic copies of this thesis document in whole or in part in any
medium now known or hereaf er created.
Signature of Author
Signature redacted
Certified by
Accepted by
Joint Program in Oceanog
Ocean Science and Engineering
VZ
Massachusetts Institute of Technology
and Woods Hole Oceanographic Institution
October 23, 2015
_Signature redacted
Dr. Peter L. TyackThesis Supervisor
Signature redacted
MASSACHUSETTS INSTITUTE OF TECHNOLOGYOCT 28 2015
LIBRARIES
Dr. Martin F. Polz Chair, Joint Committee for Biological Oceanography Massachusetts Institute of TechnologyTHE CHOREOGRAPHY OF BELONGING: TOOTHED WHALE SPATIAL COHESION AND ACOUSTIC COMMUNICATION
By
Nicholas Blair Wootton Macfarlane
Submitted to the MIT/WHOI Joint Program in Oceanography and Applied Ocean Science and Engineering on October 23, 2015 in partial fulfillment of the requirements
for the degree of Doctor of Philosophy in the field of Biological Oceanography
ABSTRACT
To maintain the benefits of group membership, social animals need mechanisms to stay together and reunite if separated. This thesis explores the acoustic signals that dolphins use to overcome this challenge and mediate their complex relationships in a dynamic 3D environment. Bottlenose dolphins are the most extensively studied toothed whale, but research on acoustic behavior has been limited by an inability to identify the vocalizing individual or measure inter-animal distances in the wild. This thesis resolves these problems by simultaneously deploying acoustic tags on closely-associated pairs of known animals. These first reported deployments of acoustic tags on dolphins allowed me to characterize temporal patterns of vocal behavior on an individual level, uncovering large variation in vocal rates and inter-call waiting time between animals. Looking more specifically at signature whistles, a type of call often linked to cohesion, I found that when one animal produced its own signature whistle, its partner was more likely to respond with its own whistle. To better evaluate potential cohesion functions for signature whistles, I then modeled the probability of an animal producing a signature whistle at different times during a temporary separation and reunion from its partner. These data suggest that dolphins use signature whistles to signal a motivation to reunite and to confirm identity prior to rejoining their partner. To examine how cohesion is maintained during separations that do not include whistles, I then investigated whether dolphins could keep track of their partners by passively listening to conspecific echolocation clicks. Using a multi-pronged approach, I demonstrated that the passive detection range of echolocation clicks overlaps with the typical separation ranges of Sarasota mother-calf pairs and that the amount of time since an animal was last able to detect a click from its partner helped explain its probability of producing a signature whistle. Finally, this thesis developed a portable stereo camera system to study cohesion in situations where tagging is not possible. Integrating a GPS receiver, an attitude sensor and 3D stereo photogrammetry, the system rapidly positions multiple animals, grounding behavioral observations in quantitative metrics and characterizing fine-scale changes that might otherwise be missed.
Thesis supervisor: Dr. Peter L. Tyack
Title: Senior Scientist Emeritus, Biology Department, Woods Hole Oceanographic Institution and Professor, Department of Biology, University of St Andrews
ACKNOWLEDGEMENTS
Although I am the one whose name appears on the dissertation, it could not have happened without dozens and dozens of people. I was blessed with an incredible advisor
in Peter Tyack who, despite moving to Scotland halfway through, was a never-ending font of creativity, inspiration and support. It has been an absolute delight and privilege to
spend so much time together over the last five years. Then, when he did leave, Frants Jensen stepped up to fill in the gaps and became one of the best surrogate advisors I could have imagined.
Each of my committee members, Laela Sayigh, Andy Solow, Jonathan Howland, Michael Moore and Stephanie Seneff, was carefully chosen because their expertise covered a critical part of the thesis, and they have been here through thick and thin, helping me gather disparate and challenging data and bring them together into a cohesive
story.
None of these data would exist without enormous field teams in Tarifa and Sarasota or the phenomenal amount of logistical support required for organizing and maintaining the expeditions. In Sarasota, it takes more than a hundred people on the water to tag a dolphin, and in Tarifa the fieldwork would have been impossible without the help of Philippe Verborgh, Pauline Gauffier and the rest of CIRCE. Then, once these data were collected, many students came through WHOI and helped with the herculean task of auditing and processing the acoustics.
Throughout the last five years, I have been supported and advised at every turn by the wonderful people working in the Academic Programs Office. Again and again they worked with me to transform the program in ways that dramatically improved my time here. It made an enormous difference to know that there were people in the
administration with my interests at heart.
Finally, I am deeply grateful to my family and friends both in Woods Hole and in Boston. They took a lonely path and, out of nothing, forged a strong inspiring
community. More than anything else, they are the reason I was able to accomplish this thesis.
This work was supported by the Office of Naval Research (NO00140910528 and N000141210417), the WHOI Marine Mammal Center, WHOI Biology Department, WHOI Academic Programs Endowed Funds, the MIT Martin Family Foundation for
Sustainability, the MIT Graduate Student Government, the Grossman Family Foundation, and the Danish Council for Independent Research (11-107628).
TABLE OF CONTENTS
A bstract... 3
A cknow ledgem ents ... 5
C hapter 1: Introduction ... 17
1.1 Introduction...18
1.2
References ... 24Chapter 2: Temporal Patterns in Bottlenose Dolphin Vocal Behavior ... 27
2.1 Abstract:...28
2.2 Introduction:...28
2.3 M ethods...34
2.3.1 Field site...34
2.3.2 Tag deploym ent ... 35
2.3.3 Data processing...36
2.3.4 Cue tim ing analysis approach... 38
2.3.4.1 Vocal rate ... 39
2.3.4.2 W aiting time and scaling... 39
2.3.4.3 Statistical methods used in this chapter... 43
2.3.4.4 Inter-animal calling effects... 44
2.3.5 Individually-specific m ark-recapture... 45
2.4 Results and discussion... 47
2.4.1 Results I: vocal rates... 47
2.4.2 Discussion I: vocal rates ... 50
2.4.3 Results II: waiting tim e distributions... 51
2.4.4 Discussion II: waiting tim e distributions ... 56
2.4.5 Results III: response latency and inter-anim al calling behavior... 58
2.4.6 Discussion III: response latency and inter-animal calling behavior ... 63
2.4.7 Results IV: individually-specific m ark recaptures... 64
2.4.8 Discussion IV : individually-specific m ark recaptures... 67
2.5 Conclusion...68
2.6 References ... 71
Chapter 3: A reunion calling function for signature whistles in wild bottlenose dolphins... 75
3.1 Abstract...76
3.2 Introduction ... 76
3.2.1 Signature whistles as candidates for a contact call function... 78
3.2.3 Separating a contact call function from stress ... 78
3.2.4 Defining contact call functions for signature whistles... 79
3.3 M ethods...81 3.3.1 Field Site ... 81 3.3.2 Data Collection ... 81 3.3.3 Analysis M ethod ... 82 3.3.4 M odel Fitting ... 85 3.4 Results ... 87 3.4.1 Description of Dataset ... 87
3.4.2 Data for M odel Fitting:... 90
3.4.3 Variable Selection Process and Results ... 91
3.5 Discussion...95
3.6 References:...101
Chapter 4: Do dolphins keep track of their partners by passively monitoring conspecific biosonar signals? ... . . . . .. . . .. . . .. . . .. . . .. . . . .. . . .. . . 105
4.1 Abstract...106
4.2 Introduction ... 106
4.3 Active Space...108
4.4 Data used in this chapter ... 111
4.5 Comparison between active and passive detection ranges ... 114
4.6 Empirical estimation of monitoring distance ... 116
4.6.1 Addressing directivity of dolphin biosonar ... 116
4.6.2 Empirical distribution of detection range for free-swimming dolphins ... 122
4.6.3 Probability distributions of maximum detection range... 123
4.6.4 Probability of click detection at a given range ... 126
4.7 Effect of echolocation monitoring on the probability of emitting signature whistles 128 4.8 Conclusion...129
4.9 References ... 131
Chapter 5: A 3D stereo camera system for precisely positioning animals in space and tim e... 133
5.1 Abstract...137
5.2 Introduction...137
5.3 System description ... 140
5.3.1 Overview of the system ... 140
5.3.2 Technical approach to photogrammetric ranging ... 142
5.3.3 System calibration...143
5.3.4 Analytical method...143
5.3.5 Accuracy considerations...146
5.4 Field test and example data...152
5.6 Aceknowledgements...160
5.7
E thical stan dards...1615.8
Conflict of interest...1615.9
References ... 162Chapter 6: Conclusion... ... 165
6.1 Framing rem arks ... 166
6.2 Ch apter synopses... ... 167
6.2.1 Chapter Two: Temporal patterns in bottlenose dolphin vocal behavior...167
6.2.2 Chapter Three: A reunion calling function for signature whistles in wild bottlenose d o lp h in s...16 8 6.2.3 Chapter Four: Do dolphins keep track of their partners by passively monitoring conspecific biosonar signals?... . . .. .. .. . .. .. . . .. .. . .. .. .. . .. . .. .. . .. .. . .. .170
6.2.4 Chapter Five: A 3D stereo camera system for precisely positioning animals in space an d tim e ... ... 17 1 6.3 General observations ... 171
6.3.1: Some observations on the rate-limiting steps of stereo photogrammetry and the potential for using drones to collect similar data...173
6.4 Future directions ... ... 175
LIST OF FIGURES
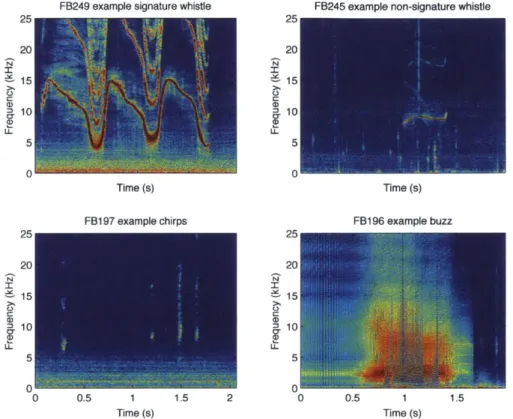
Figure 2.1: Examples of the 4 acoustic cue types analyzed in this chapter, signature whistles (upper left), non-signature whistles (upper right), chirps (lower left) and buzzes (lower right). ... 37 Figure 2.2: Illustration of waiting time (wt) method used in this chapter. Instances
of signature whistles (sw) during separate deployments are shown on timelines for FB185 (A) and FB282 (C). B and D show histograms of waiting time between focal signature whistles for these deployments. Note that the axes have different scales. The cumulative density function of the raw waiting time distribution for one animal at a time is plotted to characterize its shape (E shows distribution for FB185 deployment from A and B on a log scale). To combine and compare distributions between deployments and cue types, each distribution is normalized by its mean waiting time (F). The combined average scaled signature whistle curve is shown in green. Although this does not provide information on an absolute time scale, it allows comparison of the shape of individual and averaged waiting time distributions. The x-axis units are mean waiting times where
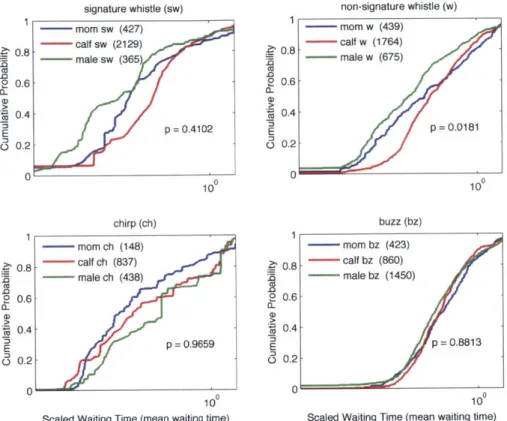
100 or 1 represents the mean waiting time for each distribution... 40 Figure 2.3: Scaled waiting time cumulative density functions across 12 tag
deployments averaged by demographic class for signature whistles (sw; upper left), non-signature whistles (w; upper right), chirps (ch; lower left) and buzzes (bz; lower right). P-values for a 3-sample Kolmogorov-Smirnov test are shown on each plot. Significant differences were only found between distributions averaged by demographic group for non-signature whistles (p = 0 .0 18 1)... 52 Figure 2.4: Within-animal pairwise comparisons of signature whistle and
non-signature whistle scaled waiting time distributions. Animals separated into mothers (upper left), calves (upper right) and males (lower left). Each line of the legend shows which curve was greater at the Kolmogorov-Smirnov statistic test point (>/<) and the p-value is shown in parentheses for a 2-sam p le test...53 Figure 2.5: Within-animal pairwise comparisons of signature whistle and chirp
scaled waiting time distributions. Animals separated into mothers (upper left), calves (upper right) and males (lower left). Each line of the legend shows which curve was greater at the Kolmogorov-Smirnov statistic test point (>/<) and the p-value is shown in parentheses for a 2-sample test... 54 Figure 2.6: Within-animal pairwise comparisons of non-signature whistle (w) and
chirp (ch) scaled waiting time distributions. Animals separated into mothers (upper left), calves (upper right) and males (lower left). Each line of the legend shows which curve was greater at the Kolmogorov-Smirnov statistic test point (>/<) and the p-value is shown in parentheses for a 2-sample test. ... 55
Figure 2.7: Histogram showing the distributions of inter-signature whistle waiting times for all animals within single individuals (blue) and between one individual producing a signature whistle and its partner responding with their ow n signature w histle (red)... 60 Figure 2.8: Signature whistle response latency distribution within animal pairs
(mother (M)-calf (C) on the left and male-male (ML) on the right). The p-value for a 2-sample Kolmogorov-Smirnov test for that pair's distribution is
shown in the upper left hand corner of each plot... 62 Figure 2.9: Probability of detecting an animal's signature whistle given a length
of recording from that animal. Legend is organized by mothers (M), calves (C ) and m ales (M L ). ... 65 Figure 2.10: Likelihood curves for estimating the number of individuals present,
given the number of signature whistles (sw) detected over 8min. Each curve represents the spread of individuals that could produce a particular number of
detected whistles. Note that the number of animals must be greater than or equal to the number of different detected signature whistles. ... 67 Figure 3.1: Log-survival plot of probability of inter-animal separation distance,
pooled across 32h of simultaneous tag deployments and 4 mother and calf pairs. A rapid change in slope occurs at 7m of separation... 84 Figure 3.2: Example separation and reunion for a mother (tt14_129a, black) and
her calf (tt14_129b, red). A. shows a 2D plan view of the animal tracks beginning at (0,0). B. translates the track to a separation-distance timeseries between the dolphins. C. shows the absolute value of the heading angle in radians for each animal with respect to its partner with 0 radians representing the animal pointing directly at its partner. D. represents the speed with which an animal is closing the distance towards its partner. On all plots the time points representing a separation distance of halfway to maximum separation (teal), maximum separation (blue) and halfway to reunion (black) are marked as dotted lines. Signature whistles for each animal are shown as red and b lack circles. ... 85 Figure 3.3: Autocorrelation function of the residuals for the final model,
demonstrating that any evidence for correlation is small. Dotted blue lines represent 5% significance level. ... 86 Figure 3.4: Simultaneous deployments on 4 mother-calf pairs: FB33 and FB282
(A, 2.82h, 4 complete separations); FB197 and FB243 (B, 18.18h, 6 complete separations); FB133 and FB245(C, 6.18h, 3 complete separations); FB185 and FB249 (D, 4.75h, 11 complete separations) Separations are shown in dark red, reunions in blue and other times in green. Times with insufficient data to estimate distance are left blank. Signature whistles for the mother (magenta) and calf (black) are shown as circles placed at the beginning of each whistle. Notice that the x-axis for D is shifted to zoom in on the period when separations and reunions were observed... 89
Figure 3.5. Signature whistle counts binned according to percent separation distance, suggesting a parametric quadratic regression as the basis for the m o d el...92 Figure 3.6: Logistic regression model of the probability of a signature whistle
during a separation-and-reunion event as a function of percent distance and whether or not the animal was in a separation or reunion. 95% confidence intervals are shown in red. Separations and reunions are shown separately. Note that the x-axis for reunions begins at 100 percent separation, so that the two plots mimic the overall shape of an event... 94 Figure 3.7: Excerpt from a tight bout of highly repeated signature whistles
produced by FB243 when the animals were less than 7m apart. FFT size 8192, Hanning window, temporal overlap of 90%. ... 96 Figure 4.1: Left, reconstructed and corrected track for a separation between
tt14_127a (mother, black) and tt14_127b (calf, red). Emitted clicks are green if detected, blue if missed. Upper right shows inter-animal separation distance vs time. Lower right shows absolute off-axis angle with respect to its partner with 0 being pointing directly towards it. Dotted lines connect 3 points at the same time across both tracks corresponding to 50% and 100% sep aration . ... 118 Figure 4.2: Back-calculated apparent source level (ASL) vs off-axis angle for
outgoing clicks from 3 sets of partnered animals (AB, CD, EF). Mothers are shown on the left and calves on the right. Points are color-coded according to transmission loss (TL). Clicks are aggregated across 3 (AB), 4 (CD) and 3
(EF) separation and reunion tracks. ... 119 Figure 4.3: Polar plots of horizontal off-axis angle (in degrees) for each detected
outgoing click emitted by the 3 sets of partnered animals shown in Figure 3 (AB, CD, EF). Zero degrees would be perfectly on-axis. Apparent source level (ASL) is shown in decreasing 10dB concentric contours, with the outer contour representing the maximum recorded ASL. Clicks emitted while pointing towards the receiving animal (-90* to +90') are colored blue. Clicks emitted while pointing away (+90' to -90') are colored red. ... 120 Figure 4.4: Pairs of mother and calf dolphins are often at separation distances
where they could use an echolocation monitoring strategy to track each other, but they also travel beyond that range. The maximum potential echolocation monitoring range is a function of the source level of the outgoing click, the transmission loss as it travels and the noise over which it must be detected at the receiver. The blue boxplot shows the distribution of maximum ranges at which each of the 13,082 emitted clicks would have been able to be detected above the noise on the receiver's tag at that point in time. Measured peak separations from mothers and calves are overlaid on the box plot as red dots. ... 122
Figure 4.5: Apparent source level (ASL) vs noise just prior to emitting a click for tt14_127a (top) and ttI4_127b (bottom )... 124 Figure 4.6: Probability density functions (PDF) of maximum detection ranges for
clicks emitted by each dolphin. PDF estimated from distribution of apparent source levels (ASL) and noise prior to emitted clicks as in Figure 4.5. Different functions are shown for clicks while pointing away from (red) and towards (blue) its partner. The smoothing for these functions used a Gaussian kernel with bandwidth chosen based on the number of clicks shown in p arenth eses... 12 5 Figure 4.7: Probability of an emitted click being detected at a given range while
the clicking dolphin is moving away and moving towards its partner. Clicks are aggregated across all animals and separations. Probabilities were calculated in bins of increasing size. The number of detected (blue and red)
and emitted clicks (black) in each bin are shown at the top of the plots. ... 127 Figure 5.1: Stereo camera geocoding system. a System in action collecting data
on a group of long-finned pilot whales, Globicephala melas. b System in parts shown w ithout w iring and battery... 140 Figure 5.2: Technical approach to photogrammetric ranging. A conceptual
illustration of photogrammetric ranging using a frontal parallel 2D view. Disparity between the corresponding images of the target in the two calibrated cameras, shown here by the difference between XL - XR allows
triangulation of the range in space (Z) according to the following equation:
Z =
fTXL
- XR wheref
is the focal length of the two cameras and T is the system baseline. ... 142 Figure 5.3: a Example stereo pair produced by the system from the left and rightcameras. The corresponding positions of an analysis point chosen from simultaneous images in both cameras are shown for which the system can produce geodetic coordinates. b Left camera view of the stereo pair in a with the whales' geodetic coordinates. c Whales from b mapped onto a plan view. The system was located at (1.9, -35.5). Several examples of inter-animal distance are also shown. Notice how difficult it would be to reproduce an accurate representation of position or distance by eye alone... 144 Figure 5.4: System accuracy at increasing range using a 50-cm baseline and
lenses with 2mm focal lengths. Five shore-based estimates were taken at 5-m intervals. a Syste5-m's esti5-mated range co5-mpared to actual range. The
dotted red line represents a hypothetical perfect estimate. b Absolute error
for each estimate at the intervals shown in a. The solid line is a linear best fit through the error scores. Average deviation ranged from 0.1 m at 5 to 3.2 m at a 50-m range. As with all stereo photogrammetric systems that rely on the disparity between two images in order to estimate distance, both accuracy
Figure 5.5: System accuracy at increasing range measured on the water in a calm sea state (Beaufort 2). a Absolute error of a distance measurement between 2 traffic cones placed 3 m apart (a relevant inter-animal distance) on shore at increasing ranges with the system deployed from a small unstable vessel. Assessing accuracy of range with the system at sea is challenging, for even a small anchored vessel will move about, and the measurement tool used will have its own error curves. Range for comparison with the system was measured with a range finder, but should be understood to include a range of values of +/- 3 to 4 m to account for boat movement. Distances were taken at opportunistic intervals when it was possible to stabilize the vessel as much as possible against moorings. The solid line is a linear best fit through the error scores. The average absolute value of the error ranged from 0.15 m at ~12 m up to 1.69 m at -63 m. To get a conservative estimate of geodetic location reconstruction accuracy, b shows absolute error of a geodetic coordinate calculated using the system compared with ones measured by placing the GPS receiver on top of the target. Like a, the positions were calculated at increasing distances from a target on shore. In addition to incorporating all measurement and location reconstruction error, this plot includes both error in the system GPS and again in the GPS measurement of the target's position without the system, leading to a conservative estimate. The solid line is a linear best fit through the error scores. Average absolute error ranged from 2.5 m at -9 m up to 25 m at -63 m, which is beyond the design range of a system w ith this baseline and focal length... 150
Figure 5.6: a Interpolated tracks of animal positions of a group of six known long-finned pilot whales over 15 min. Tracks are calculated from 336 measured positions across the 6 animals. Tracks are shown in Northing and Easting with respect to the initial position of the first animal sampled. Although the animals do not appear to have travelled far, they were swimming the entire time against a strong current. The circle, square, diamond and triangle markers represent identical points in time. b Dashed black line shows estimated inter-animal distance (in meters) between the mother and calf in Fig. a, calculated from 72 positions for the mother and 69 for the calf. Blue
solid line shows surface cohesion of the entire group over time. Group
dispersion was described as instantaneous group dispersion, defined as the RMS distance of individual positions relative to the group centroid at that instant in time. Note that this metric varies as a function of the number of individuals being tracked. Dispersion and distance were calculated using the
2D linear interpolated tracks from a ... 154
LIST OF TABLES
Table 2.1: Tag deployments used for analysis... 47 Table 2.2: Focal cue counts and rates of signature whistles (sw), non-signature
whistles (w), chirps (ch) and buzzes (bz) for analyzed tag data. The 6 simultaneously tagged pairs are shown in couplets shaded the same... 49 Table 2.3: Percent of inter-signature whistle-intervals described in this chapter
filtered and matched according to Janik, et al. (2013)... 57
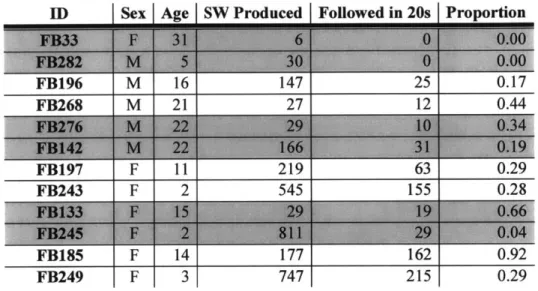
Table 2.4: Signature whistles produced by known animals and the number and proportion of those whistles that were followed by the simultaneously-tagged partner producing its own signature whistle within 20s. Partner couplets are shaded the sam e color ... 59
Table 2.5: Results for a rotation test on the null hypothesis that there is no effect of a partner producing a signature whistle on a dolphin's own signature whistle production in the following 5s. Each row shows the p-value for an animal's signature whistle production following its partner's signature whistle being greater than expected by chance... 61 Table 2.6: Continuous listening time in minutes required in order to detect an
animal's signature whistle a given percent of the time... 66 Table 3.1: Summary of simultaneous tag deployments on 9 mother and calf pairs
across the last 4 field seasons. Pairs included in the analysis are shaded gray... 88 Table 3.2: Counts of signature whistles produced by each tagged dolphin
throughout the entire set of simultaneous tag deployments. Counts are separated both by animal, age class and phase. Close represents all times when animals are not in a separation-reunion event as defined in the m ethods. M others are shaded gray... 90 Table 3.3. Summary of the binomial logistic regression model showing that the
probability of a signature whistle was best explained by percent distance and whether or not an animal was in a separation or a reunion... 93 Table 4.1: Summary of simultaneous tag deployments on 3 mother-calf pairs
whose reconstructed tracks are used in this chapter ... 112 Table 4.2. Summary of re-fitted binomial logistic regression model showing the
significant improvement coming from adding the silence variable (shaded)... 128
Chapter 1: Introduction
1.1
INTRODUCTION
Many animals live in groups that provide important benefits to individuals (Hamilton, 1971), such as decreased predation risk (Norris & Dohl, 1980; Senigaglia et al., 2012), cooperative foraging (Connor et al., 2000), and a reduced cost of movement (Krause & Ruxton, 2002). These benefits rely on animals being in the same place at the same time; therefore, to obtain the benefits of being a group member, an individual needs mechanisms for staying with a group or reuniting after separating (Da Cunha & Byrne, 2009). These requirements form a particularly complex problem for marine mammals who live in dynamic three-dimensional environments with no shelter (Norris & Schilt,
1988). This thesis is motivated by the question of how social bottlenose dolphins solve this essential problem and how it can be studied in the wild.
Bottlenose dolphins, Tursiops truncatus, are the most-studied odontocetes (Tyack, 2000; Janik, 2009). They live in complex fission-fusion societies where they form
LIL L11aiU~11L LI33kJ%1LLLik.jiia VV U iiLii LjiC UiiiLiimtia LAIH.. aLULH1 i CILikJiiiiii a VV Uli U'i LLLII
individuals (Connor et al., 2000; Mann et al., 2000). Mediating these strong social bonds in an otherwise fluid society (Wells et al., 1987; Wells, 2003) requires a mechanism for staying in contact. Underwater, light attenuates quickly, making vision impractical over even short distances, and dolphins only have primitive chemical senses, so this
mechanism will likely be acoustic (Janik, 2009).
Over the years, researchers have extensively studied bottlenose dolphin acoustic behavior (Herman & Tavolga, 1980; Tyack, 2000). Dolphins produce a large and varied repertoire of whistles, pulsed sounds and echolocation clicks (Janik, 2009). They are highly skilled at imitating both natural and artificial sounds (Lilly, 1965; Richards et al.,
1984; King et al., 2013) and are one of the few species of mammals shown to be capable of vocal learning (Janik & Slater, 1997). A primary focus of research has been signature whistles-stereotyped, learned, stable whistles that are specific to individuals (Caldwell & Caldwell, 1965; Caldwell et al., 1990; Janik & Sayigh, 2013). These whistles encode animal identity information (Caldwell et al., 1990; Sayigh et al., 1999), and have been associated with mediating cohesion in captive studies (Janik & Slater, 1998) and to a lesser degree in the wild (Smolker et al., 1993; Watwood et al., 2005). The ease of keeping bottlenose dolphins in captivity has contributed to their use as a model system for studying acoustic communication. Captive facilities can offer a level of experimental control and opportunity for observations that are challenging to replicate in the wild. However, it is unclear how easily studies conducted in captivity generalize to the natural world. If dolphins evolved these behaviors for use in their natural habitat, they will
ultimately need to be studied in the wild.
The fluid societies and three-dimensional environment that the animals encounter pose a problem for researchers as well as dolphins. Groups of social delphinids can number in the hundreds or thousands (Connor et al., 1998), and observations can usually only be conducted at the surface (but see Norris, 1974). Animals may only appear for fleeting instants, and it is not necessarily accurate to extrapolate surface behavior to the underwater world (Janik, 2009). In some species it can be extremely challenging to identify individual animals or even have a clear idea of group size, let alone a biologically relevant definition of group membership. Particularly problematic for studying acoustic communication, is the fact that it is often impossible to record all the sounds animals are producing, and only rarely can calls be attributed to individuals rather
than groups. Researchers frequently do not even know which animals are in the area, let alone where they are in space relative to each other. These issues often select for ad
libitum observations that are chosen based on what is possible to observe rather than what
is behaviorally significant.
In the most fundamental definition of communication, one actor produces a signal that transfers information to another one (Bradbury & Vehrenkamp, 1998). Therefore, at a primary level, studying acoustic communication requires identifying both the caller and the respondent. Meeting these requirements in wild animals suggests the need to simplify the study system, focusing on small groups of individuals that share a strong bond. This thesis will concentrate on closely associated pairs of dolphins that are highly motivated to
stay in touch-mother-calf pairs and male alliances. Mothers and calves associate very closely during the first couple years (Connor et al., 2000), and calves are vulnerable to
shark attack when separated (Connor et al., 2000; Heithaus, 2001). Some calves even remain dependent on their mothers for up to 10 years (Wells, 1991), and maintain close proximity until the mother becomes pregnant again (Wells et al., 1987). Male alliances are groups of two or three highly-associated individuals that cooperatively herd females. They often swim side by side less than a body length apart, and their strong bonds have been reported to last up to 13 years (Connor et al., 2000).
Acoustic tags, such as the Digital Acoustic Recording Tag (DTAG, Johnson & Tyack, 2003) help identify which animal produces a call and allow us to estimate the spatial positions of tagged animals. These tags are powerful tools for studying cetacean acoustic behavior, recording all the vocalizations of tagged and non-tagged animals, which can be linked with other tag data including depth, orientation and movement,
resolving many of the problems raised by studying diving marine animals from the surface (Johnson et al., 2009). However, it has proved extremely challenging to tag small delphinids like bottlenose dolphins (Schneider et al., 1998; Macfarlane, 2015).
That situation has now changed, and since 2011, we have been able to
simultaneously tag closely associated pairs of bottlenose dolphins during brief capture-releases as part of the Sarasota Dolphin Research Program health assessments (Scott et al., 1990). When I began my dissertation five years ago, we were testing initial
deployments with non-functioning prototype tags, but we have continually fine-tuned our protocol and can now achieve long simultaneous deployments on partnered animals where it is possible to attribute caller identity with high confidence. This thesis uses these tags to study the acoustic and spatial behavior of wild bottlenose dolphins.
Chapter Two takes advantage of this unique opportunity to identify the vocalizing individual in order to investigate temporal patterns of acoustic behavior. By deploying on-animal tags on pairs of closely-affiliated animals, for the first time, I am able to characterize the vocal production of wild free-swimming dolphins on an individual level. Large inter-animal variation was found in vocal behavior, highlighting the importance of using on-animal tags that capture almost every vocalization rather than generalizing from a group's overall recordings. I found that different types of acoustic cues have different characteristic timing distributions, suggesting that they are associated with different functions. Moreover, looking closely at the distribution of signature whistles, I find that when one animal produces its signature whistle, it increases the probability that its partner will respond with their own signature whistle. Timing differences in the latency of this response may reflect asymmetries in the relationship.
Chapter Three explores a contact calling function for signature whistles among wild dolphins. Signature whistles are a particularly well-studied call that have been generally associated with affiliation and social cohesion, making them likely candidates for signals that dolphins may use to maintain cohesion during separations. Using
simultaneous tagging techniques to hone in on the signature whistle behavior of mothers and calves allowed me to model specific functions of signature whistles during
separations and reunions, suggesting that they serve as reunion calls signaling a
motivation to reunite, as well as identity advertisement calls just prior to reuniting after a temporary separation.
The use of signature whistles for mediating separations and reunions begs the question of how dolphins reunite during separations that do not include whistles. Like other toothed whales, dolphins gather information about their environment from echolocation, and these sonar clicks are audible to other animals. Chapter Four
investigates whether dolphins could use these echolocation signals from conspecifics as a complementary mechanism to keep track of partners when separated. A multipronged approach demonstrates that despite individual needs to separate in order to forage, the
effective range of this listening strategy overlaps with the typical separation ranges of Sarasota mother-calf pairs. Incorporating echolocation monitoring into the model from Chapter Three helped explain the probability of an animal producing a signature whistle, suggesting that passively listening to a conspecific's biosonar clicks may help a dolphin to keep track of a partner.
Chapters Two, Three and Four have described simultaneous tag approaches to studying cohesion and communication, but there are many more situations where it is not
possible to tag all, or even any, animals in a group. How do we study cohesion when we cannot, or do not want to, tag animals but still need to know where they are? To address this question, Chapter Five developed a portable stereo camera system integrating a GPS receiver, an attitude sensor and three-dimensional stereo photogrammetry to estimate the position of multiple animals in space and time. In Chapter Five, I test the system,
describe its function and use it to measure group cohesion on long-finned pilot whales in the Strait of Gibraltar. The system can provide quantitative grounding for behavioral observations that generally rely on error-prone and imprecise human distance estimation, allowing researchers to characterize fine-scale behavior or detect changes as a result of disturbance that might otherwise be challenging to observe.
1.2
REFERENCES
Bradbury, J. W., & Vehrenkamp, S. L. (1998). Principles of acoustic communication. Sunderland, MA: Sinauer Associates.
Caldwell, M. C., & Caldwell, D. K. (1965). Individualized Whistle Contours in Bottle-Nosed Dolphins (Tursiops Truncatus). Nature, 207(4995), 434-&.
Caldwell, M. C., Caldwell, D. K., & Tyack, P. L. (1990). Review of the signature-whistle hypothesis for the Atlantic bottlenose dolphin. In S. Leatherwood & R. R. Reeves (Eds.), The Bottlenose Dolphin (pp. 199-234): New York: Academic Press. Connor, R. C., Mann, J., Tyack, P. L., & Whitehead, H. (1998). Social evolution in
toothed whales. Trends in Ecology & Evolution, 13(6), 228-232.
Connor, R. C., Wells, R. S., Mann, J., & Read, A. J. (2000). The Bottlenose Dolphin. In J. Mann, R. C. Connor, P. L. Tyack & H. Whitehead (Eds.), Cetacean Societies:
Field studies of whales and dolphins (pp. 91-126). Chicago: Univ. Chicago Press.
Da Cunha, R. G. T., & Byrne, R. W. (2009). The use of vocal communication in keeping the spatial cohesion of groups: Intentionality and specific functions. In P. A. Garber, A. Estrada, J. C. Bicca-Marques, E. W. Heymann & K. B. Strier (Eds.),
South American Primates (pp. 341-363): Springer New York.
Hamilton, W. D. (1971). Geometry for the selfish herd. Journal of Theoretical Biology,
31(2), 295-311.
Heithaus, M. R. (2001). Predator-prey and competitive interactions between sharks (order Selachii) and dolphins (suborder Odontoceti): a review. Journal ofZoology, 253,
53-68.
Herman, L. M., & Tavolga, W. N. (1980). The communication systems of cetaceans. In L. M. Herman (Ed.), Cetacean behavior: Mechanisms andfunctions (pp. 149-209). New York: John Wiley & Sons, Inc.
Jan i V M .(2 ) . A... .. .i. n M .N gi ... .J.k .
Clayton & K. Zuberbuhler (Eds.), Advances in the Study ofBehavior (Vol. 40, pp. 123-157): Academic Press.
Janik, V. M., & Sayigh, L. S. (2013). Communication in bottlenose dolphins: 50 years of signature whistle research. Journal of comparative physiology A, 199(6), 479-489. Janik, V. M., & Slater, P. J. (1998). Context-specific use suggests that bottlenose dolphin
signature whistles are cohesion calls. Animal Behaviour, 56, 829-83 8. Janik, V. M., & Slater, P. J. B. (1997). Vocal learning in mammals. In P. Slater, C.
Snowdon, J. Rosenblatt & M. Milinski (Eds.), Advances in the Study ofBehavior (Vol. 26, pp. 59-99). San Diego: Elsevier Academic Press.
Johnson, M. P., Aguilar de Soto, N., & Madsen, P. (2009). Studying the behaviour and sensory ecology of marine mammals using acoustic recording tags: a review.
Marine Ecology Progress Series, 395, 5 5-73.
King, S. L., Sayigh, L. S., Wells, R. S., Fellner, W., & Janik, V. M. (2013). Vocal copying of individually distinctive signature whistles in bottlenose dolphins.
Proceedings of the Royal Society B: Biological Sciences, 280(1757).
Krause, J., & Ruxton, G. D. (2002). Living in groups: Oxford University Press.
Lilly, J. C. (1965). Vocal mimicry in tursiops: Ability to match numbers and durations of human vocal bursts. Science, 147(3655), 300-301.
Macfarlane, N. B. W. (2015). Tagging wild cetaceans: investigating the balance between
more and less invasive techniques. (SM), Massachusetts Institute of Technology.
Mann, J., Connor, R. C., Tyack, P. L., & Whitehead, H. (2000). Cetacean Societies. Field
studies of dolphins and whales. Chicago: University of Chicago Press.
Norris, K., & Dohl, T. (1980). The structure and functions of cetacean schools. In L. Herman (Ed.), Cetacean behavior: Mechanisms andfunctions (pp. 211-261). New York: John Wiley and Sons.
Norris, K. S. (1974). The Porpoise Watcher: A Naturalist's Experiences with Porpoises and Whales: New York: WW Norton.
Norris, K. S., & Schilt, C. R. (1988). Cooperative societies in three-dimensional space: on the origins of aggregations, flocks, and schools, with special reference to dolphins and fish. Ethology and Sociobiology, 9(2), 149-179.
Richards, D. G., Wolz, J. P., & Herman, L. M. (1984). Vocal mimicry of computer-generated sounds and vocal labeling of objects by a bottlenosed dolphin, Tursiops truncatus. Journal of Comparative Psychology, 98(1), 10.
Sayigh, L. S., Tyack, P. L., Wells, R. S., Solow, A. R., Scott, M. D., & Irvine, A. B. (1999). Individual recognition in wild bottlenose dolphins: a field test using playback experiments. Animal Behaviour, 57(1), 41-50.
Schneider, K., Baird, R. W., Dawson, S., Visser, I., & Childerhouse, S. (1998). Reactions of bottlenose dolphins to tagging attempts using a remotely-deployed suction-cup
tag. Marine Mammal Science, 14(2), 316-324.
Scott, M., Wells, R., & Irvine, A. B. (1990). A long-term study of bottlenose dolphins on the West coast of Florida. In S. Leatherwood & R. R. Reeves (Eds.), The
bottlenose dolphin (pp. 235-244). San Diego: Academic Press.
Senigaglia, V., de Stephanis, R., Verborgh, P., & Lusseau, D. (2012). The role of synchronized swimming as affiliative and anti-predatory behavior in long-finned pilot whales. Behav Processes, 91(1), 8-14.
Smolker, R., Mann, J., & Smuts, B. (1993). Use of signature whistles during separations and reunions by wild bottlenose dolphin mothers and infants. Behavioral Ecology
and Sociobiology, 33(6), 393-402.
Tyack, P. L. (2000). Functional aspects of cetacean communication. In J. Mann, R. C. Connor, P. L. Tyack & H. Whitehead (Eds.), Cetacean Societies: Field studies of
whales and dolphins (pp. 270-307). Chicago: University of Chicago Press.
Watwood, S. L., Owen, E. C. G., Tyack, P. L., & Wells, R. S. (2005). Signature whistle use by temporarily restrained and free-swimming bottlenose dolphins, Tursiops
truncatus. Animal Behaviour, 69, 1373-1386.
Wells, R. S. (1991). The role of long-term study in understanding the social structure of a bottlenose dolphin community. In K. Pryor & K. Norris (Eds.), Dolphin societies:
discoveries andpuzzles (pp. 199-225). Berkeley: University of California Press.
Wells, R. S. (2003). Dolphin social complexity: lessons from long-term study and life-history. In F. B. M. De Waal & P. L. Tyack (Eds.), Animal social complexity:
intelligence, culture, and individualized societies. Cambridge: Harvard University
Press.
Wells, R. S., Scott, M., & Irvine, A. (1987). The social structure of free-ranging bottlenose dolphins. Current mammalogy, 1, 247-305.
Chapter 2: Temporal Patterns in
Bottlenose Dolphin Vocal Behavior
2.1
ABSTRACT:
Bottlenose dolphins are the most widely studied toothed whale. However, research on communication has been severely limited by an inability to identify which animal has made a particular call. Simultaneously deploying acoustic recording tags on multiple animals can resolve this issue, but it has proved extremely challenging to tag small delphinids with suction-cup tags. Recently, that situation has changed, and in this chapter I report some of the general results and lessons from 42 successful tag deployments over the last four years as part of the Sarasota Dolphin Research Program. Large individual variability was found in vocal behavior, underlining the importance of attributing calls to particular animals. This chapter first analyzes individual call rates and then explores the inter-call-interval distribution to describe differences between the timing of different types of calls that are consistent with different usage and functions. Working with pairs of closely-affiliated animals, I found that one animal's signature whistle increases the probability of its partner producing its own signature whistle, and I describe asymmetries in response latency that may reflect differences in dominance or motivational state. Finally, passive acoustic monitoring is an increasingly common approach for estimating animal abundance. To consider the added value of knowing individual signature whistles for a mark-recapture estimate, this chapter investigates the inter-animal variability in the probability of detecting a signature whistle, tracking this uncertainty through simulated likelihood functions of the number of animals producing a given number of detected whistles.
2.2
INTRODUCTION:
The bottlenose dolphin, Tursiops truncatus, is the most widely studied
odontocete, and over the years researchers have extensively explored its echolocation and acoustic communication behavior (Tyack, 2000; Janik, 2009). Across the decades of research on dolphin communication, studies have been hampered by a fundamental
limitation in observational methods. Understanding communication requires identifying which individual makes which call, and how other individuals respond to each call. This
is difficult to do with dolphins, especially in the field. Not only are individuals often out of sight underwater, but even when they are visible, they seldom make visible cues when
producing a sound. In this chapter I describe efforts and results from the last four years of addressing this problem using on-animal acoustic tags.
Simultaneously deploying acoustic recording tags, such as the Digital Acoustic Recording Tag (DTAG), on multiple animals helps resolve issues with identifying which animal produces a call and with measuring vocal and non-vocal responses to calls in the wild. These tags are powerful tools for studying cetacean acoustic communication and behavior (Johnson & Tyack, 2003; Johnson et al., 2009). They allow us to record vocalizations of tagged and non-tagged animals, which can be linked with data provided by tag sensors including depth, orientation and movement.
However, it has proved very difficult to tag small delphinids with suction-cup tags. In one of the few published studies, Schneider et al. (1998) deployed a suction-cup tag on bow-riding bottlenose dolphins. The dolphins reacted by increasing swimming speed, leaping and diving and avoiding the boat. I observed a similar reaction when tags were deployed on four short-beaked common dolphins (Delphinus delphis) in the Bay of Algeciras, Spain. The dolphins were bow-riding directly alongside the boat, and the tags were very gently deployed using a pole. Nevertheless, the tagged dolphins immediately twisted and turned, quickly accelerating and breaching out of the water until the tags were shed (Macfarlane, 2015).
Our understanding of dolphin acoustic communication and behavior has suffered from our inability to deploy on-animal acoustic tags. However, recently that situation has changed, and since 2011 we have been able to successfully tag bottlenose dolphins
(Tursiops truncatus) as part of the Sarasota Dolphin Research Program (SDRP, see Scott
et al., 1990). This change resulted from a new, smaller version of the DTAG, with half
the volume, that was possible to deploy on smaller cetaceans such as bottlenose dolphins, achieving attachment times of up to 24h when animals were tagged during the Sarasota Health Assessments described in 2.3.1. Although these tags are attached with suction cups, "computer tomographic scans of DTAG suction cups attached to the integument of a common dolphin cadaver showed consistent deformation of the skin, blubber and underlying muscle up into the dome of the cup" (Moore, MJ P. Comm, Oct 20, 2015). Therefore, these tags can potentially impact the animals. It is difficult to measure the extent to which the DTAGs affect the behavior of these wild dolphins, since our most accurate measures of their behavior come from the tags themselves. However, a captive study on male bottlenose dolphins found that the animals reduced their swimming speed when wearing tags, likely in order to compensate for the increased drag (van der Hoop et al., 2014). Thus, there may be some potential effects of the tag on the animal behavior; however, at present on-animal tagging is the only way to collect the data described in this thesis. In this chapter, I will describe some of the results and lessons from the first four years of successful deployments.
Bottlenose dolphins have a large and varied vocal repertoire (Tyack & Clark, 2000). Much research has focused on individually-distinctive signature whistles that appear to be related to cohesion and are produced in high numbers when animals are
isolated or stressed (Chapter Three). However, little is known about other categories of calls, such as non-signature whistles or chirps, and without being able to consistently identify the vocalizing animal in wild dolphins, even generalizing signature whistle vocal behavior from the lab to the field is challenging. To further explore the function of this
varied repertoire, this chapter will ask if and how different categories of calls are used differently.
Inter-call timing between a sequence of the same type of vocalization emitted by the same animal is a powerful way to look for these usage differences. Animal signals are often modulated by repetition rate or interval, and repetition appears to be biologically important, with a lone signal potentially conveying a different meaning than a clustered or repeated one (Beeman, 1998; Bradbury & Vehrenkamp, 1998). Timing can be affected by internal or external factors, such as behavioral state (Cook et al., 2004) or activity context (Herman & Tavolga, 1980). For example meerkats (Manser, 2001), lemurs (Macedonia, 1990), and Colobus monkeys (Schel et al., 2010) all make highly repeated alarm calls when threatened. In other species, this inter-call waiting time can in turn convey information, with the rate and composition of mobbing calls in chickadees indicating the urgency of a threat (Templeton et al., 2005; Krams et al., 2012), and the delay between calls changing with escalation of aggression in howler monkeys (Kitchen, 2004). If different calls are used for different functions, they might be expected to have different characteristic inter-call-interval distributions. A note on terminology: in this chapter I will be analyzing these intervals using statistical methods for describing waiting time; therefore, I will refer to the distribution of intervals as the waiting time distribution.
Two possible contrasts in the waiting time distributions are differences between demographic groups or between vocalization types. Demographic classes often
experience different social situations, or even the same situation in different ways, leading to differences in overall vocal rate and call usage in species ranging from Japanese macaques (Green, 1981) to Elk (Bowyer & Kitchen, 1987). Likewise, different
time courses have been reported for different vocalization types in a variety of species such as chickens (Evans et al., 1993) and squirrels (Sherman, 1977). In bottlenose dolphins, Janik et al. (2013) examined inter-call intervals and reported that when the majority of a bout contained repeated calls separated by 1-10s, the calls were most likely to be signature whistles. Calls separated by an inter-call-interval of less than one or more than ten seconds were less likely to be signature whistles, supporting the idea that waiting time distributions may reflect different call types and functions in this species.
Different kinds of functions would likely impact the waiting time distributions. Bradbury and Vehrenkamp (1998) suggest that calls triggered by an external event, such as alarm calls, would probably be clustered in tight bouts with long periods of silence between triggers. In contrast, general assembly calls, such as the clucking food calls of jungle fowl, would occur at low repetition rates not necessarily clustered as tightly
(Bradbury & Vehrenkamp, 1998). A similar pattern with no tight clustering might be observed for a type of contact call where the animals are simply keeping track of each other through spontaneous calling. However, a call whose function was to elicit a behavioral change in another animal, such as a motivation to reunite (Chapter Three), might demand a response, in which case more than one could be necessary if the partner was not responding. This could lead to a clustered distribution more akin to an alarm call. In this way, differences in timing are connected to differences in usage. This chapter will first explore whether these differences exist for different categories of bottlenose dolphin vocalizations or between different demographic classes.
Working with pairs of simultaneously tagged closely-affiliated animals, I will then look within a standard two-way model of communication where a sender produces a
signal, and the recipient signals back (Bradbury & Vehrenkamp, 1998). I will consider the case of vocal matching where both sender and receiver produce the same class of signal. Vocal-matching of this kind has been observed in many species such as killer whales (Miller et al., 2004) and bottlenose dolphins (Janik & Slater, 1998; Quick & Janik, 2012; King et al., 2014). Nakahara and Miyazaki (2011) reported that captive animals tended to use their own signature whistles during these sequences. If the signal is demanding a response, maybe one animal is attempting to elicit a behavioral change, and the partner needs to respond. Looking into signature whistle distributions of partnered animals, I will investigate whether the receiver is more likely to produce its own
signature whistle within a certain time window after the sender emits a signature whistle, and if there are any asymmetries in vocal exchanges elicited within partners that might imply a hierarchical relationship or varying levels of motivation to remain cohesive.
Finally, the timing distributions can be used to help explore the potential for individually-specific mark recapture studies of bottlenose dolphins using passive acoustic monitoring. Increasingly, passive acoustic monitoring is emerging as an affordable way to assess marine mammal abundance (Mellinger et al., 2007; Thomas et al., 2012; Marques et al., 2013). This approach has several advantages over traditional visual surveys, such as the ability to sample in rough weather, at night, or over long periods of time. In particular, the individually-distinctive signature whistles of bottlenose dolphins may provide the opportunity for acoustic mark-recapture abundance estimates (Marques et al., 2013).
In the simplest form of Lincoln Peterson mark-recapture (for an overview see Marques et al., 2013), an initial sample of individually-identified animals is detected in
an area; for example, by using passive acoustic monitors. Assuming random animal mixing, the proportion of animals in subsequent samples that are composed of the initially sampled ("marked") animals is used to estimate the proportion of marked animals relative to the entire population and by extension the population size. At its basic level, this method requires an individually-recognizable signal (signature whistles in this case) and a measure of the probability of detecting an animal given that it is in the area. The last requirement leads to a key assumption for mark-recapture: the probability of detecting an animal is assumed to be the same for all animals. If this assumption is not met, probability of detection will be biased towards easily detectable animals and population underestimated (Link, 2003; Marques et al., 2013). This assumption is stretched when animal home ranges are at different distances from the detector and when some animals' calling behavior gives them a higher probability of detection. Spatially-explicit capture-recapture methods that incorporate detector location into the estimates can mitigate the former (Borchers, 2012), but attempts to model the latter are challenging (Link, 2003). Here I will use our tag data to explore heterogeneity in the probability of detection stemming from the variability of signature whistle production across different bottlenose dolphins.
2.3
METHODS
2.3.1 Field site
Bottlenose dolphins develop strong social bonds between individuals within an otherwise fluid society (Wells et al., 1987; Wells, 2003). Studying communication therefore requires a long-term study of social relationships between identified individuals
who can be followed longitudinally. Since 1970, the resident bottlenose dolphin
community in Sarasota Bay, Florida has been the subject of the world's longest-running study of a dolphin population (Scott et al., 1990; Wells, 1991; Wells, 2003). Currently, about 165 dolphins reside in Sarasota Bay (Wells, 2009). Some of these individuals have been observed for more than 40 years, and the community includes individuals of up to
65 years of age. More than 270 residents have been temporarily captured for health
assessments and life history studies and released back into the wild, in many cases repeatedly over decades (Wells et al., 2004). During these brief capture-release events, dolphins are encircled in shallow water with a 500 m x 4 m seine net. Individuals are then held in the water or brought aboard a specially designed veterinary examination vessel. Sounds from individual dolphins are recorded using hydrophones attached directly to the animal's head with a suction cup. These recordings provide a complete record of all whistles produced by each individual during the capture-release event. Thus, nearly every dolphin in the Sarasota community is linked to a rich set of life history, social association from long-term surveys, and communication data.
2.3.2 Tag deployment
Wild bottlenose dolphins were tagged during these brief capture-release events. Prior to release, a suction-cup DTAG-3 acoustic and kinematic tag (Johnson & Tyack, 2003) was carefully placed by hand in front of each dolphin's dorsal fin while handlers held the animal in the water. This chapter will focus on simultaneous tagouts of closely-associated mothers and calves or pairs of allied males. After release, the animals were radio-tracked from a small outboard-powered boat. During daylight hours, visual observations of group size, spread, synchrony, activity, nearest-neighbor distance and
nearest-neighbor identity were collected at three to five-minute intervals in order to provide social context for the tag record. Upon release from the animal, tags were recovered by locating the VHF signal, data were downloaded for analysis, and the tags were prepared for another deployment.
2.3.3 Data processing
Acoustic and sensor data were processed and analyzed using custom programs written in MATLAB (Mathworks, Natick, MA). Call types were defined by observing spectrograms and listening to recordings in 10s increments. This chapter will focus on four types of signals, signature whistles, non-signature whistles, chirps, and echolocation buzzes (Figure 2.1).
25 25 20 20 10 10 U_ LL 5 5 0 0 Time (s) Time (s)
FBI 97 example chirps FB196 example buzz
25 25 20 20 15 15 10 10 LLL 5 5 0 0 0 0.5 1 1.5 2 0 0.5 1 1.5 Time (s) Time (s)