HAL Id: hal-00649827
https://hal.archives-ouvertes.fr/hal-00649827
Submitted on 6 Mar 2012
HAL is a multi-disciplinary open access
archive for the deposit and dissemination of
sci-entific research documents, whether they are
pub-lished or not. The documents may come from
teaching and research institutions in France or
abroad, or from public or private research centers.
L’archive ouverte pluridisciplinaire HAL, est
destinée au dépôt et à la diffusion de documents
scientifiques de niveau recherche, publiés ou non,
émanant des établissements d’enseignement et de
recherche français ou étrangers, des laboratoires
publics ou privés.
Impact of respiratory motion correction on the detection
of small lesions in whole-body PET imaging: A
simulation study
Simon Marache-Francisco, Frédéric Lamare, Hadi Fayad, Dimitris Visvikis,
Rémy Prost, Jean-Michel Rouet, Carole Lartizien
To cite this version:
Simon Marache-Francisco, Frédéric Lamare, Hadi Fayad, Dimitris Visvikis, Rémy Prost, et al.. Impact
of respiratory motion correction on the detection of small lesions in whole-body PET imaging: A
simu-lation study. 2010 IEEE Nuclear Science Symposium (NSS) and Medical Imaging Conference (MIC).,
Oct 2010, Knoxville, Tenessee, United States. pp.3531 - 3533, �10.1109/NSSMIC.2010.5874465�.
�hal-00649827�
S. Marache-Francisco, Member IEEE , F. Lamare, H. Fayad, Member IEEE, D. Visvikis, Senior Member IEEE, R.
Prost, Member IEEE, J.-M. Rouet, C. Lartizien
Abstract–Respiratory motion in Positron Emission Tomography leads to reduced image quality, influencing this way the quantitative accuracy of PET measurements, as shown in numerous studies. However, only few results have been published on its impact on lesion detection. This study intends to evaluate the impact of motion correction on the detection of small lesions (between 8 and 12 mm diameter) using a Computed-Aided Detection (CAD) system on FDG whole-body simulated PET images. We evaluate two types of motion correction techniques, both using motion fields derived from the reconstruction of gated PET images. The first technique consists in averaging the co-registered gated reconstructed PET images, while the second method integrates the motion fields during the iterative reconstruction process.
I. INTRODUCTION
espiratory motion in emission tomography leads to image blurring especially in the lower thorax and the upper abdomen, influencing this way the quantitative accuracy of PET measurements as well a leading to a loss of sensitivity in lesion detection [1]. Although PET exams are getting shorter thanks to the improvement of scanner sensitivity, the current 2-3 minutes acquisitions per bed position are not yet compatible with patient breath-holding. Performing accurate respiratory motion correction without impairing the standard clinical protocol, i.e. without increasing the acquisition time, thus remains challenging.
Different types of respiratory motion correction approaches have been proposed mostly based on the use of non-rigid deformation fields either applied to the gated PET images or integrated during an iterative reconstruction algorithm. Evaluation of these methods has been mainly focusing on the quantification and localization accuracy of small lesions, but their impact on the clinician detection performance during the diagnostic task has not been fully investigated yet. The purpose of this study is to address this question based on a computer assisted detection study.
S. M.-F. and J.-M. R. are with Medisys, Philips Healthcare, Suresnes, France (e-mail: simon.marache@creatis.insa-lyon.fr)
S. M.-F, R. P. and C. L. are with the CREATIS laboratory, Lyon University, CNRS UMR 5220, INSERM U630, INSA de Lyon, Villeurbanne, France ( e-mail: carole.lartizien@creatis.insa-lyon.fr).
F. L. is with nuclear medicine department, university hospital of Bordeaux, France
H. F. and D. V. are with the LaTIM, INSERM U 650, Brest, France (e-mail: Visvikis.Dimitris@univ-brest.fr).
We evaluate the influence of two motion correction methods on the detection of small lesions in human oncology FDG PET images. This study is based on a series of realistic simulated whole-body FDG images based on the XCAT model [2].
Detection performance is evaluated with a computer-aided detection system that we are developing for whole-body PET/CT images. Detection performances achieved with these two correction methods are compared with those achieved without correction, i.e. with respiration average PET images as well as with reference images that do not model respiration effects. The use of simulated data makes possible the creation of theses perfectly corrected images and the definition of known lesions locations that serve as a reference. This evaluation relies on the visual analysis of the binary detection maps derived from the CAD system and a Free-Response Receiver Operating Characteristic (FROC) analysis [3].
II. MATERIALANDMETHODS
A. Motion Correction Methods
The two motion correction methods considered rely on the estimation of elastic transformation fields which are subsequently exploited either to register the reconstructed PET gated images to the first frame (ET-IM for Elastic Transformation applied on the reconstructed Image) or the detected lines of responses during the reconstruction process (ET-LOR). In this study, the elastic transformation field is computed from the gated PET reconstructed images without attenuation correction to get rid of the motion artifacts that would be generated, with a respiratory cycle sampling of 8 frames. The transformation fields are computed using the method described in [4], where the transformation is decomposed over a B-spline basis.
The ET-IM method is implemented as follows: The frame of reference corresponds to the end of the exhalation phase. The 8 temporal frames are first reconstructed without attenuation correction. An elastic transformation is computed between the considered frames (2 to 8) and the reference one (frame 1) using a spatio-temporal non-rigid parametric registration algorithm [4] on the attenuation-uncorrected PET images
These fields are then applied to warp the static attenuation images from each temporal frame of the PET images and reconstruct each PET frame with attenuation correction. The
Impact of respiratory motion correction on the
detection of small lesions in whole-body PET
imaging: a simulation study
same deformation field is also used to register all PET reconstructed images to the reference one.
The ET-LOR method [5] integrates the elastic deformation field in the system reconstruction matrix of the one-pass list mode EM (OPL-EM) reconstruction algorithm [6] using a direct calculation of the system matrix coefficients. This method has been shown to lead to a 30% contrast gain as compared to the first post-processing method.
B. The PET Computer-Aided Detection (CAD) system
Fig. 1: General scheme of the PET CAD system
The overall CAD scheme that we developed is schematized on Fig. 1 (see [7]). This CAD system is based on the support vector machine (SVM) classifier and uses the coefficients of an undecimated 3D wavelet transform of the images as discriminant image features. The classifier is trained to produce a probability detection map for each test image. A threshold is then applied to these probability maps to generate binary detection maps (0/1 : lesion absent/present).
C. The simulated PET image database
This study is based on a series of simulated PET data based on the XCAT model [2]. These new data aim at completing the OncoPET DB database [8]. They include inter-individual anatomy and tracer uptake variability as well as respiratory motion. A full description of the models generation can be found in [8] and in [9]. In order to take into consideration the non-uniform nature of realistic respiratory signals, patient specific signals were incorporated into the XCAT model. Each respiratory cycle was divided into 8 bins with the same temporal duration, and one phantom was created for each of the 8 instances of the respiratory cycle Figure 3 describes the implementation of the simulated respiratory cycle. The respiratory pattern was repeated 10 times to simulate a 224s (3.7 min.) list-mode acquisition scan (each coincidence event is recorded separately). Each respiratory cycle was divided into 8 bins with the same temporal duration of 2.8s. (22.4s / 8 bins), and one PET emission List-mode file was created for each of the 8 instances of each respiratory cycle.
Lesions are randomly distributed in the lungs and the liver with diameters varying between 8 and 12 mm and with 5 different contrasts per diameter and per organ which were derived from a human observer detection study so as to cover the entire range of detectability. As an example, lungs tumors
have a contrast ranging from 6.5 to 8 for the 8 mm diameter ones and from 3.25 to 5.75 for the 12 mm diameter ones. Liver tumors have a contrast between 1.56 and 2.56 for a diameter of 12 mm. These contrasts were calibrated based on series of preliminary 3D PET data simulated without respiratory motion.
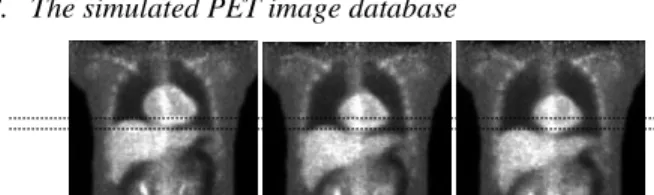
The simulated database was generated with the PET-SORTEO Monte-Carlo simulation tool that was fully validated against the geometry of the PET/CT Philips GEMINI system (Philips Medical Systems, Cleveland, OH) [10]. Figure 2 illustrates one coronal slice of a simulated pathological model with inserted lesions. The extent of the motion at the diaphragm is 2 cm.
Fig. 3: Simulated Respiratory cycle
D. Detection performance analysis
The final output of the CAD system is a 3D binary map (lesion present/absent) corresponding to each unknown test image. The aspect of these maps superimposed to the corresponding original images was observed. A quantitative evaluation of the detection performance was also conducted based on a FROC analysis [3]. The FROC curve plots the probability of a correct target report as a function of the mean number of false positive clusters per 3D image (referred to as FPI in the following) while varying the percentile threshold applied to the score map. FROC curves were derived for the two series of motion corrected images with the ET-IM and ET-LOR methods to evaluate the detection performance achieved with the different strategies of respiratory motion correction methods. They were also compared to the detection performances achieved with images that were not corrected for respiratory motion.
III. RESULTS
The simulated PET image database contains 7 data series (40 lung tumors, 38 liver tumors). The simulation and reconstruction time for one whole-body acquisition is about 20 hours on a standard 2.5GHz computer. Figure 4 shows an example of a reconstructed coronal slice of one breathing model showing the image corrected with ET-LOR (a) and ET-IM (b) as well as the respiration-average image (non corrected) (c). We can see that although clearly visible on the corrected ET-LOR image, the tumor can hardly be seen on the uncorrected image and ET-IM image. Figure 5 shows line profiles across a liver lesion. On the uncorrected image, the tumor is not distinguishable from the noise, while the two corrected and the static images show a peak near the lesion location.
Fig. 2. Coronal slices of a simulated PET pathological image at three different steps of the respiratory cycle.
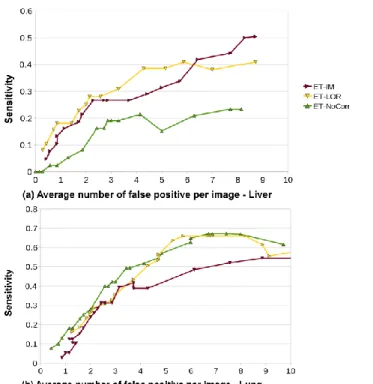
Results of the FROC analysis reported on Fig. 6 are contrasted: for the liver, the maximal detection rates are low (30-50%), but motion-correction techniques show a clear improvement as compared to non-corrected images. Maximal detection rates in the lungs are higher (55-67%) but the influence of ET-LOR and ET-IM is less evident. ET-IM is even shown to degrade the detection performances achieved with non-corrected images. One potential explanation to these differences is that most of the liver lesions are located much closer to the moving diaphragm than the lungs lesions which were randomly spread in the whole lungs volume. The simulated liver tumors are thus more likely to be impacted by motion respiration. Also note that ET-LOR shows higher performances that ET-IM in both cases.
IV. CONCLUSION AND PERSPECTIVES
These results were based on a very small patient data set (7 models) and should thus be considered as very preliminary. The overall detection sensitivity is low, but this can be explained by the small volume and small contrast of some of the tumors. This can also be explained by the fact that the estimated motion fields are not perfect, since the estimation is made on uncorrected reconstructed PET images with a very short acquisition time (28 s.), contrary to other studies using 4D-CT scans. A separate study will evaluate the quality of these deformation fields. Furthermore, motion estimation will also be improved by computing a whole-body motion field instead of doing a bed to bed registration as done in this study.
This study will be continued with more data to get quantitative results. Non-breathing models will also be compared to the ET-LOR, ET-IM and non-corrected images.
Regarding the CAD system, other image features could be used in conjunction with wavelets to improve tumors detectability.
V. REFERENCES
[1] Nehmeh S, Erdi Y, Ling C et Al., “Effect of respiratory gating on reducing lung motion artefacts in PET imaging of lung cancer”, Med.Phys,, vol. 29, p 366, 2002
[2] Segars WP, Mahesh M., Beck, T et Al., “Realistic CT simulation using the 4D XCAT phantom”, Med.Phys, vol.35, p. 3800, 2008. [3] R. G. Swensson, "Unified measurement of observer performance in
detecting and localizing target objects on images," Medical Physics, vol. 23, pp. 1709-1725, 1996
[4] Ledesma-Carbayo, M.J., Kybic, J., Desco, M. et Al.,“Spatio-Temporal Nonrigid Registration for Ultrasound Cardiac Motion Estimation”, IEEE Trans. Med. Im.,vol. 24, no. 9, p 1113-1126, 2005.
[5] Lamare F., Carbayo MJ.,Cresson T. et Al.,“List-mode-based reconstruction for respiratory motion correction in PET using non-rigid body transformations”, Phys. Med. Biol, vol. 52, p 5187, 2007 [6] Reader A.J., Ally S., Bakatselos F. et Al, “One-pass list-mode EM
algorithm for high-resolution 3D PET image reconstruction into large array”, IEEE Trans. Nucl. Sci.,vol. 4, p. 1853-1858, 2002
[7] Tomei, S., Marache-Francisco S., Odet C. et Al. ”Automatic detection of active nodules in 3D PET oncology imaging using the Hotelling Observer and the Support Vector Machines: a comparison study”, IEEE MIC, 2008.
[8] Tomei S., Reilhac A., Visvikis D. et Al, “Development of a database of realistic simulated whole body [18F]FDG PET images for lymphoma”, IEEE NSS, p. 4958-4963, 2009.
[9] Le Maitre, A., Segars W.P., Marache S. et Al, “Incorporating patient specific variability in the simulation of realistic whole body 18F-FDG distributions for oncology applications”, IEEE Proc, vol. 97, n. 12, p.2026-2038, 2009.
[10] A. Reilhac et al., "PET SORTEO: Validation and Development of a database of simulated PET volumes," IEEE Trans. Nucl. Sci., vol. 52, no. 5, pp. 1321-1328, 2005.
Fig. 4. Sagittal slices of a simulated PET pathological image (a) with the ET-LOR correction, (b) with the ET-IM correction and (c) without respiratory motion correction (NoCor). The arrow points to the location of a liver tumor.
Fig. 5. Image profiles through a liver tumor of a simulated PET pathological image
Fig. 6. FROC curves of the detection of small tumors in the liver (a) and lungs (b)