Slow-targeted release of a ruthenium anticancer
agent from vitamin B
12
functionalized marine
diatom microalgae
†
Joachim Delasoie,
aJérémie Rossier,
aLaetitia Haeni,
bBarbara Rothen-Rutishauser
band Fabio Zobi
*
aHerein we report the synthesis of a new biomaterial designed for targeted delivery of poorly water-soluble inorganic anticancer drugs, with a focus on colorectal cancer. Diatomaceous earth microparticles derived from marine microalgae were coated with vitamin B12 (cyanocobalamin) as a
tumor targeting agent and loaded with the well-known anticancer agents cisplatin, 5-fluorouracil (5-FU), and a tris-tetraethyl[2,2’-bipyridine]-4,4’-diamine–ruthenium(II) complex. The successful functionalization
of the biomaterial was demonstrated by different analytical techniques and by synthesizing an organo-metallicfluorescein analogue of cyanocobalamin detectable by confocal laser scanning microscopy. The drug releasing properties were evaluated for all three species. We found that while cisplatin and 5-FU are rapidly lost from the material, the ruthenium complex showed an unprecedented release profile, being retained in the material up to 5 days in aqueous media but readily released in lipophilic environments as in the cell membrane. The increased adherence of the B12coated diatoms to colorectal cancer cell line
HT-29 and breast cancer cell line MCF-7 was demonstratedin vitro. In both cases, the adherence of the B12modified diatoms was at least 3 times higher than that of the unmodified ones and was correlated
with the increased transcobalamin II (TC(II)) and transcobalamin II receptor (TC(II)-R) expression of the targeted tissue. Our results suggest that this type of B12modified diatoms could be a promising tool to
achieve targeted delivery of water insoluble inorganic complexes to tumor tissues by acting as a micro-shuttle interacting with the sites of interest before delivering the drug in the vicinity of the tumor tissue.
1.
Introduction
Over the past two decades, macromolecular systems have been exploited as drug carriers in an attempt to address different diseases.1–6 Mesoporous silica-based materials and nano-particles are particularly attractive for drug-delivery appli-cations due to their excellent biocompatibility. However, their preparation is costly, polluting, and requires toxic chemicals and advanced skills. In 1999, Morse proposed the use of natu-rally occurring diatoms as an alternative to synthetic silica-based materials for bio-applications.7 Diatoms, originating from unicellular amoeba, are microalgae found in all aquatic and moist environments. These organisms have the unique feature of being enclosed within a cell wall made of silica
(hydrated silicon dioxide) called frustule (henceforth abbre-viated as DEMs in this work). Such a silica shell (formed around their membrane), once harvested, isolated and puri-fied, offers an excellent source of inexpensive and environmen-tally friendly microporous silica. Furthermore, the genetically controlled architecture of the diatoms surpasses current human engineering capabilities and these materials are poised to make a significant contribution in the fields of material chemistry, biology and medicine.
Successful frustule drug encapsulation has already been reported for several organic drugs8–17but applications of these materials have been hampered by the rapid release of the encapsulated drug once the system is suspended in aqueous media (typically nearly 100% drug release within 1 h). To inves-tigate the possibility of using diatoms as drug delivery vehicles for poorly water soluble inorganic anticancer drugs, we grafted vitamin B12, as the tumor targeting agent, on the diatom surface and compared the drug loading and release profiles of this new bio-inspired material of well-known antitumor agents cisplatin, 5-fluorouracil and the tris(N,N,N′,N′-tetraethyl [2,2′-bipyridine]-4,4′-diamine-N1,N1′)ruthenium(II) dichloride (4) †Electronic supplementary information (ESI) available. See DOI: 10.1039/
c8dt02914h
aDepartment of Chemistry, Fribourg University, Chemin du Musée 9, 1700 Fribourg,
Switzerland. E-mail: fabio.zobi@unifr.ch; Fax: +41 (0) 26 300 9737; Tel: +41 (0) 26 300 8785
bAdolphe Merkle Institute, Chemin des Verdiers 4, 1700 Fribourg, Switzerland
http://doc.rero.ch
Published in "Dalton Transactions 47(48): 17221–17232, 2018"
which should be cited to refer to this work.
complex.25We found that this ruthenium complex has a lower IC50value against HT-29 cells than cisplatin and that it shows an unprecedented release profile, being retained in the material up to 5 days in aqueous media but readily released in lipophilic environments as in the cell membrane where it exerts its toxic function.25
Cyanocobalamin was chosen as the targeting agent owing to the fact that cancer cells, which undergo rapid proliferation, have a higher demand of the vitamin than normal tissues.18To fulfill their important need of B12, tumor tissues produce an increased amount of TC(II) (transcobalamin II) and TC(II)-R (transcobalamin II receptor). TC(II), which is present in the bloodstream, binds and transports B12 while TC(II)-R is the anchorage point on the cell surface. A large body of evidence sup-ports the use of the vitamin in the specific formulation.19–21,24
Considering that the diatoms are comparable in size to cancer cells (≈10 μm), they are not expected to be absorbed through the cell membrane, but envisioned to preferably inter-act with the targeted tissues in order to deliver the inorganic complex in their vicinity (Fig. 1). Finally, considering the inso-lubility of the material, and it being envisioned for oral deliv-ery of inorganic compounds (Fig. 1), colorectal cancer was selected as the target disease model in our study. This type of cancer is one of the most recurrent tumors in humans. It is particularly proliferative in Western countries as its occur-rence, which exceeded a million of new cases in 2008, is strongly correlated with diet and lifestyle factors from
econ-omically developed countries.22 Indeed, with approximately 137 000 newly diagnosed individuals only in the US in 2014 of whom 37% died, colorectal cancer continues to be an impor-tant health issue these days.23
2.
Materials and methods
Chemicals and materials
Diatomaceous earth (DE), in the form of Celatom® Fw-14, was obtained from Applied Minerals Ltd (Staffordshire, UK). (3-Aminopropyl)triethoxysilane (APTES), H2SO4 and HCl were purchased from Honeywell Research Chemicals (Bucharest, Romania). Phosphate-buffered saline (PBS pH 7.4) was pur-chased from Thermo Fisher Scientific (Switzerland). H2O2and glycerol were purchased from Reactolab SA (Switzerland). 1-Ethyl-3-(3-dimethylaminopropyl)carbodiimide (EDC), N-hydroxysuccinimide (NHS), succinic anhydride, ninhydrin and pepsin from porcine stomach were purchased from TCI Europe. Fluorescein (FAM) azide (B4130), 5-isomer, was purchased from Lumiprobe Life Science Solutions (Hannover, Germany). Tris(2,2′-bipyridine)ruthenium(II)
hexa-fluorophosphate was synthesized in our lab. 4,4 ′-Bis(N,N-di-ethylamino)-2,2-bipyridine was purchased from HETCAT (Basel, Switzerland). SGF (simulated gastric fluid) and SCF (simulated colonic fluid) were prepared as described by Ren26 and Coughlin.27The cancer cell lines used in the study were HT-29 ATCC® HTB-38™ and MCF7 ATCC® HTB-22™.
Characterization
The size distribution of the DEMs microparticles was analyzed by static light scattering using a Beckman Coulter LS 13 320 laser diffraction particle size analyzer with a Micro Liquid Module (MLM). Samples were first diluted in Milli-Q water before being sonicated in a bath for 10 s and then quickly sampled and added to the measuring chamber reaching an obscuration between 10 and 15%. UV-Vis spectra were measured using a Jasco V730 spectrophotometer. Solid state UV-Vis spectra were measured using a PerkinElmer UV/VIS/ NIR Spectrometer Lambda 900 with a PerkinElmer 150 mm Int. Sphere. The dry powder sample (approx. 5 mg) was spread between two glass slits and stacked in a sandwich form before being analyzed. IR spectra were measured using a PerkinElmer FTIR Frontier Serie 99155 equipped with a PIKE TECHNOLOGIES GladiATR™ system. The ζ-potential was recorded using a Beckman Coulter DelsaMax PRO. Briefly, the samples were diluted to the right concentration in PBS at pH 7.4 directly before being measured. The ninhydrin (2,2-di-hydroxyindane-1,3-dione) test is commonly used to reveal the presence of primary amines and ammonia by generating a nin-hydrin chromophore (2-(1,3-dioxoindan-2-yl)iminoindane-1,3-dione) in their presence by dimerization as seen in Fig. S4A, ESI.† For the experiment, a test tube was loaded with 10 mg of sample to be tested and 2 to 3 mL of 3.5 mg mL−1ninhydrin in pure ethanol were added. The sample was heated with an industrial heat gun or a Bec-Bunsen for 5 min, until a blue to
Fig. 1 Illustration of the conceptual and experimental approach. Natural biosilica“DEMs” are functionalized with cyanocobalamin before being loaded with an inorganic drug agent. The loaded micro-shuttles target and interact with the tumor tissues before releasing the drug in their vicinity.
purple coloration appears. If no coloration appeared, the test was considered as negative. Scanning Electron Microscopy (SEM) pictures were recorded using a Tescan Mira3 LM FE SEM. Samples were coated with 4 nm to 10 nm platinum depending on the analysis and recorded at 10.0 kV under high vacuum, 6 × 10⁻⁴ Pa. Confocal Laser Scanning Microscopy (LSM) was performed using a Nikon A1R MP Confocal Microscope. Inductively Coupled Plasma with Optical Emission Spectroscopy (ICP-OES) measurements were per-formed with a PerkinElmer Optima 7000 DV. HPLC analyses were performed on a Merck-Hitachi L-7000 system. Analytical samples were examined on a Macherey-Nagel Nucleodur C18 HTec column (5μm particle size, 250 × 4.6 mm) while prepara-tive HPLC was performed using a Macherey-Nagel Nucleodur C18 HTec column (5 μm particle size, 110 Å pore size, 250 × 21 mm). Aqueous trifluoroacetic acid 0.1% solution and pure methanol were respectively used as solvents (A) and (B). For analytical HPLC, the compounds were separated using an iso-cratic method, 50 : 50 A : B, with the flow rate set to 0.5 mL min−1 and the compounds detected at 265 nm. For pre-parative HPLC, the compounds were separated using the following gradient: 0–5 min (75% A), 5–35 (75% A → 0% A), and 35–45 min (100% B), with the flow rate set to 5 mL min−1 and the compounds detected at 320 nm. High resolution ESI-MS was performed on a Bruker FTMS 4.7 T Apex II in posi-tive mode. NMR analyses were performed on a Bruker Advance III 500 MHz. The corresponding 1H and 13C chemical shifts are reported relative to residual solvent protons and carbons. Synthesis
Vitamin B12derivative B12-1. Cyanocobalamin was modified by pegylation on the 5′-hydroxylic function of the molecule as previously described with slight modifications.28,29 Briefly, 100 mg of reduced B12(0.074 mmol) were mixed with 75 mg of CDT in 3 mL of DMSO and stirred overnight. The product was then precipitated in ethyl acetate (150 mL) and centrifuged for 10 min at 5000 rpm in order to recover the red precipitate. Then the mixture was resolubilized in 1 mL anhydrous DMF and 100 μl of 4,7,10-trioxa-1,13-tridecanediamine in 1 mL anhydrous DMF was added. The product was precipitated again in 3 : 1 ether : ethyl acetate (150 mL) and centrifuged for 10 min at 5000 rpm before being purified by preparative HPLC.
Vitamin B12 derivative B12-2. Derivative B12-1 was reacted with 1,4-diethynylbenzene under conditions previously described by Chrominski et al.30The product was then isolated via HPLC. Yield: 68%. Red powder.1H NMR (500 MHz, MeOD-[d4]):δ = 7.23 (s, 1H), 7.20 (s, 1H), 7.16 (d, J = 8.3 Hz, 1H), 6.79 (d, J = 8.3 Hz, 1H), 6.62 (s, 1H), 6.19 (d, J = 2.65 Hz, 1H), 5.98 (s, 1H), 4.81–4.78 (m, 2H), 4.63–4.55 (m, 2H), 4.41–4.31 (d, J = 10.45 Hz, 1H), 4.26–4.18 (m, 3H), 3.70–3.62 (m, 9H), 3.62–3.56 (m, 4H), 3.53 (m, 2H), 3.45 (s, 1H), 3.28–3.15 (m, 4H), 3.11 (t, J = 6.40 Hz, 2H), 2.95 (dd, J = 8.50, 5.60 Hz, 1 H), 2.83 (q, J = 5.4 Hz, 1H), 2.61–2.52 (m, 12H), 2.52–2.38 (m, 5H), 2.33 (d, J = 13 Hz, 1H), 2.29 (s, 1H), 2.28 (s, 3H), 2.26–2.18 (m, 1H), 2.13–2.05 (m, 1H), 2.03 (s, 1H), 2.01 (s, 1H), 2.00–1.87 (m, 6H), 1.85 (s, 1H), 1.84–1.82 (m, 1H), 1.80–1.70 (m, 3H), 1.47 (s, 3H), 1.35 (s, 3H), 1.34–1.31 (m, 1H), 1.30 (s, 3H), 1.24 (d, J = 6 Hz, 3H), 1.20–1.14 (m, 1H), 1.12 (s, 3H), 0.51 (s, 1H) ppm; 13C NMR (125 MHz, MeOD-[d4]): δ = 179.9, 178.2, 177.6, 177.5, 176.9, 176.01, 176.97, 175.6, 175.0, 174.4, 174.0, 166.4, 165.9, 158.8, 143.6, 138.8, 135.1, 133.4, 132.7, 131.9, 131.6, 128.3, 121.0, 118.7, 111.9, 108.2, 104.9, 102.6, 95.4, 88.0, 86.2, 84.1, 81.25, 81.20, 79.5, 75.7, 75.2, 73.6, 73.5, 71.5, 71.1, 71.0, 70.7, 70.4, 69.5, 64.5, 59.8, 56.9, 56.6, 55.2, 52.2, 46.43, 46.40, 44.0, 43.3, 40.2, 39.9, 39.0, 36.4, 35.4, 33.3, 33.2, 32.7, 32.6, 32.0, 31.0, 29.6, 28.2, 27.5, 27.4, 20.9, 20.4, 20.3, 20.16, 20.13, 20.0, 17.5, 17.1, 16.4, 16.2 ppm; HRMS (ESI+): [M + 2Na]2+= 872.8699, calculated for C
83H115Co1N15O18P1Na2= 872.8697.
Vitamin B12derivative B12-3. 20 mg of B12-2 (0.0118 mmol) and 4.1 mg of FAM azide dye were solubilized in 0.65 mL DMF. Afterwards, 0.5 mg of CuSO4(0.2 eq.) and 2.5 mg of TBTA were dissolved in 0.35 mL H2O before being added to the reaction mixture. Finally, 2.5 mg of vitamin C (ascorbic acid) were added to the mixture and allowed to react overnight at room temperature before recovering the desired product, B12-3, via preparative HPLC. Yield: 70%. Red-orange precipitate.1H NMR (500 MHz, MeOD-[d4]):δ = 8.08 (s, 1H), 7.94 (s, 2H), 7.50 (s, 1H), 7.38 (s 1H), 7.36 (s, 1H), 7.22 (s, 1H), 7.18 (s, 1H), 6.88 (s, 1H), 6.86 (s, 1H), 6.67 (br s, 2H), 6.62 (s, 1H), 6.52 (br s, 2H), 6.45 (d, J = 9 Hz, 1H), 6.39 (br s, 1H), 6.18 (d, J = 2.80 Hz, 1H), 5.97 (s, 1H), 5.10 (s, 1H), 5.65–5.56 (m, 1H), 4.51 (s, 3H), 4.46 (dd, J = 6.16 Hz, 1H), 4.44–4.31 (m, 1H), 4.22 (br s, 3H), 3.85 (br s, 3H), 3.70–3.48 (m, 16H), 3.46–3.40 (m, 2H), 3.20 (q, J = 7.40 Hz, 8 H), 3.10 (t, J = 6.34 Hz, 2H), 2.93 (dd, J = 8.45, 6.0 Hz, 1H), 2.80 (qt, J = 6.0 Hz, 1H), 2.69 (s, 2H), 2.63–2.54 (m, 6H), 2.54–2.49 (m, 6H), 2.49–2.36 (m, 5H), 2.28 (s, 3H), 2.27 (s, 3H), 2.25–2.15 (m, 3H), 2.12–1.87 (m, 4H), 1.85 (s, 3H), 1.83–1.67 (m, 4H), 1.46 (s, 3H), 1.35 (s, 3H), 1.32–1.26 (m, 18H), 1.22 (d, J = 5.55 Hz, 3H), 1.17 (s, 3H), 1.15 (s, 3H), 0.89 (t, J = 6.5 Hz, 1H), 0.50 (s, 3H); HRMS (ESI+): [M + H + Na]2+= 1090.9403, calculated for C107H134Co1N19O24P1Na1= 1090.9407 [Ru((Et2N)2bpy)3]Cl2(4). A previously described procedure to synthesize [Ru((Et2N)2bpy)2Cl2]Cl was slightly modified to produce an equivalent [Ru(II)((Et2N)2bpy)3]Cl2.3150 mg RuCl3,
210 mg LiCl and 250 mg (Et2N)2bpy were mixed in 5 mL DMF under argon, before adding 100 μL of trimethylamine, and heated under reflux at 140 °C for 5 h. The mixture was then precipitated in Et2O and filtered through a microporous filter. Et2O was removed and the filter was rinsed with CH2Cl2 in order to solubilize the metal complex. The crude product was then dried under reduced pressure overnight. The mixture was then purified by column chromatography with the eluant (25% MeOH; 14% H2O; 60% ACN; 1% NaCl sat.). The second band (strongly reddish) was recovered as pure 4. All physico-chemical properties are in agreement with those previously reported.25
Isolation and purification of DEMs
One gram of raw DE was suspended in 20 g of 2.95 M H2SO4 (15 g deionized water + 5 g H2SO4conc.) for a final mass ratio
of 20. The solution was stirred and heated under reflux at 100 °C for 24 h. The DE was then filtered through a fritted glass ( porosity 4) and rinsed with 50 mL of deionized water. The solution was sonicated for 5 min and then centrifuged at 5000 rpm for 10 min. The supernatant was discarded and the DE was washed with water and centrifuged again. This pro-cedure was repeated until the pH of the supernatant reached ≈5.5. The sample was then lyophilized overnight. Then, 500 mg of purified DEMs in 15 mL EtOH were sonicated for 1 min. About half of this suspension was added at the top of a 250 mL sedimentation column filled with a mixture of 1 : 5 glycerol : EtOH. Fractions of about 10 mL were collected every 1.5 min up to 14 min, then every 3 min up to 36 min and finally at several different intervals until 3 h. Each collected fraction was centrifuged for 10 min at 5000 rpm and washed with pure EtOH three times. The recovered DE samples were dried overnight in an oven at 40 °C. The particle sizes of different recovered fractions of DEMs were determined by SLS (Static Light Scattering) to obtain the profile of the size separ-ation (Fig. 2A). The selected fractions were recombined and mixed in 10 mL of 30% H2O2, stirred and heated at 90 °C for 20 h. Finally, the sample was cooled and washed several times with deionised water before being lyophilized overnight.
DEMs surface modification
Surface activation. The aminated DEMs were generated by APTES condensation, as reported previously.13,14Briefly, 50 mg of previously hydroxylated and isolated DEMs were lyophilized overnight. 10 mL of anhydrous toluene were poured on this 50 mg of hydroxylated DEMs, under argon and sealed with a septum. The mixture was preheated at 125 °C before adding, dropwise, 1 mL of APTES. Preannealing of the mixture before APTES addition and functionalization greatly improves the yield of the reaction as revealed by Pasternack et al.32in 2008. It is crucial to work under dry conditions in order to avoid self-polymerization of APTES and the risk of intra-molecular cataly-sis of APTES hydrolytic detachment by the amine function in a 5-member ring mechanism in an aqueous solvent.33,34 After this addition under dry conditions, the mixture was reacted at 125 °C for 6 h before being cooled and recovered by centrifu-gation. After cooling, the mixture was centrifuged at 5000 rpm
for 15 min and then the supernatant was discarded. The mixture was then washed 2 times with 10 mL anhydrous toluene before being recovered through a PTFE filter and left overnight in an oven at 110 °C under vacuum.
Surface functionalization with vitamin B12. In order to func-tionalize the aminated DEMs with modified B12 precursors, typically 2–3 mg of either B12-1 or B12-3 were solubilized in 2 mL anhydrous DMF and then added dropwise into 240 mg succinic anhydride in 8 mL anhydrous DMF and stirred under argon for 24 h. Afterwards the mixture was added dropwise to 45 mL of 2 : 1 Et2O : CHCl3to form a reddish precipitate. This precipitate was recovered by centrifugation at 6000 rpm for 15 min. Subsequently, for both compounds, the recovered pre-cipitate was dissolved in 3 mL MES buffer (0.1 M, pH 5.5) with 46μl of EDC and 17 mg NHS for 1 h at RT under diminished light before direct addition of≈10 mg of aminated DEMs. The mixture was reacted for 20 h at RT in the dark. The mixture was then filtered, washed with 20 mL demineralized water and 20 mL ethanol and finally placed in an oven under vacuum at 40 °C overnight. The recovered powders were denoted as DEMs-B12-1 and DEMs-B12-3.
Resistance of DEMs-B12-1 in simulated digestive fluids. The tests were performed in simulated gastric fluid (SGF) and simulated colonic fluid (SCF). For this purpose, 8 mg of DEMS-B12-1 were digested in either SGF or SCF (6 mL) for 2 hours before recovering the solid residue and the super-natant. The supernatant was diluted to 10 mL with 2% HNO3. The solid fraction was digested for the second time in 2 mL piranha solution (7 : 1 H2SO4: H2O2) overnight before being diluted to 10 mL with deionized water. All the samples were analyzed by ICP-OES (Co monitoring).
Cell cultures
Human colorectal epithelial cells, i.e. the HT-29 cell line received from the American Type Culture Collection, were cultured using Gibco’s DMEM supplemented with 10% fetal bovine serum (FBS), 1% penicillin–streptomycin, 1%
L-glutamine and 1% non-essential amino acid (NEAA) at 37 °C
with 5% CO2, seeded in a 96-well plate at a density of 2 × 10³ cells per well and allowed to settle for 5 days (high density) or 24 h (low density).
Fig. 2 (A) Particle size of recovered fractions over time of sedimentation. (B) SLS histogram representing the mean size of a sample taken between 3 and 4 hours of sedimentation. (C) SEM image of unmodified DEMs after size separation by sedimentation.
In addition, the mouse melanoma (B16F10) [ATCC, CRL-6475] cell line was used and grown in Dulbecco’s Modified Eagle Medium (DMEM) [Gibco, 41966-029] sup-plemented with 1% L-glutamine, 1% penicillin–streptomycin
and 10% heat inactivated FBS.
Cytotoxicity assay of the [Ru((Et2N)2bpy)3]Cl2complex (4) The IC50 value of 4 was determined against HT-29 cells. After the removal of the growth medium, the cells were treated for 48 h with 200 μL of 4 at various concentrations (0 to 50 μM). Subsequently, the old medium was removed and a stock solution of MTT (5 mg mL−1) was prepared and then diluted 10 times before adding 200 μL of it in each well. The plates were incubated for another 3–4 h at 37 °C. After the removal of the media, 100μL of DMSO were added as the MTT solvent and the plates were re-incubated at 37 °C for another 15 min and shaken for 5 min under dark con-ditions. Finally, the solubilized formazan was quantified at 560 nm using a microplate reader. The test was performed in triplicate with cells from 3 different passages at both high and low densities.
Drug loading and release
Drugs were loaded into the DEMs using the vacuum infiltra-tion method described by Vasani et al.16 For this purpose, known amounts of DEMs were weighed and soaked for 1 day in a solution of the concentrated drug while being gently shaken at 150 rpm. Afterwards, the mixtures were frozen, degassed in a lyophiliser before allowing the solvent to melt and the samples were quickly brought back to atmospheric pressure. This procedure promotes the penetration of the drugs through the pores of the DEMs. Then the samples were centrifuged, the supernatant was discarded and the residue was completely dried in the lyophiliser. The different drug release profiles were studied over periods of 20 h. For each experiment, 5 to 10 mg of loaded DEMs was weighed and placed in 2 mL Eppendorf tubes. Drug release was initiated by adding 2 mL of the solvent. Samples of 100 μl were taken at each time point and replaced with fresh buffer. The concen-trations of these samples were evaluated by UV-VIS spec-trometry, ICP-OES or HPLC depending on the monitored com-pound. The cumulative releases were calculated and plotted using Origin 7.5. For cisplatin and 5-FU, the drug release profile was studied in PBS buffer, pH 7.4. Cisplatin release was determined at each time point by ICP, by monitoring the plati-num content. The values for the cumulative drug release were calculated from a linear regression made with six standards in the range of analysis (from 0.5 to 100 mg mL−1, R2= 0.9978). The released amount of 5-FU was determined at each time point by HPLC analysis (monitoring wavelength set at 265 nm). The values for the cumulative drug release were cal-culated from a linear regression made with six standards at different concentrations in the range of analysis (from 1 to 35 μg mL−1, R2 = 0.9997). The release of 4 was evaluated by UV-Vis spectrometry first in PBS buffer, pH 7.4, containing 1% ethanol v/v. The absorbance was monitored at the maximum
excitation wavelength (λmax= 527 nm) of the compound. The values for the cumulative drug release were calculated from the linear regression equation of a calibration curve made with six standards in the range of analysis (from 3.5 to 28.0 mg mL−1, R2 = 0.9711). The release of 4 was then similarly evaluated in pure octanol. The absorbance was monitored at the maximum excitation wavelength in pure octanol (λmax = 523 nm). The values for the cumulative drug release were cal-culated from the linear regression equation of a calibration curve made with six standards at different concentrations in the range of analysis in pure octanol (from 3 to 210μg mL−1, R2= 0.9997). The sum of the drug released was considered as the total amount of drug loaded onto DEMs. The loading degree was calculated as the mass percentage of the drug over the sum of drug and DEMs for each sample.
Tumor targeting and adherence
To investigate the ability of DEMs-B12-1 to interact with and adhere to cancer cells, the colorectal cancer cell line HT-29 and breast cancer cell line MCF-7 were used as targeted entities. As mentioned above, HT-29 cells were selected as a tumor model of this study while MCF-7 cells were used as a positive control. MCF-7 cells release and express a comparably high level of TCII as well as the respective membrane receptor; thus a comparison of the two cell lines should indicate whether the increased adherence of DEMs-B12-1 to cancer cells is correlated with the increased TC(II)/TC(II)-R expression of the targeted tissue or not. Briefly, DEMs samples to be tested were weighed in sterile Falcon tubes of 15 mL. The cells were seeded either on sterile coverslips for SEM analysis or in 5-well imaging chambers for Bright field microscopy. The cultures were incubated at 37 °C, 5% CO2. At 70% conflu-ence, the cell cultures were incubated with 1 mL of each sample of DEMs (200 μg mL−1). The incubation time was 1 h before washing the samples 3 times with pure media. The cell cultures were finally fixed for 10 min with 4% paraformalde-hyde EM grade (Electron Microscopy Sciences). Bright-field images were obtained from imaging chambers kept wet during the process. SEM images were obtained from cover-slips mounted with carbotaps and coated with 5 nm platinum before being analyzed in a Tescan Mira3 LM FE SEM, at 10.0 kV under high vacuum (6 × 10⁻⁴Pa). By counting the number of DEMs pieces and cells present in different images (for example, Fig. S6 in the ESI†), the average number of DEMs per cell was calculated for each experiment using ImageJ and Photoshop.
3.
Results and discussion
DEMs size separation
DEMs were purified and isolated by sedimentation. The sedi-mentation was followed by measuring the size of the particles recovered over time. Fig. 2A shows the average size of each sparse sample taken over a whole separation process as a func-tion of the sedimentafunc-tion time along the column. The samples
recovered between 3 and 4 hours of sedimentation (section II in Fig. 2A) have an average size of 10μm as seen in the histo-gram in Fig. 2B, with a height/diameter ratio between 1 and 1.5.
The typical shape and size of these frustules (i.e. DEMs) are shown in Fig. 2C and they make them easily identifiable as belonging to the genera Aulacoseira with the majority of pieces probably belonging to the species Aulacoseira lirata, Aulacoseira alpigena or Aulacoseira lacustra. Indeed, the charac-teristics of these species of Aulacoseira (diameters of 6–23 μm, mantle heights of 5–14 μm and rows of 7 to 13 areolae in 10 μm) are fully consistent with what we have observed from the SEM images of the recovered samples. It should also be noted that these three species are often observed together, as in our case.35 The graph in Fig. 2A shows a straight elbow when the mean size of the particles reaches approximatively 10μm (transition from section I to section II). This is related to the fact that almost all aggregates were removed from the sample and only isolated whole frustules were harvested further. Nevertheless, the mean size of the recovered fractions
continues to decrease throughout the sedimentation process indicating that the ratio of small broken pieces and small juvenile diatoms increases as compared to whole intact adult pieces. Regarding these observations, it is obvious that the fractions collected after 3 to 4 hours (mean size of approx. 10μm) correspond to a mixture of well separated and isolated whole frustules, and this was confirmed by SEM microscopy as shown in Fig. 2C. These fractions were consequently selected for further investigation and functionalization.
Surface functionalization and characterization of DEMs In order to functionalize DEMs with vitamin B12, the vitamin was first modified by pegylation of the 5′-OH ribose moiety before transforming the ending amine function of the PEG chain into a carboxylic function. This preparation aimed to make vitamin B12amenable to amide condensation with a pre-viously APTES grafted surface of DEMs. APTES functionali-zation of DEMs was performed as previously described and successful DEMs functionalization was confirmed via a ninhy-drin revelation test (see the ESI† for details). Furthermore, the
Fig. 3 (A) Reaction steps leading to the synthesis of DEMs-B12-1. Conditions: (i) CDT, 12 h, DMSO; (ii) PEG, 12 h, anhydrous DMF; (iii) succinic
anhy-dride, anhydrous DMF, 24 h; (iv) 30% H2O2, 90 °C, 20 h; (v) APTES, anhydrous toluene, 125 °C, 6 h; (vi) EDC/NHS, MES, pH 5.5, 30 min; (vii) dim light,
RT, 24 h. (B) FTIR spectrum of pure cyanocobalamin, unmodified DEMs and DEMs-B12-1 from 400 to 4000 cm−1. (C) UV-solid state spectra of
unmo-dified DEMs and DEMs-B12-1. Peaks at 361 nm, 521 nm and 545 nm indicate the presence of vitamin B12.
ζ-potential analyses on a 10 μm size batch of DEMs gave a negative potential of−15.5 ± 3.7 mV at pH 7.4 for the hydroxyl-ated DEMs, while the APTES functionalized DEMs gave 12.7 ± 2.8 mV under the same conditions (steps iv and v, Fig. 3A). The addition of a long chain to B12instead of directly reacting the ribose moiety with aminated DEMs was intended to promote a large degree of functionalization of the surface by reducing the steric hindrance of B12 near the surface. Furthermore, such modification makes B12more flexible (ca. 15–20 Å from the DEMs surface) promoting the interaction with TC(II) and TC(II)-R receptors. The synthetic pathway
leading to the surface functionalization of DEMs is shown in Fig. 3.
FTIR spectra acquired before and after surface modification (Fig. 3B) showed a large peak at 1064 cm−1which is attributed to Si–O vibrations of silica forming the DEMs (as the large peak at around 490 cm−1), while the peak at 794 cm−1is attrib-uted to Al–O–Si vibrations. The peak appearing at 1643 cm−1is attributed to NH–CO vibrations which are numerous on the B12-1, but is also characteristic of the amide bonding between the APTES and the carboxylic function of the aforementioned B12-1. The specific bands at 1542 cm−1 and 1643 cm−1 are assigned to the corrin-ring of vitamin B12 and to the amide structures present around it. The band at 3289 cm−1is attribu-ted to other CH or NH vibrations of the B12structure.14,16,36,37 Solid-state UV-Vis spectroscopy was used to measure the absor-bance of the newly synthesized DEMs-B12-1. Absorbance of a thin layer of the sample gives the spectra shown in Fig. 3C. When comparing the spectra of the DEMs before and after surface functionalization with vitamin B12, three new peaks at 361 nm, 521 nm and 545 nm appear consistent with the absor-bance of pure cyanocobalamin.38This evidence confirms the successful modification of the DEMs surface with vitamin B12.
To further characterize the B12 modified DEMs, a fluor-escein-labelled vitamin derivative was synthesized, conjugated on the DEMs surface (DEMs-B12-3) following the same pro-cedure used to prepare biomaterial DEMs-B12-1, and finally analyzed by laser scanning microscopy (LSM). Fig. 4 shows the synthetic procedure and results of our analysis. The cobalamin precursor was labelled with a FAM azide 6-isomer fluorescein to give B12-3 (Fig. 4A). NMR was used to assess the synthesis of the precursors B12-2 and B12-3. As is evident in Fig. 4B the aro-matic region shows an increasing number of peaks after each modification step which are related to and consistent with the addition of the alkynylated linker (B12-2) and the FAM azide dye (B12-3) to cobalamin. The absorption and emission spectra of this B12-3 are presented in Fig. 4C, while Fig. 4D shows confocal LSM analysis of the material. The covalently bonded B12-3 (green) is located sparsely on the frustule with an increased concentration near the girdle. This analysis further confirmed the complete functionalization of the frustule surface with B12.
Fig. 4 (A) Reaction steps leading to the synthesis of DEMs-B12-3.
Conditions: (i) 1,4-Diethynylbenzene, CuOAc, DBU in DMA, RT, 4 h; (ii) FAM-azide 5-isomer, CuSO4, ascorbic acid, TBTA, DMF, RT, overnight;
(iii) Succinic anhydride, anhydrous DMF, 24 h; (iv) EDC/NHS, MES, pH 5.5, 30 min; (v) dim light, RT, 24 h. (B) Aromatic region of the
1H-NMR spectra (D
2O) of cyanocobalamin, B12-2 and B12-3 derivatives
showing the incorporation of aromatic protons corresponding to the respective structures. (C) Absorption and emission spectra of B12-3,
MeOH, RT. (D) Confocal LSM image of DEMs-B12-3 (λex= 488 nm;λem=
525 nm).
Table 1 ICP-OES measurements of the B12content on the DEMs-B12-1
surface and in the supernatant, before and after digestion in SGF and SCF
Name
B12mass ratio per
DEMs-B12-1 [ppm] ±Error B12on DEMs-B12-1a No treatment 155 ±15 B12on DEMs-B12-1a 2 h in SGF 68 ±12 B12in supernatanta 2 h in SGF 76 ±13 B12on DEMs-B12-1b 2 h in SCF 127 ±2 B12in supernatantb 2 h in SCF 42 ±5 aDEMs-B
12-1, Batch 1.bDEMs-B12-1, Batch 2.
Resistance of DEMs-B12-1 in simulated digestive fluids To assess the resistance of the surface modification of DEMs towards gastric and colonic fluids, tests were performed in simulated gastric fluid (SGF) and simulated colonic fluid (SCF) and analyzed by ICP-OES (Co monitoring). The efficiency of the Co monitoring to estimate the B12 con-centration was first studied by analyzing a known amount of pure cyanocobalamin and the obtained recovery was up to 95%. We found that on average ca. 50% of the B12coating of DEMs-B12-1 is degraded after 2 hours of soaking in SGF (Table 1). This was expected since the pepsin, produced in the stomach, and working under such acidic conditions, is dedi-cated to amide bond cleavage which is precisely the anchorage system of B12on the DEMs surface (two amide bonds at each extremity of the PEG linkage). Indeed, pepsin is known to be less specific than trypsin and other proteases, and so, has a wide capacity of digestion.39,40 It is thus not surprising that approximately half of the B12coating is removed after 2 hours of soaking in SGF. Nevertheless, the fact that under such harsh conditions (corresponding to the duration of food in human stomach) at least 50% of the coating remains intact can be considered a positive result in our formulation. Regarding the considerable effect of the B12 coating on the adherence capacity of this new biomaterial on cancer cells (vide infra), this remaining content of cobalamin still strongly impacts the ability of DEMs-B12-1 to interact with the tumor tissues. Finally, depending on the type of targeted cancer, and especially in the case of colorectal tumors, another way of administration could be the rectal route which involves admin-istering this biomaterial through the rectum and into the large intestine as a suppository. To assess the stability of DEMs-B12 -1 in the colon, a test was performed, as previously described,
but this time in a SCF (Simulated Colonic Fluid). The results demonstrated that the stability of our material in the SCF is more than twice as high as that in the SGF (Table 1). This con-firms the interesting potential of DEMs-B12-1 administered as a suppository.
Cytotoxicity against the colorectal cancer HT-29 cell line The cytotoxicity of the [Ru(II)((Et2N)2bpy)3]Cl2complex (4) was
evaluated using the colorectal cancer cell line HT-29 and com-pared to the standard anticancer agents cisplatin and 5-fluorouracil (5-FU, currently part of the World Health Organization’s list of essential medicines used to treat colorec-tal cancer). The mean IC50value obtained for 4 against HT-29 cells after 48 h exposure was 3.5 ± 0.7 μM. This value is comparable to that of 5-FU (IC50of 1.4 ± 0.1 μM)41and low enough to consider this compound as a drug candidate to be used synergistically with DEMs-B12-1 as a micro-shuttle for targeted delivery in colon cancers. In comparison, cisplatin, which is the gold standard for inorganic anticancer drugs, is reported to have an IC50of 104.5 ± 1.2μM against the same cell line.41
In vitro drug loading and release
Cisplatin and 5-FU. Having established the IC50 values of the Ru complex 4 in comparison with cisplatin and 5-fluoro-uracil, we proceeded to compare the DEMs loading and release profiles of the same drugs. First, cisplatin and 5-FU were suc-cessfully loaded into DEMs according to the method described by Vasani with respective loading degrees of 6.9 and 7.3 wt% for unmodified DEMs and 5.9 and 9.9 wt% for DEMs-B12-1.16 These values are in the typical range of loading efficiencies reported for other drugs.9,13 Following successful
encapsula-Fig. 5 In vitro drug releases of cisplatin (A) and 5-FU (B) in PBS at pH 7.4 from unmodified DEMs (black line, squares) and DEMs-B12-1 (red line,
circles).
tion, drug release in PBS buffer was initiated by the addition of a solvent and monitored by ICP-OES and HPLC. As shown in Fig. 5A, after 4 h of buffer incubation more than 90% of the drugs were released from DEMs. This burst release appeared very quickly, and slightly sustained afterward. Within experi-mental error, an analysis of the relative drug releasing profiles indicates that the functionalization of the DEMs surface did not affect the release properties of the biomaterial. Comparison of the two drugs indicates that 5-FU release (Fig. 5B) is more rapid than that of cisplatin. This might be explained by the very high solubility of 5-FU in aqueous media. After 20 h, the apparent decrease in the concentration of 5-FU is explained by the low stability of the compound in solution.42
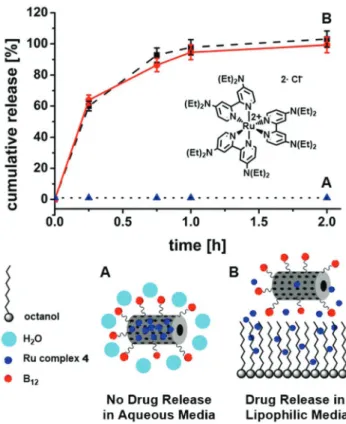
Ruthenium complex (4). Within the concentration range relevant to our experiments, 4 is only partially soluble in the aqueous medium (PBS, pH 7.4), and readily precipitates after centrifugation. Drug release experiments performed in PBS showed no release of 4 loaded DEMs (unmodified DEMs and DEMs-B12-1) after 48 h soaking in the medium. Only after the samples were left shaking for 5 days reddish bands were observed on the walls of the plastic Eppendorf tubes indicating release and accumulation of 4 in a lipophilic environment (Fig. S5 in ESI†). This observation confirms that the system could work as a drug vector for insoluble compounds, with the aim of targeting and triggering their release at specific sites of interest in the body. Encouraged by these results, a similar drug release experiment was performed in pure octanol. Octanol is clearly a solvent with lipidic properties and was selected as a model for the drug release in cell membranes of comparable lipophilicity. In this solvent 4 readily dissolves and, as shown in Fig. 6, after 2 h more than 95% of the drug was released from the DEMs. As in the case for cisplatin and 5-FU, unmodified DEMs and DEMs-B12-1 showed the same releasing profiles of 4 (respective loading degrees of 1.2 and 1.6 wt%).
Model fitting of the release profile data (Table 2) shows that, within the first two hours, drug release is purely Fickian diffusion controlled for all tested samples, as indicated by the n-values of the Korsmeyer–Peppas model (n ≤ 0.5). These results are consistent with the fact that a small drug such as 4 can easily pass through the 100–500 nm pores of DEMs. An initial burst release is also explained by a predominant loading of the outer surface of the DEMs leading to a quick diffusion of the drug in the medium once immersed in it, rather than a release of the drug from the inner cavity of DEMs. Thus drug release is principally driven by concentration gradients and diffusion distances and corresponds to purely
Fickian diffusion as is often the case with non-degradable drug delivery matrices.9,16,43
Adherence of DEMs-B12-1 on HT-29 and MCF-7 cells
Bright-field microscopy was used to assess the adherence of the newly designed DEMs-B12-1 biomaterial to colorectal cancer HT-29 cells. In order to demonstrate the increase of cellular adherence, cells were treated with either unmodified (DEMs) or B12 functionalized diatoms (DEMs-B12-1) under identical conditions (200 μg biomaterial mL−1, 1 h exposure). After intensive washing, cells exposed to DEMs-B12-1 still pre-sented and retained a large amount of microparticles huddled around cells (Fig. 7C) while in the sample of unmodified DEMs, almost all the microparticles were removed throughout the washing process (Fig. 7B, see also ESI Fig. S7†).
In their study on vitamin B12mediated transport of nano-particles (50 to 500 nm) across Caco-2 cells, Russell-Jones et al.20clearly demonstrated the increased internalization of
Table 2 Drug release modelfitting obtained from the in vitro release data (0 min to 120 min) of 4 in pure octanol
Zero order model Higuchi model Korsmeyer–Peppas model
Sample name K0min−1 R2 K0min−1 R2 Kpmin−1 n R2
Unmodified DEMs 19.85 0.6304 80.05 0.9217 0.94 0.26 0.8512
DEMs-B12-1 18.34 0.7372 68.14 0.9682 0.90 0.22 0.9380
Fig. 6 In vitro drug release of 4 from unmodified DEMS (black line, squares) and DEMs-B12-1 (red line, circles) in (A) PBS, pH 7.4, and (B)
pure octanol.
nanoparticles corresponding to increased surface densities of covalently bonded cyanocobalamin. In our case, the size of the DEMs, comparable to that of the cells, prevents cellular
internalization of the material but B12functionalization leads to efficient adherence of DEMs-B12-1 to HT-29 cells. In order to confirm the interaction of DEMs-B12-1 with cancer cells, tests of adherence to HT-29 were performed several times giving the same results. Samples consistently showed our bio-material anchored to HT-29 cells as seen in Fig. 7C and 8. Analysis of representative samples of cells exposed to either unmodified or B12 functionalized DEMs (8 pictures per sample,∼200 cells per picture) revealed that the average cel-lular adherence of DEMs-B12-1 to HT-29 was at least 3 times higher compared to the cellular adherence of unmodified DEMs.
Our results point to a receptor mediated interaction of the biomaterial involving TC(II) (transcobalamin II) and TC(II)-R (transcobalamin II receptor). Schohn24showed that the HT-29 cells produce both TC(II) and TC(II)-R while Sysel18 investi-gated the levels of TC(II), TC(II)-R and Ki-67 produced by different cancer lines. In order to confirm TC(II) and TC(II)-R mediated interactions of DEMs-B12-1, adherence tests of our material were also conducted with the breast cancer cell line MCF-7. MCF-7 is known to be one of the cell lines expressing the highest levels of TC(II) and TC(II)-receptors.18Under iden-tical conditions to those involving HT-29, experiments per-formed with MCF-7 cells revealed that the average number of DEMs-B12-1 particles per cell increased by a factor of six when compared to unmodified DEMs (Fig. 7D). The two-fold increase of DEMs-B12-1 adherence to MCF-7 cells as compared to HT-29 cells clearly indicates that B12 functionalization of
Fig. 8 SEM image of an anchored DEMs-B12-1 on a colorectal HT-29
cancer cell.
Fig. 7 SEM images of colorectal cancer cell line HT-29 exposed to: (A) control; (B) 200μg mL−1of unmodified DEMs; and (C) 200 μg mL−1of DEMs-B12-1. (D) Graph representing the mean number of either unmodified DEMs or DEMs-B12-1 observed per cell after 1 h exposure. (E, F)
Representative schemes of the DEMs/cell interactions.
the DEMs is responsible for the increased adherence and it is consistent with the higher TC(II) and TC(II)-R expression of MCF-7 cells.
4.
Conclusions
In summary, we have reported the synthesis of a new biomater-ial with increased adherence properties toward cancer cell lines HT-29 and MCF-7 by modifying the surface of natural occurring diatoms with vitamin B12. The interaction between this new biomaterial and tumor tissues takes place via the TC (II) and TC(II)-R mediated interactions of DEMs-B12-1, with the increased static adherence correlating with the TC(II)/TC(II)-R expression of the targeted cell line. The poorly water-soluble tris(N,N,N′,N′-tetraethyl[2,2′-bipyridine]-4,4′-diamine-N1,N1′) ruthenium(II) dichloride complex 4, used as a drug agent in
the current study, showed interesting release properties from the aforementioned biomaterial as well as a higher cytotoxicity than the conventional cisplatin drug toward colorectal cancer cell line HT-29. In particular, we showed that when loaded in DEMs-B12-1, complex 4 is retained in the material up to 5 days in aqueous media but it is readily released in lipophilic environments as in the cell membrane. Overall, our results demonstrate that this type of B12modified diatoms could be a promising tool to achieve targeted delivery of water insoluble inorganic complexes to tumor tissues by acting as a micro-shuttle strongly interacting with the sites of interest before delivering the drug in the vicinity of the tumor tissues.
Con
flicts of interest
There are no conflicts to declare.
Acknowledgements
Financial support from the Swiss National Science Foundation (Grant #PP00P2_170589) is gratefully acknowledged. L. H. and B. R. R. acknowledge the support by the Swiss National Science Foundation through the National Centre of Competence in Research “Bio-Inspired Materials” and the Adolphe Merkle Foundation.
References
1 R. d’Arcy and N. Tirelli, Polym. Adv. Technol., 2014, 25, 478– 498.
2 M. A. Firer and G. Gellerman, J. Hematol. Oncol., 2012, 5, 70–70.
3 P. K. Shrivastava and S. K. Shrivastava, Curr. Drug Delivery, 2010, 7, 144–151.
4 R. Singh and J. W. Lillard, Exp. Mol. Pathol., 2009, 86(3), 215–223.
5 E. H. Schacht, K. D. Winne, K. Hoste and S. Vansteenkiste, in Pract. Med. Chem, ed. C. G. Wermuth, Academic Press, London, 2ndedn, 2003, pp. 587–600.
6 Y. Takakura and M. Hashida, Pharm. Res., 1996, 13, 820–831. 7 D. E. Morse, Trends Biotechnol., 1999, 17, 230–232.
8 M. Bariana, M. S. Aw, M. Kurkuri and D. Losic, Int. J. Pharm., 2013, 443, 230–241.
9 H. Zhang, M.-A. Shahbazi, E. M. Makila, T. H. da Silva, R. L. Reis, J. J. Salonen, J. T. Hirvonen and H. A. Santos, Biomaterials, 2013, 34, 9210–9219.
10 M. Bariana, M. S. Aw and D. Losic, Adv. Powder Technol., 2013, 24, 757–763.
11 M. S. Aw, S. Simovic, J. Addai-Mensah and D. Losic, Nanomed., 2011, 6, 1159–1173.
12 D. Vona, G. Leone, R. Ragni, F. Palumbo, A. Evidente, M. Vurro, G. M. Farinola and S. R. Cicco, MRS Adv., 2016, 1, 3825–3830.
13 M. S. Aw, M. Bariana, Y. Yu, J. Addai-Mensah and D. Losic, J. Biomater. Appl., 2012, 28, 163–174.
14 T. Kumeria, M. Bariana, T. Altalhi, M. Kurkuri, C. T. Gibson, W. Yang and D. Losic, J. Mater. Chem. B, 2013, 1, 6302–6311.
15 P. Gnanamoorthy, S. Anandhan and V. A. Prabu, J. Porous Mater., 2014, 21, 789–796.
16 R. B. Vasani, D. Losic, A. Cavallaro and N. H. Voelcker, J. Mater. Chem. B, 2015, 3, 4325–4329.
17 B. Delalat, V. C. Sheppard, S. Rasi Ghaemi, S. Rao, C. A. Prestidge, G. McPhee, M.-L. Rogers, J. F. Donoghue, V. Pillay, T. G. Johns, et al., Nat. Commun., 2015, 6, 8791.
18 A. M. Sysel, V. E. Valli, R. B. Nagle and J. A. Bauer, Anticancer Res., 2013, 33, 4203–4212.
19 Y. Gupta, D. Kohli and S. Jain, Crit. Rev. Ther. Drug Carrier Syst., 2008, 25, 347–379.
20 G. J. Russell-Jones, L. Arthur and H. Walker, Int. J. Pharm., 1999, 179, 247–255.
21 R. Fowler, D. Vllasaliu, F. F. Trillo, M. Garnett, C. Alexander, H. Horsley, B. Smith, I. Whitcombe, M. Eaton and S. Stolnik, Small, 2013, 9, 3282–3294.
22 P. S. Perera, R. L. Thompson and M. J. Wiseman, Curr. Nutr. Rep., 2012, 1, 44–54.
23 R. L. Siegel, K. D. Miller, S. A. Fedewa, D. J. Ahnen, R. G. S. Meester, A. Barzi and A. Jemal, Ca-Cancer J. Clin., 2017, 67, 177–193.
24 H. Schohn, J. L. Gueant, M. Girr, E. Nexo, L. Baricault, A. Zweibaum and J. P. Nicolas, Biochem. J., 1991, 280(Pt 2), 427–430.
25 O. Zava, S. M. Zakeeruddin, C. Danelon, H. Vogel, M. Grätzel and P. J. Dyson, ChemBioChem, 2009, 10, 1796– 1800.
26 Y. Ren, L. Jiang, S. Yang, S. Gao, H. Yu, J. Hu, D. Hu, W. Mao, H. Peng and Y. Zhou, Braz. J. Pharm. Sci., 2016, 52, 239–250.
27 J. E. Coughlin, R. K. Pandey, S. Padmanabhan, K. G. O’Loughlin, J. Marquis, C. E. Green, J. C. Mirsalis and R. P. Iyer, Drug Metab. Dispos., 2012, 40, 970–981.
28 S. N. Fedosov, C. B. Grissom, N. U. Fedosova, S. K. Moestrup, E. Nexø and T. E. Petersen, FEBS J., 2006, 273, 4742–4753.
29 J. F. McEwan, H. S. Veitch and G. J. Russell-Jones, Bioconjugate Chem., 1999, 10, 1131–1136.
30 M. Chrominski, A. Lewalska and D. Gryko, Chem. Commun., 2013, 49, 11406–11408.
31 S. J. Slattery, N. Gokaldas, T. Mick and K. A. Goldsby, Inorg. Chem., 1994, 33, 3621–3624.
32 R. M. Pasternack, S. Rivillon Amy and Y. J. Chabal, Langmuir, 2008, 24, 12963–12971.
33 E. Asenath Smith and W. Chen, Langmuir, 2008, 24, 12405– 12409.
34 M. Zhu, M. Z. Lerum and W. Chen, Langmuir, 2012, 28, 416–423.
35 P. A. Siver and H. Kling, Can. J. Bot., 1997, 75, 1807– 1835.
36 K. S. Taraszka, E. Chen, T. Metzger and M. R. Chance, Biochemistry, 1991, 30, 1222–1227.
37 A. R. Jones, H. J. Russell, G. M. Greetham, M. Towrie, S. Hay and N. S. Scrutton, J. Phys. Chem. A, 2012, 116, 5586–5594.
38 C. Carkeet, S. R. Dueker, J. Lango, B. A. Buchholz, J. W. Miller, R. Green, B. D. Hammock, J. R. Roth and P. J. Anderson, Proc. Natl. Acad. Sci. U. S. A., 2006, 103, 5694–5699.
39 J. Ahn, M.-J. Cao, Y. Q. Yu and J. R. Engen, Biochim. Biophys. Acta, 2013, 1834, 1222–1229.
40 Y. Liu, Y. Zhang, P. Dong, R. An, C. Xue, Y. Ge, L. Wei and X. Liang, Sci. Rep., 2015, 5, 11936.
41 K. Leong, C. Y. Looi, X.-M. Loong, F. Cheah, U. Supratman, M. Litaudon, M. Mustafa and K. Awang, PLoS One, 2016, 11, e0152652.
42 A. Fournet, V. Gilard, M. Malet-Martino, R. Martino, P. Canal and M. De Forni, Cancer Chemother. Pharmacol., 2000, 46, 501–506.
43 Y. Fu and W. J. Kao, Expert Opin. Drug Delivery, 2010, 7, 429–444.