Publisher’s version / Version de l'éditeur:
Vous avez des questions? Nous pouvons vous aider. Pour communiquer directement avec un auteur, consultez la
première page de la revue dans laquelle son article a été publié afin de trouver ses coordonnées. Si vous n’arrivez pas à les repérer, communiquez avec nous à [email protected].
Questions? Contact the NRC Publications Archive team at
[email protected]. If you wish to email the authors directly, please see the first page of the publication for their contact information.
https://publications-cnrc.canada.ca/fra/droits
L’accès à ce site Web et l’utilisation de son contenu sont assujettis aux conditions présentées dans le site LISEZ CES CONDITIONS ATTENTIVEMENT AVANT D’UTILISER CE SITE WEB.
Building Research Note, 1985-11
READ THESE TERMS AND CONDITIONS CAREFULLY BEFORE USING THIS WEBSITE. https://nrc-publications.canada.ca/eng/copyright
NRC Publications Archive Record / Notice des Archives des publications du CNRC :
https://nrc-publications.canada.ca/eng/view/object/?id=12d420b8-b1de-49a4-8fc7-a3769e0d3192 https://publications-cnrc.canada.ca/fra/voir/objet/?id=12d420b8-b1de-49a4-8fc7-a3769e0d3192
NRC Publications Archive
Archives des publications du CNRC
This publication could be one of several versions: author’s original, accepted manuscript or the publisher’s version. / La version de cette publication peut être l’une des suivantes : la version prépublication de l’auteur, la version acceptée du manuscrit ou la version de l’éditeur.
For the publisher’s version, please access the DOI link below./ Pour consulter la version de l’éditeur, utilisez le lien DOI ci-dessous.
https://doi.org/10.4224/40000479
Access and use of this website and the material on it are subject to the Terms and Conditions set forth at
Analysis of complex gamma spectra
,
'. > SerTH1
B92
National Research
C o d l nationat
no.238
I$).
Council Canada de rechercheb CanadaDivision-of
Division des
Building Research
&h&rch&s
err
Mtirnent-
Note
Analysis
of
Complex Gamma Spectra
by E.
Evg
in
ANALYSIS
OF COMPLEX
GAMMA
SPECTRA
ANALYZED
by
E.
Evgin
Geo
technical
Section
Division of Building
Research
BRN
238ISSW
0701-5232Ottawa, November 1985
TABLE OF
CONTENTS
A B S T R A C T / R ~ S U M ~
PROBLEMDEFINITION
METHOD OF ANALYSIS
EXPERIMENTAL DATA AND RESULTS
OF
ANALYSISREFEReNCES
PAG E 1 1 3 4 6ABSTRACT
A general method of analysis f o r complex gamma spectra has been used to
analyse the experimental data o b t a i n e d with a dual gamma-ray scanner. The measured mass attenuation coefficients of water f o r americium and cesium
isotopes were within 1 per c e n t of t h e theoretical v a l u e s . In addition, the a p p l i c a t i o n of the method resulted in t h e development of a relationship between t h e c e s i u m readings and t h e influence of cesium on the count rates of americium. The r e l a t i o n s h i p can be used t o correct americium readings and it will significantly reduce the amount of data t o be recorded and the t i m e spent for analysis.
On a utilisE une methode gG&rale d'analyse des s p e c t r e s gamma complexes pour Ctudier les donnges expgrimentales obtenues avec un
explorateur 3 rayons gamma double. k s coefficients dtattGnuation massique de
I'
eau mesurgs pour les i s o t o p e s d e 1' a d r i c i u m et du d s ium nes16cartaient pas d e s valeurs thgoriques par p l u s d e 1 pour cent. I)e p l u s ,
la mEthode a permis dtEtablir une relation e n t r e les lectures concernant le czsiurn
er
de dgterminer ltFnfluence du c6sium sur les taux d e comptage del'am6ricium. La relation peut S t r e u t i l i s h pour corriger les lectures concernant 1'auEricium et permettra de rgduire de f a p n apprgctable la quantit6 de donnges 3 recueillir et le temps consacrg 3 l'analyse.
PROBLEM DEFINITION
Most dual gamma-ray scanners have cesium-137 (Cs) and americium-241 (Am) isotopes- When 'these radioactive sources are u s e d simultaneously, the
strong source, C s , affects the count rates of the weaker source, Am. The a n a l y s i s of experimental d a t a requires the removal of the Cs e f f e c t s from
the Am readings
-
Goft e t al.
(1978)
p r e s e n t e d a method t o correct t h eAm
readings. In h i s experiments, the Am source w a s removed from the radlation beam and aseries of t e s t s was carried out on different thicknesses of material u s i n g
t h e Cs source alone. The number of counts in the region surrounding the Cs
peak was p l o t t e d against the readings in the Am energy range, as shorn in Figure 1. T h i s figure was subsequently used to correct the counts for
Am
when both sources were present in the radiation beam.The d u a l gamma-ray scanner a t the National Research Council of Canada
a l s o has Am and Cs isotopes, as illustrated in Figure 2. Corrections on the Am readzngs are required
i n
the a n a l y s i s of the data obtained w i t h this scanner as w e l l . However, the rnethod presented by G o i t cannot be usedbecause t h e construction of t h e scanner does not allow either of the sources to be removed from the radiation beam. Although the two radioactive sources
a r e separated with an i n t e r n a l shutter, rhe radiation e m i t t e d by Cs is not t o t a l l y c o n f i n e d . When the external shutter is open and the inrernal
shutter is c l o s e d , radiation from both sources is p r e s e n t in the beam. F o r
example, in an experiment with water c o n t a i n e d in a 14 cm wide plexiglas box
w i t h 0 . 3 cm t h i c k walls, t h e count rates were 25,198 cpm for Am and
count rates would be zero. A different method, other than t h e one g i v e n by G o i t , w a s therefore necessary
to
f i n d a r e l a t i o n s h i p similar to the oneshown in Figure 1.
4
Cs-137 IMTENSITY. 10 cpm 1550 - 750 teV) F I G U R E 1
C s - 1 3 7 IWFLUfNCE O N AM-241 R E A D I N G S (FROM G O I T e t a l . . 10781
51
-
EXTERNRL SHUTTER D - DETECTOR52 - INTERNAL SHUTER P - PHOTOMULTIPLiER
C 1 - C4
-
COLLIWTION BLOCKS F I G U R E 2METHOD
OF
ANALYSIS
Several methods have been d e s c r i b e d ia the l i t e r a t u r e for the analysis of cumplcx garsma spectra. These
methods
either analyse the raw datad i r e c t l y , or f i t a curve to the test results prior t o the analysis, Baedecker (1971). A direct method which
is
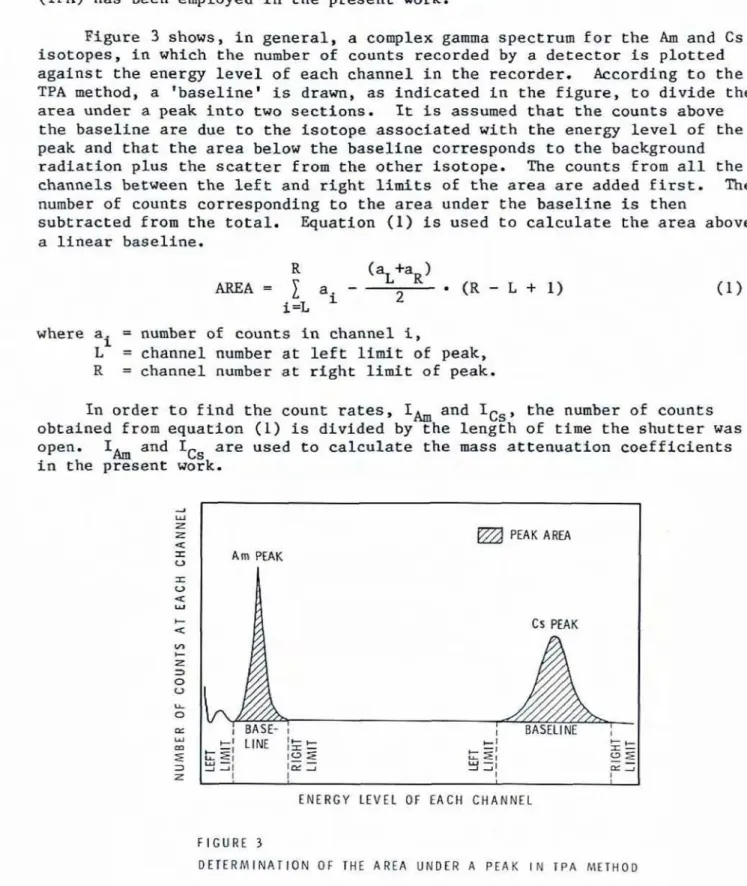
called the "Total Peak Area"(TPA) has been employed i n t h e present
work.
Figure 3 shows, in general, a complex g a m m a s p e c t r u m f o r the
Am
and
Csi s o t & p e s , in which the number of counts recorded by -a detector 1s p l o t t e d against the energy
l e v e l
of each channelin
the recorder. According t o the TPA method, a 'baselinetis
drawn, as indicatedin
the figure, to d i v i d e thearea under a peak into two sections.
It
is assumed that rhe counts above the baseline are due to the Isotope associated with the energy l e v e l of thepeak and that the
area
below thebaseline
corresponds t o the background radiation p l u s the scatter from the other isotope. The counts from a l l the channels k t w k e n the left and right limits of the area are added first. Thenumber of counts corresponding to the
area
under the baseline is thensubtracted from the t o t a l . Equation (1) is used t o
calculate
the area above a linear baseline,where
ai = number 02 countsin
channel i,L = channel number at: left: limit of peak, R = channel number at right limit of peak.
In
order tofind
the count rates,Its
,
the number of countsobtained from equation (1) is d i v i d e d by t e length of time the shutter was open. I& and
ICs
are used to calculate the mass attenuation coefficients in the present w r k .PEAK ARE3
1 i BAS
ENERGY LEVEL OF EACH C H A N N E L F l G U R E 3
EXFERXHENTAL DATA
AND
RESULTS OFANALYSIS
The purpose of t h e experiments was to check t h validity of t h e
analysis and to investigate what accuracy could be achieved w i t h the TPA
method. The theoretical values of the
mass
attenuation coefficients ofwater are 0.205
cm2/g
for Am and 0.085 cm2/g for Cs. The experimentsin
t h i s study were carried our on water using containers w i t h variousdimensions. The mas attenuation coefficients obtained from these t e s t s are p l a t t e d
in
F i g u r e s4
and 5 . The measured values compare w e l l w i t h thetheoretical values with
less
than 1Z error. These resultsshow
that theTPA
method can be used to remove the cesium influencefrom
theAm
readfngs.The analysts of the experimental data with the TPA method resulted in the development of a relationship similar to the one shown in F i g u r e 1. Before any t e s t s were performed on water, the background radiattaa readings
were
takenwhlle
the shutters were keptclosed.
The number of counts was recorded for both theAm
and Cs regions.In
order to f i n d the effect of theCs on the Am readings taken in the experiments on water, the background radiation w a s removed from t h e area under the baseline and the
remaining
Amcounts were plotted against the Cs readings as shown in Figure 6. The
TPA
~ t h o d requires a substantial amount of data t o be recorded. Bowever, once the relationship shownin
F i g u r e 6 is obtafned, it can be used to correct the Am readings in subsequent experiments and the applicationof
t h e TPAmethod in detail can be avoided.
-
THEORFllCAL VALUE (0.205 cm2l91 EXPERIMENTAL RESULTS ANALYSEDWlW TPA MIl-lOD
F I G U R E 4
UI L 4 0 0.16 2
T H E O R E T I C A L VALUE OF MASS ATTENUATION C O E F F I C I E N T OF WATER FOR A M E R I C I U M C O M P A R E D W l T H EXPERIMENTAL R E S U L T S A N A L Y S E D W l T H TPA METHOD
-
- 4 l l l l l l f l l l l l D 2 4 6 8 10 12 14 C O N T A I N E R W I D T H , cmREFERENCES
Baedecker, P.A., ( 1 9 7 1 ) . D i g i t a l methods of photopeak integration f n
activation analysis. Analytical Chemistry, Vole 4 3 , No. 3,
pp. 405-410.
G a i t , J.B., Groenevelt, P.H., Kay,
B.D.
and Lock, J.G.P., (1978). Thea p p l i c a b i l i t y o f dual gamma scanning t o freezing s o i l s and the problems of s t r a t i f i c a t i o n , Journal of S o i l Science S o c i e t y of America,