A Clinical Trial of TrenDx: An Automated
Trend-Detection
Program
by
Phuc Van Le
B.S., Electrical Engineering and Computer Science MIT, 1996
Submitted to the Department of Electrical Engineering and Computer Science in Partial Fulfillment of the Requirements for the Degree of
Master of Engineering
in
Electrical Engineering and Computer Science at the
Massachusetts Institute of Technology
September, 1996
@1996 Phuc Van Le. All rights reserved
The author hereby grants to MIT permission to reproduce and to distribute publicly paper and electronic copies of this thesis document in whole or in part.
of Author
By
by
... ... ... .. ... ... ... ...
Department of Electrical Engineering and Computer Science August 26, 1996
Professor Peter Szolovits
Department of Electrical Engineering and Computer Science Thesis Supervisor
leric R. Morgenthaler Chairman, Depftment Committee on Graduate Students Signature
Certified
A Clinical Trial of TrenDx: An Automated Trend-Detection Program
by
Phuc Van Le
Submitted to the Department of Electrical Engineering and Computer Science September, 1996
in Partial Fulfillment of the Requirements for the Degree of
Master of Engineering
in
Electrical Engineering and Computer Science
Abstract
We carried out a trial designed to assess the performance of a computer program called TrenDx at the task of diagnosing growth disorders in children, given a limited set of data. We compared the performance of TrenDx to that of physicians performing the same task. The task consisted of reviewing a growth chart of a patient and deciding whether the patient should be referred to a growth clinic for a possible growth problem, giving a preliminary diagnosis, and choosing the time which it would have been appropriate to refer the child. The test cases consisted of the height, weight, and bone-age data of 95 children that had been referred to the Boston Children's Hospital. The patient cases were organized into packets of 10 and distributed to physicians. 22 physicians participated. Two gold-standards were used, the medical record diagnosis and the opinion of a pediatric
endocrinologist. A scoring algorithm was devised based on the responses of the pediatric endocrinologists. The performance of the experts compared to the medical record indicated that it was possible to accomplish the task that we had designed. When compared to the medical record diagnosis, TrenDx and the physicians performed similarly in terms of referring patients, but the physicians chose the correct diagnosis more often. Compared to the experts, the physicians performed better than TrenDx in terms of referral decision and score.
Thesis Supervisor: Peter Szolovits.
Acknowledgments
It is 6 in the morning, and I've slept 3 hours in the past 2 days. I'm writing this to remind myself of what I can accomplish, given the right motivation. I think I'm getting carpal tunnel syndrome.
I don't have a wise sayings or quotes. I would just like to thank everyone who has helped me to be what I am today and will become tomorrow.
* My parents and family are the most important people in the world to me. Without you, I
would not exist. Thank you.
* My two thesis advisors, "Venerable Grandfather" Peter Szolovits and Isaac "Zak" Kohane, and Ira Joseph Haimowitz, who hired a naive sophomore who had no clue what he was getting himself into. I owe you three more than I can fit onto this page.
* I would also like to thank the people that participated in the trial, both the subjects and the experts.
* To Jane and Yao, who helped me see what being a doctor really meant.
* And to the two groups of people without whom my time at MIT would have been truly miserable :
To my friends on Conner 5 -May you always be able to just sit around and talk
To my volleyball buddies - 1,2,3 "Phil!"
* I would also like to thank the Whitaker Foundation for supporting me for the year and summer that I was working on this.
Table
Of Contents
1. INTRODUCTION
1
0
1.1. Pediatric Growth Monitoring 10
1.2. Introduction to TrenDx 11
1.3. Evaluation 11
1.4. Guide to this Thesis 12
2. TRENDX
14
2.1. TUP 14
2.2. Temporal Constraints 15
2.3. Value Constraints 16
2.4. Trend Templates and Hypotheses 18
2.5. Monitor Sets 19
2.6. Previous Evaluations 19
3. METHODS
23
3.1. Packet Creation and Distribution 23
3.1.1. Test Case Criteria 23
3.1.2. Patient Record Collection 24
3.1.3. Data-Entry 25
3.1.4. Packet Creation, Distribution, and Return 25
3.1.5. The Task 26
3.3. Performance Measures 29 3.3.1. Comparison To Medical Record Diagnosis 29
3.3.2. Comparison to Expert. 30
3.3.3. Multiple Comparisons 33
3.4. Comparison to Other Evaluations 33
4.
TRENDX DEVELOPMENT
35
4.1. Programming 35
4.2. Modeling Growth 35
4.2.1. Standards 35
4.2.2. Description of Growth States 37
4.2.3. Modeling 39
4.3. Trend Template Refinement 43
4.3.1. Establishing Performance Goals and Training Sets 43
4.3.2. Error-Function Models 44
4.3.3. Residual Mean Square Error vs. MAPE 46
4.3.4. Thresholds for Triggering 47
5. RESULTS
49
5.1. Comparison to Medical Record Diagnosis 49
5.1.1. Referral Decision of TrenDx vs. Human Subjects 50 5.1.2. Decision-Breakdown by Abnormal Sub-Populations 52
5.1.3. Summary 55 5.2. Comparison to Experts 55 5.2.1. Referral Decision 55 5.2.2. Preliminary Diagnosis 57 5.2.3. Scores 57 5.2.4. Summary 59
5.3. Comparisons Without Gold-Standards 59
5.3.1. Expert vs. Medical Record 59
5.3.3. Summary
5.4. Variations in Threshold Triggering 62
5.4.1. Results of Raising Threshold Triggering Values 62
5.4.2. Results of Lowering Threshold Triggering Values 62 5.4.3. Ignoring Certain Error-Scores 63
5.5. Referral Decision Timing 64
6. DISCUSSION 66
6.1. Analysis of Results 66
6.1.1. Performance of Test Subjects vs. Medical Record Diagnosis 66 6.1.2. Performance of Test Subjects vs. Expert Gold-Standard 67
6.1.3. Comparisons Without Gold-Standard 67
6.1.4. Referral Timing 68
6.2. Performance of TrenDx 68
6.2.1. Worse than Physicians (?) 68
6.2.2. Reasons for Poor Performance 69
6.3. Limitations of This Trial 72
7. CONCLUSION 75
7.1. Summary of Results 75
7.2. Lessons Learned 75
7.3. Future Work 76
8. APPENDIX A - PATIENT AND SUBJECT RESULT TABLES 77 9. APPENDIX B - PACKET DIRECTIONS AND SAMPLE CHART 123
Table
of Figures and Tables
FIGURE 1: TWO LANDMARK POINTS IN THE LIFE OF AN INDIVIDUAL 15
FIGURE 2: AN INTERVAL REPRESENTING THE LIFE OF AN INDIVIDUAL. 16 FIGURE 3:A NOW-BASED TREND-TEMPLATE INTERVAL. 16 FIGURE 4: EXAMPLES OF POSSIBLE VALUE CONSTRAINTS 17 FIGURE 5: TREND-TEMPLATE FOR NORMAL MALE GROWTH 19 FIGURE 6: SAMPLE HUMAN SUBJECT RESPONSE 27 FIGURE 7:SAMPLE GOLD-STANDARD RESPONSE 28
FIGURE 8:CURRENT TREND-TEMPLATE FOR NORMAL MALE GROWTH 40
FIGURE 9: PREVIOUS TREND-TEMPLATE FOR NORMAL MALE GROWTH(HAIMOWITZ) 41
FIGURE 10: COMPARISON OF SIMPLE AND COMPOUND VALUE CONSTRAINTS TO
CONSTRAINT-BASED TRENDX 45
FIGURE 11: POSSIBLE COMPOSITE ERROR-FUNCTIONS 46
TABLE 1:TRENDX MATCHING RESULTS ON TERTIARY CARE PATIENTS, FROM
(HAIMOWITZ) 21
TABLE 2: TABLE OF RESULTS FOR A SAMPLE PATIENT 32 TABLE 3: MEDICAL RECORD DIAGNOSES OF TRIAL CASES 49 TABLE 4: TRENDX DECISION VS. MEDICAL RECORD DIAGNOSIS 50
TABLE 5: ALL PHYSICIANS VS. MEDICAL RECORD DIAGNOSIS 51
TABLE 6: PRE-RESIDENCY SUBJECTS VS. MEDICAL RECORD DIAGNOSIS 51
TABLE 7: POST-RESIDENCY SUBJECTS VS. MEDICAL RECORD DIAGNOSIS 51
TABLE 8: DISORDER POPULATION REFERRAL AND DIAGNOSIS RESULTS, TRENDX VS.
MEDICAL RECORD 53
TABLE 9: DISORDER POPULATION REFERRAL AND DIAGNOSIS RESULTS, 53
TABLE 10: DISORDER POPULATION REFERRAL AND DIAGNOSIS RESULTS, 54 TABLE 11: DISORDER POPULATION REFERRAL AND DIAGNOSIS RESULTS, 54 TABLE 12: TRENDX DECISION VS. EXPERT GOLD-STANDARD 55
TABLE 13: TRENDX DECISION VS. EXPERT AND MEDICAL RECORD CONSENSUS 56
TABLE 14: PHYSICIANS VS. EXPERT GOLD-STANDARD 56
TABLE 15: PHYSICIANS VS. EXPERT AND MEDICAL RECORD CONSENSUS 57
TABLE 17: TEST SUBJECT SCORES 58
TABLE 18: AVERAGE SCORE BY DISORDER SUB-POPULATION 58
TABLE 19: EXPERT DECISION TO REFER VS. MEDICAL RECORD DIAGNOSIS 59
TABLE 20: DISORDER POPULATION REFERRAL AND DIAGNOSIS, EXPERT VS. MEDICAL
RECORD 60
TABLE 21: CONSENSUS AND SINGULAR REFERRAL DECISIONS 61
TABLE 22: RESULTS OF RAISING TRIGGERING THRESHOLDS 62
TABLE 23: RESULTS OF LOWERING TRIGGERING THRESHOLDS 63 TABLE 24: RESULTS OF IGNORING FIRST NON-TRIVIAL POINT 64 TABLE 25: RESULTS OF IGNORING INFANT SCORES 64 TABLE 26: TIMING OF REFERRALS FOR TRENDX VS. EXPERT 65 TABLE 27: TIMING OF REFERRALS FOR HUMAN SUBJECTS VS. EXPERT 65
1.
Introduction
In many domains, experts can judge the state of a process by examining the data produced by the process and then matching these data to stereotypical patterns specific to
different states. Haimowitz defines the term trend as a clinically significant pattern in a sequence of time-ordered data (Haimowitz). Thus, trend-detection is the task of judging the state of a process by matching the data produced by the process to different trends. This trend-detection is applicable in many domains. We are particularly interested in evaluating its application to the domain of medicine, where the task of diagnosis can be viewed as matching a patient's findings to trends that are typical of certain conditions.
The computer program TrenDx was developed by Haimowitz based on this premise - "that a computer program with knowledge of time-varying constraints on measured data can be used for automated trend detection."(Section 1 Haimowitz). TrenDx was tested in a limited manner as part of its original development. This research is a more stringent
evaluation of TrenDx at the task of diagnosing growth disorders in children from their height, weight, and bone-age data.
1.1.
Pediatric Growth Monitoring
Health care systems have been under intense pressure to become more efficient and cost-effective. This has had many consequences, including forcing physicians to see more patients and spending less time with each individual patient. Often, these time pressures have led to care that is less than optimal. The direct experience of one of the advisors of this thesis has found that children with growth problems are not being diagnosed, and therefore treated, in a timely fashion. Similarly, patients with normal growth are
sometimes referred to tertiary care centers for expensive work-ups because their physicians misdiagnose normal patterns of growth.
Being able to diagnose referrals correctly more often would improve health care because patients with abnormal growth would be diagnosed and treated before their conditions become grossly apparent and possibly untreatable. Reducing mortality and morbidity while lowering the cost of care by eliminating needless referrals are the ultimate
goals of this research. However, these goals must be accomplished without increasing the physician's workload.
Thus, the task of pediatric growth monitoring is an important one in which the performance of pediatricians can possibly be improved upon by applying automated
trend-detection. In the growth clinic at the Boston Children's Hospital, pediatric
endocrinologists routinely quiz one another by asking their peers to make a diagnosis solely from the information contained on a patient's growth chart. Furthermore, Becker notes that "Thus, the monitoring of linear growth is a remarkably cost-effective screening for the documentation of good health or for determining the presence or severity of chronic disease." (Becker)
1.2. Introduction to TrenDx
TrenDx is described in more detail in section 2. It is also described in its entirety in (Haimowitz; Haimowitz and Kohane; Haimowitz and Kohane). Briefly, knowledge-engineers and domain specialists outline stereotypical patterns in temporal data using the modeling language incorporated into TrenDx. These patterns, called trend-templates, consist of partially ordered temporal intervals, each with constraints on all the data that fall into that particular interval. Data within each interval are matched to the constraints
associated with the interval using linear regression techniques, producing an error-score which indicates how well the data match to the particular trend-template. Trend-templates are grouped into competing sets called monitor sets, from which the best-scoring trend-template is considered to be the current hypothesis or diagnosis.
1.3.
Evaluation
A rigorous evaluation is an essential part of the development of any system
(Heathfiled and Wyatt; Waterman). A statement of the exact goals of this evaluation is
necessary.
* We wish to assess the performance of a computer program, TrenDx, at the task of
recognizing growth disorders in children from a limited data set and then referring the child to a specialist if appropriate.
The immediate goal of the evaluation is to show that TrenDx can perform this task
with some expertise. The long-term goal of the development of TrenDx is to create a smart
monitoring system that can detect the state of a process by recognizing significant trends in the data produced by the process and cause some type of action to be taken if the data suggest an undesirable state. In addition, we wish to improve the state of expert-systems concerning the incorporation of temporal knowledge into their knowledge base.
development of a system and are characterized by more controlled conditions such as retrospectively chosen cases, "clean" data, and users who are very familiar with the systems. A handful of systems are carried through to the stage where field trials are
appropriate. In field trials, the environment is much less controlled, causing new problems to arise. These generally include a wider range of cases, novice users, a larger setting,
different outcome measures, and potential legal and ethical considerations concerning the use of the output generated by these programs.
At this stage in the development of TrenDx, a laboratory trial of the performance of the program is appropriate. Thus, we have designed a retrospective clinical trial of TrenDx in which the performance of TrenDx is compared to human experts -physicians. Both TrenDx and the human subjects, collectively referred to as the test subjects, are given the complete set of height, weight, and bone-age data available for a patient. The test subjects must decide if they would recommend that the patient be referred to the endocrine division to be worked-up for a possible growth problem. The test subjects are also asked to give a preliminary diagnosis and choose the age at which the referral should have been made. All answers are measured against a gold-standard expert panel of pediatric endocrinologists. In addition, the decisions of the gold-standard expert panel are compared to the diagnosis written in the patient's medical record.
This task can be viewed as that of one physician giving a second opinion to a colleague who suspects that one of his or her patients has a growth problem. The task is also analogous to that of the individual in a managed care organization who has to decide whether a referral to a tertiary care center is warranted. In section 3.4, the characteristics of this trial are compared to some of the other types of evaluations of decision-support
systems that have been carried out.
1.4. Guide to
this
Thesis
Section 2 describes TrenDx and the trend-representation language which TrenDx uses. Intervals, value constraints, trend-templates, and monitor-sets are all explained well enough for someone unfamiliar with the program to understand the work presented in this thesis. The section also discusses the most recent evaluations of TrenDx and some of their
weaknesses.
In section 3, all the work not directly related to the development of TrenDx and the trend-templates used in this trial are presented. This work includes the collection of test cases, the transcription of the data into electronic format, the creation of test packets for
distribution to the participants, and the task which the participants in the trial must complete. The two gold-standards for this evaluation are also discussed, as well various
measures which were used to evaluate the performance of TrenDx and the 22 human participants. Finally, a comparison to other evaluations of expert-systems / decision-support systems is made.
The development of TrenDx comprises the bulk of Section 4. The work that was done can be categorized as programming improvements into TrenDx, creating trend-templates that model the different growth states/disorders involved in the trial, and engineering and refining of the trend-template parameters to achieve a desired level of performance.
Section 5 presents the results of the trial. Some of these include the results of comparisons between the gold-standards and the decisions made by the subjects,
comparisons between the gold-standards themselves, and the results of various changes to the mechanism used to interpret the scoring system of TrenDx as actions, such as "refer" or "deny referral."
The discussion of the results can be found in section 6. Conclusions about the trial and the future work / uses of TrenDx are in section 7.
Appendix A -Patient and Subject Result Tables, contains the entire listing of the results of the trial, by patient case and by human subject. Appendix B -Packet Directions and Sample Chart, includes the directions presented to the participants and a sample chart similar to the ones on which they indicated their responses. Appendix C -Trend Template LISP Code, shows the LISP code for all of the trend-templates used the the trial, for those who are interested in such things.
There are several conventions used in this thesis. For example, the word subjects is used to refer to both TrenDx and the physicians that participated in the trial. It does not include the pediatric endocrinologists who provided one of the gold-standards. The terms human subjects, participants, volunteers, and physicians all refer to the human subjects who participated in the trial, even though not all of them are physicians. The gold-standard provided by the pediatric endocrinologists can also be referred to as the expert opinion or the expert decisions. Patient cases, cases, and patients all refer to the patient cases that were reviewed by the subjects and the experts in this trial. Finally, references to tables and
figures will usually only contain the caption name and number, such as Table 1. However, if, there is a possibility for ambiguity, then the title of the reference will also be included, such as Table 1:TrenDx matching results on tertiary care patients, from (Haimowitz).
2.
TrenDx
The most detailed description of TrenDx can be found in (Haimowitz). The brief description presented here is provided to supplement the discussion of improvements to the program and the engineering choices made in the representation of growth disorders that is presented later in this thesis.
TrenDx diagnoses trends by matching time-ordered process data to the competing trend templates in each monitor set assigned to that process. TrenDx begins matching by instantiating each trend template for the monitored process. TrenDx then computes all temporal worlds in which the currently interpreted data may be assigned to intervals of the trend template. Each temporal world represents a different hypothesis for the same trend template. For each hypothesis, TrenDx assigns the data to the appropriate trend template intervals and computes the matching scores of the relevant value constraints. The value constraint scores are combined to an overall error score for each hypothesis. Finally, the top hypotheses for each trend template are maintained via a beam search. The output of TrenDx is a list of the top hypotheses for each trend template within a monitor set, with the score of each hypothesis. (Section 4 Haimowitz).
2.1.
TUP
TrenDx manipulates temporal assertions and queries using the Temporal Utility Package, or TUP, developed by Kohane (Kohane). TUP is a set of temporal utilities which allow TrenDx to represent time points and intervals, as well as reason about uncertainty in temporal distances. For example, TUP allows the expression of time intervals with uncertain endpoints. Furthermore, TUP provides the ability to deal with alternate temporal worlds. Alternate temporal worlds are contexts in which different temporal assertions apply. For example, say a user specified that Event A occurred
sometime between January 1, 1990 and December 31, 1990. Then say that another event, Event B, occurred on July 1, 1990. From the known information, Event B could occur before, at the same time as, of after Event A. TUP allows the formulation of alternate temporal worlds wherein each of the relationships between Event A and Event B is asserted.
The ability to deal with time is an important aspect of any medical decision-support
system. This is especially true in the domain of pediatric growth monitoring. One of the
conclusions of the INTERNIST-1 program was that the inability to incorporate temporal
information into the program was one of its major weaknesses (Miller, Pople and Myers). The use of TUP enables TrenDx to incorporate this type of knowledge into its models and reasoning.
2.2. Temporal Constraints
The temporal aspects of a trend-template include landmark points and
intervals. Landmark points represent significant events during a process. For example,
BIRTH and DEATH would be considered landmark points in the process of a person's life. The temporal distance between landmark points can be specified with a set of lower and upper bounds (MIN MAX), indicating the minimum and maximum difference in time between the two points. For example, for a person who lived exactly 80 years, the temporal distance between their BIRTH and DEATH would be represented by ((years 80) (years 80)). This specifies that both the minimum and maximum distance between the BIRTH and DEATH landmark points is eighty years, meaning that exactly eighty years separated the two points. To represent the fact that a particular person died sometime between the ages of 13 and 20, the (MIN MAX) set would look like ((years 13) (years 20)). Figure Ishows a timeline with the landmark point DEATH occurring 13 to 20 years after BIRTH. BIRTH DEATH
*
*
4
I
I
I
II
I
0 5 10 13 15 20 Time (years)Figure 1: Two landmark points in the life of an individual
Intervals are used to represent different phases of a process. In TrenDx, intervals are represented by a Begin point and an End point. The temporal distance between the two represents the duration of the interval. Begin and End points can also have uncertainty ranges associated with their relation to another time point, either a landmark point or an interval Begin/End point. In Figure 2 we extend the previous example by adding an interval representing the time period over which the person lived.
As suggested before, interval Begin/End points can be defined relative to other interval Begin/End points. One common relationship between two intervals occurs when
one interval directly follows another. In that case, the End point of the first interval is equal in time to the Begin point of the second.
BIRTH DEATH LIFE
A
4
I
I
I
I I
I
0 5 10 13 15 20 Time (years)Figure 2: An Interval Representing the Life of an Individual. In some cases, it is more relevant to view time backwards beginning from a particular time point. Most often, the particular time point is the present. For example, to determine whether a child is obese, the state of the child at the present time is much more important than the child's state 2 years ago. Similarly, to determine whether the child has a fever, it is the current temperature of the child that is relevant. The need to model this view
of time led to the development of what is called a Now-Based trend-template.
A Now-Based trend-template has an additional anchor point called 'now' which
represents the most recent data point. The 'now' point is updated to be equal in time to each new data point that is processed. This allows a user to design a trend-template and set the interval Begin/End points relative to 'now.' Figure 3 is an example of a Now-Based
trend-template that models a child with fever. The duration of the Fever interval is
represented relative to 'now' and extending back somewhere between 30 minutes to 2 hours.
Ben Fever Ed
2 1.5 05 Now
Time (hours)
Figure 3:A Now-Based Trend-Template Interval.
2.3. Value Constraints
A value constraint is composed of two main components. The first component is a
numbers. The second component is a linear regression model describing the pattern of the output of the first component.
The first component can be as simple as a function that simply returns the numerical value of each time-stamped datum. Or it may return some more complicated function of
several data points of different types. An example of a simple function may just return a sequence of the height Z-scores, which represent how many standard deviations the child is from the average height at that particular age. A more complicated function is one which returns the ratio of weight to weight for height-age, which we call Build.
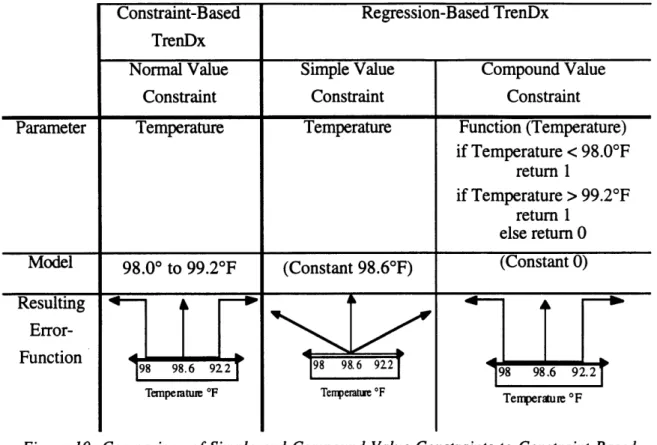
The second component, which we call the error function, can be one of a set of up to 2nd order polynomial functions. The constant and 1st order polynomial functions can even specify the value and slope of the function to be matched against the data. In other words, the second component can specify that the sequence returned by the first component should be matched to a constant of known or unknown value, a line of some known or unknown slope, or a 2nd order polynomial curve with first and second derivatives positive or negative. Figure 4 gives some examples of value constraints.
Examples of Possible Value Constraints
Concept
Component 1
Component 2
Pulse Constant at 60 Pulse (Constant 60) bpm
Blood Pressure Linear Blood Pressure (Linear (Dl -)) and Falling
CPU speed Quadratic CPU Speed (Quadratic (DI +) (D2 +)) with Time
Figure 4: Examples of Possible Value Constraints
The sequence is matched to the error function, producing the residual mean square error. This is repeated for all the value constraints of all intervals of the trend-template. The residuals are combined by using a weighted average of the fits to each value constraint, where the weight is proportional to the number of data points in each value constraint.
Haimowitz suggests using the Mean Absolute Percent Error, or MAPE, because
parameters with larger ranges will have a larger variance of residuals (Section 4.4.1
Haimowitz). Using the percent error allows one to combine the errors from different value
constraints correctly. However, the use of MAPE is not applicable when the expected
value of the parameter is zero. This is discussed in section 4.3.
Originally, TrenDx used simple upper and lower bounds to determine whether a
data point matched to an interval well (Haimowitz and Kohane; Haimowitz and Kohane).
Only one trend-template was active at any single time and it was considered the current
hypothesis. When a data point exceeded the upper or lower thresholds, another
trend-template was triggered or some other action, such as an alarm, was taken.
This style of value-constraint matching was known as Constraint-Based TrenDx. It
was originally designed to mimic the stream of thought of an expert. For example, an
expert would start off with the hypothesis that the child was normal. Then, if the child's
height was too low, the expert would then discard the current hypothesis and consider
Constitutional Delay of Puberty as the current hypothesis.
Constraint-Based TrenDx suffered from many drawbacks. Similar to other
threshold-trigger systems, Constraint-Based TrenDx was brittle. For example, if the lower
threshold on a value was -2.0, then a value of -2.1 would cause the current hypothesis to
be discarded, while a value of -2.0 would not. In addition, there was no difference
between having a data point that was exactly normal and one which fell just within the
allowable threshold. Regression-Based TrenDx was developed to remedy some of those
problems.
2.4. Trend
Templates
and Hypotheses
A trend-templates represents an overall state of a process. It is comprised of a partially ordered set of intervals, each with one or more value constraints associated with them. When a trend-template is instantiated for a patient, a temporal context is created in which the BIRTH landmark point of the patient is anchored to the time and date that the patient was born. When alternate temporal worlds are possible, the context branches, producing multiple child contexts that represent each of the possible temporal worlds.
Thus, each hypothesis for a patient consists of a trend-template, a temporal context, and an assignment of the patient data to the intervals of the trend-template that is dependent on the temporal context.
Figure 5, is an example of the complete trend-template for Normal growth in males. Notice that this trend-template only tries to model life up to and a little beyond the point where growth stops.
Trend Template for Normal Male Growth
Chron age Chron age Ht Z-score Ht-vel Z-score - bonage - bone age
(-2,2) (-2,2) (-1,1) Ht
HtZscore Build - -
-- Wt Z score -- Growth
Childhood-to-Adulthood Ends t+10
Early childhood' PuGrowth
M.
Puberty st,th onset ops b
B' th
I I I I I I I I
0 2 3 10 13 12.5 14.5 16 19 Age
Pub St. Pub St. (years)
Pubertal Pub St. . Pub St.3
1 i___ Tanner Tanner
S Tanner Tanner 5
Tanner 1 2 4
Figure 5: Trend-Template for Normal Male Growth
2.5.
Monitor Sets
Trend-templates are grouped into competing sets called monitor sets. Haimowitz defines a monitor set as a set of trend templates forming a clinical context for monitoring. Error scores from each trend-template can be compared with the error scores from the other trend-templates within the monitor set to determine which trend-template has the best fit to the data.
Since a monitor set describes a group of competing trend-templates, it typically consists of a 'normal' trend-template that represents the process in its normal state and one or more 'abnormal' trend-templates that represent fault states.
2.6.
Previous Evaluations
In (Haimowitz and Kohane), the performance of constraint-based TrenDx was evaluated, using a panel of three pediatric endocrinologists as a gold-standard. Out of the 20 test cases, 14 were diagnosed correctly by TrenDx.
Haimowitz later performed an evaluation of the regression-based TrenDx as part of his thesis (Section 5.1 Haimowitz). This version of TrenDx will be denoted the
thesis-TrenDx. In the evaluation of thesis-TrenDx, two sets of test cases were used. The first consisted of 30 cases. Of these, there were 4 Normal, 10 had Constitutional Delay of Puberty, 3 were diagnosed with Early Puberty, and 13 suffered from Growth-Hormone Deficiency. The monitor set consisted of trend-templates for Normal growth, Early
Puberty, and Constitutional Delay of Puberty. For the Growth-Hormone deficiency cases, a diagnosis of Constitutional Delay of Puberty was considered correct.
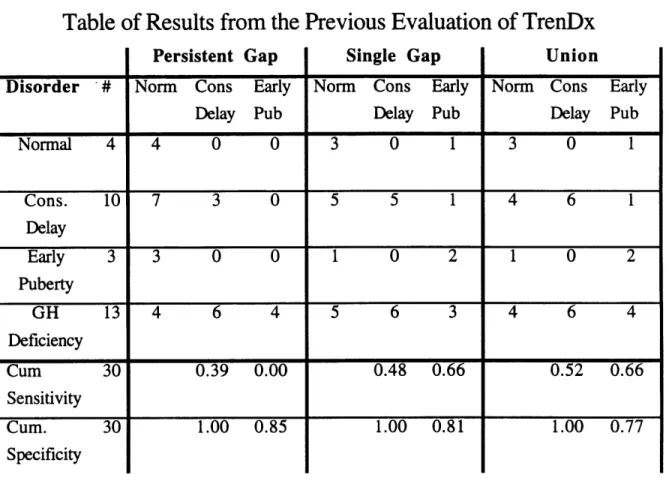
Table 1 is adapted from (Haimowitz). It shows the performance of thesis-TrenDx on the 30 cases. The column labeled 'Persistent Gap,' 'Single Gap,' and 'Union' describe the criteria used to determine whether the Constitutional Delay or Early Puberty trend-templates overtake the Normal Growth trend-template. In essence, 'Persistent Gap'
requires that the Normal Growth trend-template scores somewhat worse than either of the other two trend-templates for two consecutive time points. 'Single Gap' requires that the Normal Growth trend-template scores significantly worse than either of the other two trend-templates. 'Union' is the union of the both Persistent and Single gap triggering mechanisms. The use of Persistent Gap is to try to reduce some of the brittleness inherent in using threshold-triggering, as discussed in Section 2.3. Formally:
* Persistent gap: For two consecutive visits, the best hypothesis for P scored 0.8 or less times the best hypothesis for Normal Growth.
* Single gap: For one visit, the best hypothesis for P scored 0.6 or less times the best
hypothesis for Normal Growth.
* Union: Either Persistent Gap or Single Gap.
Where P is the trend-template for either Constitutional Delay of Puberty or Early Puberty. The sensitivity and specificity of thesis-TrenDx was calculated for the diagnosis of both Constitutional Delay of Puberty and Early Puberty as follows:
sensitivity for P =(number with P and TrenDx triggers P) / (Number with P)
specificity for P = (number without P and TrenDx does not trigger P) / (Number without P)
Notice that the sensitivities are low, ranging from 0.0 to 0.66, while the specificities are good, ranging from 0.77 to 1.0. Clearly, the results could have been changed by changing the triggering criteria. Lowering the threshold value used to trigger
the alternate trend-templates would most likely have increased the sensitivity at the cost of decreasing specificity. This is a common tradeoff that is described by a Receiver Operator Characteristic Curve(Pagano and Gauvreau).
Table of Results from the Previous Evaluation of TrenDx
Disorder # Normal 4 Cons. 10 Delay Early 3 Puberty GH 13 Deficiency Cum 30 Sensitivity Cum. Specificity Persistent Gap
Norm Cons Early Delay Pub 4 0 0 7 3 0 3 0 0 4 6 4 0.39 0.00 1.00 0.85 Single Gap
Norm Cons Early Delay Pub 3 0 1 5 5 1 1 0 2 5 6 3 0.48 0.66 1.00 0.81 Union
Norm Cons Early Delay Pub 3 0 1 4 6 1 1 0 2 4 6 4 0.52 0.66 1.00 0.77
Table 1:TrenDx matching results on tertiary care patients, from (Haimowitz)
The second set of test cases used consisted of 20 cases taken from the files of a general pediatrician. These cases were considered 'normal' by the pediatrician, but were not reviewed by any pediatric endocrinologists. The table presenting the results of those 20 additional cases (Table 2 Section 5.1 Haimowitz) has several small inconsistencies and will not be included here. The results of the second set of test cases has very little effect on the Cumulative Specificity of the program.
There are several characteristics of the trial that incorporate bias or weaken the strength of the results. One of the most obvious problems with the trial is the small number of trend-templates. In fact, combining the diagnosis of Growth-Hormone Deficiency with Constitutional Delay of Puberty is very suspect. While both conditions exhibit short stature as a result of delayed growth, Constitutional Delay of growth is generally considered a benign condition and not worthy of a growth clinic referral unless the patient has a very extreme case. On the other hand, Growth Hormone Deficiency is a true, secondary
disturbance of growth that can be related to even more serious problems such as a craniopharyngioma (brain tumor). A second problem with the trial is that some of the Growth-Hormone Deficiency cases had been used previously as test cases in a previous trial (Haimowitz and Kohane) of Constraint-Based TrenDx. Thus, the test was biased because those cases had influenced the previous development of the Regression-Based TrenDx. However, the design of the test was appropriate to the level of development of the program. Formal evaluations, such as double-blind, comparative studies are less
appropriate at early levels of development because the experts should probe the inference engine and knowledge base of the program, not just be worried about final program results.
In summary, the results of the evaluation were promising. However, they indicated that further work would be necessary to improve the performance of the program and that a more complete evaluation of the program would be appropriate at that time.
3.
Methods
We have conducted an experimental trial of a revised version of TrenDx using 95 newly-collected patient cases taken sequentially from the patients referred to the Endocrine Division at the Boston Children's Hospital. The cases were screened for inclusion into the trial, then the data in the cases were transcribed and placed into packets for each human subject. Each packet contained growth charts for 10 test cases, distributed to try to achieve an even distribution of test cases. The packets were distributed as participants were found. The participants consisted of physicians, medical students, and a registered nurse. Over 80 packets were created and distributed, but only 22 were returned. The medical record diagnosis for each of the cases was obtained and used as one gold-standard. A pediatric endocrinologist not involved with the development of the program provided a second
gold-standard for the trial.
TrenDx was updated and improved, independent of the test cases that were going to be used for the trial. New trend-templates were designed to try to take into account a new variation of triggering as well as improve over the performance of thesis-TrenDx. In fact, this trial is the first formal test of any trend-templates other than those for Normal Growth, Early Puberty, or Constitutional Delay of Puberty. Several problems with the use of 'now-based trend-templates were uncovered and solved. The development of TrenDx is
discussed in Section 4.
3.1.
Packet Creation and Distribution
3.1.1. Test Case Criteria
The occurrence of growth abnormalities in the general population is too low to use
it as a test population -for example, Congenital Growth Hormone Deficiency occurs in approximately 1 out of 16,000 people (Kaplan). However, arbitrarily picking a certain
number of cases of different pathologies is difficult to justify because the numbers would
not reflect the relative frequency of the different pathologies that are referred to the growth
clinic. Consequently, we decided to take cases randomly chosen from patients that had
been referred to the Division of Endocrinology at the Boston Children's Hospital. This
population has both a high proportion of abnormal patients, as well as normal patients that
had some characteristics of abnormal patients. Some of the cases were not referred to the
growth clinic because of a suspicion of growth abnormality, but were referred for some
Recall that the motivation of the program was to improve the performance of physicians in the domain of pediatric growth monitoring by helping to diagnose children
with growth disorders and by reassuring the physician that a normal child is truly normal. One might argue that using a referral population only tests the ability of the test subjects to do the latter task and not the former -i.e. that using this test population only allows us to catch patients with normal growth who were referred incorrectly and that it does not allow us to catch patients with abnormal growth who were not referred. However, a child who does have a true growth disorder will become more symptomatic as time progresses. In fact, most of the disorders cause the children to fall 2 or 3 standard deviations below the mean height for that age and to keep falling away from their peers. Thus, it is a somewhat simple task to recognize a child with a growth disorder if the child has been suffering from it long enough. Our aim is to improve the timing of the diagnosis and referral to minimize morbidity in these children.
Other evaluations have used referral cases in a similar fashion. Heckerman uses referral cases in his evaluation of the Pathfinder program (Heckerman and Nathwani). In an evaluation of four decision-support systems by (Berner et al.), the test cases consisted of referrals to a "...group of 10 nationally recognized consultants in the fields of general internal medicine, eight subspecialties of internal medicine, and neurology..." They chose to use the referral cases to ensure that the cases were diagnostically challenging.
3.1.2.Patient Record Collection
To decide whether to accept a patient case into the trial, the physical record was
scanned and the age at which the child was first referred to the clinic was noted. If the record contained data for at least three time points before the referral date, we tentatively accepted the case. A second criterion was that only patients that were referred more than one year ago were accepted. This was done to allow the true clinical outcome of the patient to be used as one of the standards. We then screened out previously diagnosed cancer patients. There were two reasons for this decision. First, both cancer and its treatments have complex effects on growth. Second, patients receiving cancer treatment were
assumed to be under close clinical observation and the original motivation of the trial was to catch cases which were diagnosed late because of time pressures on the pediatrician. Of the patient cases that were screened, approximately 70% had enough data and the right
background for us to accept the case. We collected approximately 120 patient records and numbered them consecutively starting at 2000.
3.1.3. Data-Entry
All height, weight, and bone-age data of the child were entered into a spreadsheet.
Recall that only the data available before the date the child was seen at the clinic were used in this trial. The growth clinic usually acquires the information from the referring doctor by calling the referring doctor's office and verbally transcribing the data or by receiving a faxed copy of the patient's growth chart. Therefore we took photocopies of the patient's growth charts and the verbal transcriptions.
Once the information was entered into a spreadsheet, it was transformed into TrenDx-readable LISP code by a series of programs. Here is some example code:
(make-patient 'BOY-PATIENT :id 3 :dob "1/1/80" :name "Fake patient ID# 3")
(add-patient-datum 'height 3 84 :age 2) (add-patient-datum 'weight 3 12.5 :age 2) (add-patient-datum 'height 3 93 :age 3) (add-patient-datum 'weight 3 14.5 :age 3)
The above code creates a male-patient whose date of birth is January 1, 1980 and assigns the patient the id number 3. It then adds 4 data elements to the patient - 2 height and 2 weight data, taken at ages 2 and 3. Data that have the same time-stamp, such as the height and weight pair taken at age 2, are considered a data-cluster and are processed together.
At this stage, approximately 8 of the 120 cases had to be removed from the trial because some portion of the record was unreadable. From the remaining 112 cases, the first 100 were chosen to be included in the trial and distributed. The others were not used.
3.1.4.Packet Creation, Distribution, and Return
Each patient's data were displayed on a growth chart (Appendix B -Packet
Directions and Sample ). The charting process was automated by writing a Hypercard application that automatically plotted the data on either an infant chart (age 0-3) or a childhood chart (age 2-18), or both if appropriate. The test cases were then distributed among the packets in a way to try to equalize the number of test subjects that saw each case, while preventing any two packets from containing the same 10 individual patient cases. However, since packets were not returned frequently, the number of responses per patient case varies significantly.
The human subjects were recruited in several different manners. Many of the subjects were physicians at the Boston Children's Hospital. They were asked to participate and those who agreed were handed packets with return envelopes. Other subjects were found by placing a message on the usenet newsgroup sci.med.informatics asking for participants. This resulted in a wide range of participants, from the United States, Canada, and even a physician from France. There were no criteria for participation in the trial except that the individual had to be a medical doctor or in medical school. One respondent was a registered nurse. She was allowed to participate, but to help interpret results, all
participants were grouped according to the amount of clinical training that they had
received. Overall, over 80 packets, each containing 10 cases, were created and distributed. Of these, 22 packets were completed and returned. The large number of unreturned packets is due to several factors. One participant asked for 30 additional packets to be distributed to interns at the teaching hospital where he worked. Repeated queries were able to effect the return of the individual's packet, but the 30 additional ones were never
returned. Similarly, a total of 14 packets were sent to a medical school where a colleague of Dr. Kohane was attending. Only 1 of those packets came back. Another participant distributed 10 packets to his colleagues, of which only 1 was returned. Of a total of 13 packets distributed to medical students, only 3 made it back.
After the packet distribution had begun, it was discovered that 3 of the 100 cases had typographical mistakes that were not caught earlier. They were removed from the trial, leaving 97 cases. Later, 2 more cases were removed from the trial because their medical
records could not be located to obtain the medical record diagnoses. Thus, the final number of cases used in the trial was 95.
3.1.5.The Task
Each of the participants was told that the cases which they were reviewing came from files from the endocrine clinic at the Boston Children's Hospital. They were also told that the data that they were presented with consisted of all the height, weight, and bone-age data available to the physician at the time that the child was referred. In addition, they were reminded that not all of the patients had growth disorders. They were asked not to discuss the case with others or "study" in preparation for participation, and they were told to spend the same amount of time that they would normally spend if asked in a clinical setting to give an opinion.
Each growth chart presented the data graphically and in tabular form. At the bottom of each chart is a response area in which the subject was asked to do three things (See
Figure 6). First, they had to decide whether to refer the child to the growth clinic. Then they were asked to give a preliminary diagnosis. Finally, if they felt that a referral was warranted, they were asked to choose a time point at which it would have been appropriate
to refer the child, only having seen the patient's data up to that point. For example, if the subject felt that the data suggested that the child had a Short Bone Syndrome, the subject should then choose to refer the child to the clinic and place a check next to the Short Bone Syndrome / Turner's Syndrome / Hypochondroplasia diagnosis. Then, if the subject felt that the child's clinical measurements clearly showed a growth abnormality that should have been noted by the data point at age 6, then he/she would circle the 6 in the tabular listing of the clinical measurements adjacent to the graphical picture of the patient's growth chart.
Sample Human Subject Response
1. Based on the data presented, would you recommend:X Approve referral to endocrine clinic - Deny referral to endocrine clinic 2. Please place a checkmark next to exactly one congenital condition and any number of
acquired conditions that you feel best describe the patient.
Congenital Conditions Acquired Conditions
- Normal Uirowth - Precocious Puberty - Acquired Growth Hormone
- Early Puberty
X
Short Bone Syndrome / Turner's Deficiency- Constitutional Delay Syndrome / Hypochondroplasla - Hypothyroidism Congenital Growth Not Enough Information - Obesity Hormone Deficiency
L3.Please circle the age at which you feel the Datlent should be referred
Figure 6: Sample Human Subject Response
3.2.
Gold-Standard - Medical Record and Experts
There were two gold-standards in this evaluation. The first gold-standard was the
diagnosis written in the medical record of the patient. A second gold-standard was the evaluation of the patient by a pediatric endocrinologist.
The medical record diagnoses for the cases were first obtained from the on-line problem list of the patient. In approximately 75% of the cases, the problem list was empty
so the most recent referral letter was scanned and any diagnoses made by the
endocrinologist who saw the patient were accepted. A referral letter is the letter sent back
history, findings, diagnoses, and other clinical information. Because the on-line problem
list appeared so incomplete, the most recent referral letter was consulted for each and every patient, even if the problem list was not empty. The union of the diagnoses from the
problem list and the referral letter was accepted as the correct diagnoses. There were no
cases where the two sources were incompatible. Some of the patients had no data in the
on-line medical record. In those cases, the physical medical record was used. In the end,
2 of the cases had incomplete medical records and were removed from the trial.
To obtain the answers for the second gold-standard, a pediatric endocrinologist was
given the same sheet that was given to the human subjects. Four endocrinologists each saw one quarter of the approximately 100 cases. The endocrinologist that helped develop TrenDx was not one of the four endocrinologists who provided the gold-standard. In a
similar fashion to the human subjects, the experts were asked to either recommend or deny
a referral to the growth clinic and to circle the appropriate time of referral. However,
instead of choosing one diagnosis, the experts were asked to rank up to three acceptable preliminary diagnoses. Figure 7 shows a sample gold-standard response for a patient.
Sample Gold-Standard Response
1. Based on the data presented, would you recommend:
Approve referral to endocrine clinic - Deny referral to endocrine clinic 2. Please place a checkmark next to exactly one congenital condition and any number of
acquired conditions that you feel best describe the patient.
Congenital Conditions Acquired Conditions
- Normal Growth _ Precocious Puberty _ Acquired Growth Hormone
- Early Puberty 2 Short Bone Syndrome / Turner's Deficiency
-Constitutional Delay Syndrome / Hypochondroplasia Hypothyroidism
1 Congenital Growth Not Enough Information Obesity
Hormone Deficiency
3Please circle the age at whichduou feel the patient should be referred
Figure 7:Sample Gold-Standard Response
While the performance of TrenDx will be compared to both gold-standards, we focused the results on the comparison of all the test-subjects, both TrenDx and human subjects, to the second gold-standard. There were several reasons for this choice.
As discussed in Section 3.4, expert opinion is an accepted gold-standard for trials of medical expert-systems because true gold-standards often do not exist.. This applied to our trial as well. Since some of the patients in our test set were referred for problems that
from only the height, weight, and bone-age data. Instead, we consider these cases
"normal," even though the medical record does not explicitly state that the child is normal. Moreover, the doctor in the growth clinic who saw the patient had much more information available to him or her. This included a complete physical exam as well as the ability to take more measurements and labs. In fact, the medical record diagnosis might not have been made until several visits after the first referral visit. This was too high a standard for
any individual to be held against, especially considering the limited amount of data available. A final reason to use an expert opinion was the poor quality of the information available in the medical record. As noted, the problem lists were incomplete and the referral letters often mentioned the possible presence of other disorders that were never confirmed or denied. One possible reason for the incompleteness of the medical records is that the patient may have moved or changed physicians.
We also compared the gold-standard panel's diagnosis to the medical record diagnosis. The results gave an indication as to whether it is possible to make a diagnosis using only the data that we used, or if the task itself was impossible.
3.3. Performance Measures
A scoring mechanism which uses a numeric score to evaluate the performance of TrenDx and the human subjects is useful to quantitatively express differences in
performance. Numeric scores allow the performance to be quickly summarized as well as grouped over many patients. However, any scoring mechanism has biases and
weaknesses. In addition, (Hayes-Roth, Waterman and Lenat) note that:
Principle 1. Complex objects or processes cannot be evaluated by a single criterion or number.
Principle 2. The larger the number of distinct criteria evaluated or measurements taken, the more information will be available on which to base an overall evaluation.
For these reasons, the performance of TrenDx and the other test subjects were evaluated in several different categories.
3.3.1. Comparison To Medical Record Diagnosis
First, the expert opinions, the diagnosis of TrenDx, and the diagnosis by the human physicians were all compared to the medical record diagnosis. In one analysis, just the decision to refer the child was compared to the clinical outcome of the child. A child with a
familial short stature was considered normal and not worthy of referral. In addition, any patient that was diagnosed with a disorder that would not affect the child's growth, as determined by the expert who helped develop TrenDx, was also categorized as "normal." Then, for all of the abnormal patients, the preliminary diagnosis made by TrenDx and the human subjects was compared to the medical record diagnosis. All of these comparisons were performed for the human subjects as a group, and for the sub-populations divided by the amount of training that they had received.
3.3.2. Comparison to Expert.
Then, the decisions of the test subjects were compared to the second gold-standard set by four pediatric endocrinologists. Again, the decisions that the test subjects needed to make were:
1 -Refer or not to Refer
2 - Make a Preliminary Diagnosis
3 -Choose a Time to Refer.
Clearly, the decision to refer or not to refer was the most important. This is because if the patient did have a growth problem and was referred to a specialist, the specialist should be able to make the correct diagnosis. Giving the decision to refer a value of 5, the preliminary diagnosis a possible value of 3, and the timing of the referral a possible value of 2 gave each case a total possible score of 10.
The possible number of points for the preliminary diagnosis score was 3. Recall that the gold-standard expert ranked up to three preliminary congenital diagnoses, as well as checking off any number of the acquired conditions (See Figure 7). Since the number of acquired conditions that were chosen by the expert varied, the 3 points were divided as follows, depending on whether the expert felt that any acquired conditions were appropriate to note.
* No Acquired Conditions Appropriate: 3 points for choosing the top-ranked
congenital diagnosis as the diagnosis, 2 points for choosing the second-ranked diagnosis, and 1 point for the third.
* One or More Acquired Conditions Appropriate: 1 point for choosing any
of the acquired conditions. 2 points remaining for the congenital conditions: 2 points for the top-ranked congenital diagnosis, 1 point for the second, 0 points for the third.
To make the scoring system more concrete, let's match the sample human subject response in Figure 6 to the gold-standard response in Figure 7. First, note that both the human subject and the gold-standard felt that the patient should be referred. That gives the human subject 5 points out of 5 possible points. For the preliminary diagnosis, the gold-standard ranked 2 congenital disorders, Congenital Growth Hormone Deficiency and the Short Bone Syndrome / Turner's Syndrome / Hypochondroplasia combination. The gold-standard expert also noted that the patient was obese. This causes the scoring possibility to fall into the second of the two scoring categories listed above -"One or More Acquired Conditions Appropriate." The human subject did not note the acquired condition of obesity, and his/her choice of congenital conditions matches the 2nd choice of the gold-standard expert. According to the scoring scheme this scores 1 point out of 3 possible points.
The 2 remaining points, based on the timing of the referral, were also split - 2 points for choosing the referral at the same time as the gold-standard, and 1 point for coming within 1 data point, if it was within 2 years of the correct time. This scoring mechanism allowed subjects to score if the time at which they felt that the referral should have been made was "close enough" to that of the expert. To continue our example, assume that both subjects felt that the referral should have been made at the time that the patient was 6 years old. Thus, the subject scores 2 out of 2 possible points, for a total score of 8 out of 10 for this case. Note that the timing of the referral is not shown on the small portion of the response sheet that we have presented in Figure 6 or Figure 7. It can be seen in on a complete response sheet as shown in Appendix B -Packet Directions and Sample Chart.
As a side-effect of the scoring scheme, the number of possible points became fewer than 10 if the Gold-Standard expert decided that the patient should not be referred, because the 2 points for the timing of the referral could not be scored. In those cases, the referral decision became worth 7 points to keep the total possible points the same for all cases.
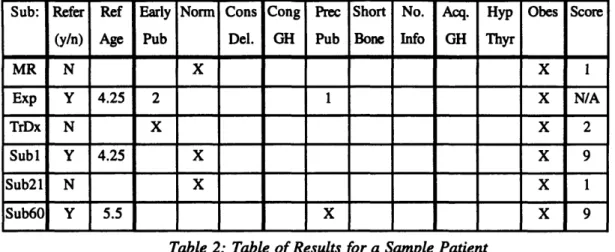
Table of Results for a Sample Patient
Sub: Refer Ref Early Norm Cons Cong Prec Short No. Acq. Hyp Obes Score
(y/n) Age Pub Del. GH Pub Bone Info GH Thyr
MR N X X 1 Exp Y 4.25 2 1 X N/A TrDx N X X 2 Subl Y 4.25 X X 9 Sub21 N X X 1 Sub60 Y 5.5 X X 9
Table 2: Table of Results for a Sample Patient
Table 2 is an example of a table of results for a sample patient. The table lists the
complete set of answers for a patient, including the medical record diagnosis, the opinions of the gold-standard expert, the decisions of TrenDx, and all the responses of the human subjects. The complete set of results is listed in Appendix A -Patient and Subject Result Tables. The columns are:
* Sub: The subject giving the answers.
* Refer (y/n): Whether the subject decides to refer the patient
* Ref Age: If referral was recommended, the age of the child that the referral should have been made
* Early Pub: Early Puberty * Normal: Normal Growth
* Cons Del.: Constitutional Delay of Growth
* Cong GH: Congenital Growth Hormone Deficiency * Prec Pub: Precocious Puberty
* Short Bone: Short Bone Syndrome/Turner's Syndrome * No. Info: Not enough information
* Acq. GH: Acquired Growth Hormone Deficiency * Hyp Thyr: Hypothyroidism
* Obes: Obesity
* Score 1: Score relative to answers provided by Gold-Standard Expert. Within the Sub column, the rows are:
* MR: Medical Record Gold-Standard * Exp: Gold-Standard Expert
* TrDx: TrenDx answers
* Sub##: Human Subject number ## answers
To illustrate the scoring mechanism again, the score for TrenDx is calculated as follows. The decision to refer is Exp- Y, TrDx- N, so TrenDx scores 0 points for the decision not to refer the child. That automatically prevents TrenDx from scoring in regards to the timing of the referral, since TrenDx did not refer the child. In the area of the
preliminary diagnosis, TrenDx gets 1 point for choosing the acquired condition of Obesity and 1 point for choosing the second-ranked condition of Early Puberty. Thus TrenDx scores 2 points in comparison to the Gold-Standard Expert.
3.3.3. Multiple Comparisons
In the evaluation of four diagnostic decision-support systems, Berner uses several measures of performance based on a consensus of the programs being tested (Berner et al.). We made similar measurements by noting the number of cases with more than one participant review and in which all participant referral decisions were in agreement. Out of these cases, we looked at several statistics such as the number of cases in which both gold-standards agreed and the number of cases in which any group made a singular decision (e.g. chose to refer while all other groups chose not to).
3.4.
Comparison to Other Evaluations
Since evaluations are an integral part of the development of decision-support systems, or expert-systems, many different types of evaluations have been
performed(Berner et al.; Feldman and Barnett; Heckerman and Nathwani; Miller, Pople and Myers). Most of these evaluations attempt to measure the performance of the system on some number of cases. Forsythe argues that performance should not be the only aspect of a system that is measured(Forsythe and Buchanan). This is especially true of field trials of systems that are very advanced along the development cycle.
In evaluations of expert systems, several ways of obtaining a gold-standard or evaluating the answers produced by the system have been devised. The gold-standard is usually either the "real" answer, such as the correct diagnosis as confirmed by laboratory studies, or the opinion of one or more experts in the domain. In some cases, the expert that helped develop the system is also involved in the evaluation (Heckerman and Nathwani) introducing bias into the evaluation. Often, the system is the only thing being tested and its answers are evaluated by an expert and given either a subjective rating or a quantitative rating. Sometimes both the system and other physicians, who are not considered experts in the particular domain, are both evaluated and their performance is compared.
Several systems which try to cover a wide domain, such as the entire field of internal medicine, try to produce a ranked differential diagnosis list (Bankowitz, Lave and McNeil; Feldman and Barnett; Miller, Pople and Myers). In these cases, evaluation is more complicated because the goal of the program may not be to just suggest the most likely
answer, but to also stimulate the user by suggesting rare conditions. In these cases, more complex measures are devised to represent favorable and unfavorable traits. These generally involve counting disagreements and agreements between all of the participants. Specifically, not suggesting a diagnosis that every other participant suggested and being the only participant to suggest a particular diagnosis are two unfavorable characteristics.
In terms of the patient cases, our evaluation of TrenDx differs from many other evaluations because most of our patients are normal. Again, the cases were chosen serially with some screening criteria and then "cleaned" by collecting all the measurement data and by removing patients whose medical record contained unreadable measurements or had similar problems. While this introduces bias into the evaluation by limiting the scope of the trial, it also simplifies the evaluation by making it easy to categorize patients and avoid problems with missing data or cases in which the child somehow loses 10 centimeters in height between one visit and the next. As noted before, these cases were simply removed from the trial. In a field trial of the program, TrenDx would have to be programmed to deal with poor data.