HAL Id: halshs-00112423
https://halshs.archives-ouvertes.fr/halshs-00112423
Submitted on 8 Nov 2006
HAL is a multi-disciplinary open access
archive for the deposit and dissemination of
sci-entific research documents, whether they are
pub-lished or not. The documents may come from
teaching and research institutions in France or
L’archive ouverte pluridisciplinaire HAL, est
destinée au dépôt et à la diffusion de documents
scientifiques de niveau recherche, publiés ou non,
émanant des établissements d’enseignement et de
recherche français ou étrangers, des laboratoires
Untalented but Successful
Olivier Gergaud, Vincenzo Verardi
To cite this version:
Maison des Sciences Économiques, 106-112 boulevard de L'Hôpital, 75647 Paris Cedex 13
Centre d’Economie de la Sorbonne
UMR 8174
Untalented but Successful
Olivier G
ERGAUDVincenzo V
ERARDIUntalented but Successful
Olivier Gergaud
yand Vincenzo Verardi
zFebruary 28, 2006
Keywords:Superstars, Robust Estimation, Hedonic Prices, Leisure Games JEL Classi…cation:C4, D4, Z19
Mots-clés: Superstars, Estimation Robuste, Prix Hédonistes, Jeux de Loisirs Classement JEL:C4, D4, Z19
We would like to thank all our colleagues at ECARES and OMI who helped us in the process of this work and in particular, Françoise Benhamou, Victor Ginsburgh, Marjorie Gassner, Catherine Dehon, Natalie Chen for helpful suggestions.
yCorresponding author: OMI, Université de Reims Champagne-Ardenne and TEAM,
Uni-versité de Paris I. Address: 57 bis, rue Pierre Taittinger, 51096 Reims Cedex, France. Tel.: + 33 (0) 3.26.91.38.56, Fax: + 33 (0) 3.26.91.38.69, E-mail : [email protected].
Abstract
When studying the problem of the emergence of superstars, scholars face great di¢ culties in measuring talent, obtaining con…dential data on earnings, and …nding econometric techniques that lead to results that are robust to the presence of outliers (superstars). In this paper we use an original dataset from the Pokemon trading card game in which (i) there is no unidenti…able heterogeneity, and (ii) all characteristics of individuals are public domain. To prevent the results to be distorted by the presence of outliers, we estimate the “fair” price of each individual, using the robust “Least Trimmed of Squares”regression technique in a hedonic prices framework, and check the e¤ective price at which they are sold. This allows to identify superstars, i.e. individuals that are sold at a price which represents several times their intrinsic value. We …nd that the two main theories of superstars developed by Rosen (1981), who awards a central importance to talent, and by Adler (1985), who awards more importance to the need of consumers to share a common culture, are complementary and not mutually exclusive as is often claimed.
Résumé
En étudiant la question de l’émergence des superstars, les chercheurs sont confron-tés à de grandes di¢ culconfron-tés pour mesurer le talent, obtenir des données con…dentielles sur les rémunérations et trouver des techniques économétriques produisant des ré-sultats robustes à la présence de valeurs aberrantes (superstars). Dans cet article, nous utilisons un ensemble de données originales provenant des cartes Pokémon avec lesquelles (i) il n’y a pas d’hétérogénéité non identi…able, et (ii) toutes les caractéris-tiques des individus sont dans le domaine public. Pour éviter que les résultats ne soient altérés par la présence de valeurs aberrantes, nous estimons le « juste prix » de chaque individu, en utilisant la technique de régression robuste « Least-Trimmed of Squares » dans le cadre d’une fonction de prix hédonistes et en véri…ant le prix e¤ec-tif auquel ceux-ci sont vendus. Cette méthode permet d’identi…er un certain nombre de superstars, i.e. des individus vendus à des prix représentant plusieurs fois leur valeur intrinsèque. Nous trouvons que les deux théories des superstars développées par Rosen (1981), qui attribue un rôle central au talent, et par Alder (1985), qui con-fère plus d’importance au besoin qu’ont les consommateurs de partager une culture commune, sont complémentaires et non mutuellement exclusives contrairement à ce qui est souvent avancé.
1
Introduction
Success stories are commonly believed to be related to talent. Starting from this idea, Rosen (1981) developed an elegant theoretical model showing how “small di¤erences in talent become magni…ed in large earnings di¤erences, with greater magni…cation of the earnings-talent gradient increasing sharply near the top of the scale”(p.846). Adler (1985) proposed a re…nement of this theory suggesting that superstars may even emerge among equally-talented individuals, whatever the level of talent they possess (or, implicitly, anywhere on the earnings-talent scale). He explains this by the consumers’need to share a common culture.
A recurrent question in the “superstars” literature, is to …nd out which of Rosen’s or Adler’s theories prevails. Empirical …ndings mostly point in Adler’s direction but cannot lead to the rejection of Rosen’s hypothesis, since measuring objectively talent is particularly tricky in Arts and Sports (see Adler, 2005) and it is thus often proxied imperfectly. Hamlen (1991, 1994) for instance, studying the music industry, …nds that talent, proxied by voice quality, improves record sales with rewards for talent that are far less than proportional to di¤erences in talent. But can the voice quality be considered as a real proxy for talent? Studying the same industry, Chung and Cox (1994) …nd that the superstardom phenomenon is mainly the result of a probability mechanism which predicts that “artistic outputs will be concentrated among a few lucky individuals” (p.771) but do these few lucky individuals have really the same level of talent of the unsuccessful artists?
either measures of success, that do not necessary re‡ect talent (e.g. the number of goals scored in football, see Lucifora and Simmons, 2003), or measures that do not allow to distinguish between talent and rarity (e.g. minor paintings from icon painters). Furthermore, earnings are only imperfectly quanti…ed since, as argued by Rosen (1981), privacy and con…dentiality make data collecting (especially on earnings) very problematic.
As a result, theories of superstardom can only be explicitly tested using data for which talent is explicitly provided, which allow to control for all of the existing heterogeneity (including rarity) between individuals and for which earnings are public domain knowledge. In this paper, we address this question by using some new data, on the Pokemon Trading Card Game (Pokemon TCG hereafter)1. The latter dataset presents several advantages: …rst, talent is fully
observable, totally objective and explicitly provided in the cards. Second, the supply of cards is exogenously controlled by a single …rm (Wizard of the Coast) that provides objective rarity indicators2. Third, the price of the cards represents both an adequate measure of success3 and a good proxy for consumers’prefer-ences (since supply is exogenous). Fourth, consumers are essentially teenagers, and this increases the probability of emergence of superstars, given the enthusi-asm which characterizes that particular age group. Finally, Pokemons, and more generally collectible trading cards, are particularly well adapted to analyze the 1This is not the …rst time that economists have used collectible trading cards in their
applications (see Lucking-Reiley, 1999).
2It is then possible to separate the e¤ect of rarity from the e¤ect of talent. 3It is equivalent to the earning of the card.
emergence of idols, given their huge commercial success.
Indeed, Pokemons can be found everywhere: on schoolbags, tee-shirts, in cartoons, movies and magazines, on cuddly toys, electronic games, websites, and so on. Pr. Oak, the leading authority on these monsters, goes as far as saying that “Pokemons are incredible creatures that share the World with humans”. Their “leader”, Pikachu, has even served as an inspiration to the French sculptor Philippe Berry, together with Michelangelo’s David and the android from Fritz Lang’s Metropolis, for his sculpture called “Little Pikachu”.4
In this paper, we try to evaluate to what extent talent and pure fashion (or the need for a common consumption or culture) explain the huge commercial success of some of the pokemons5. This is done by …rst estimating a hedonic
price equation for the Pokemon TCG and then by thoroughly analyzing the robust residuals calculated by Least Trimmed of Squares (LTS). The use of LTS guarantees that the residuals are calculated on a regression line that has not rotated due to the attraction of outlying observations. The hedonic price equation is estimated for three time periods (November 2000, June 2001 and October 2005) to check how the phenomenon has evolved over time.
The results show that: (i) Adler’s intuition that “there should be stars among individuals known to have equal talents”, (Adler, 1985 p. 208), is valid, (ii) Rosen’s intuition that “small di¤erences in talent are magni…ed in larger earn-ings [here prices] di¤erences” is valid but not su¢ cient to explain alone the emergence of all superstars. Finally, this application suggests that both
col-4See http://www.philippe-berry.com/pages-sculpture/sculpture_55.html
lectible card games and robust statistical methods o¤er promising perspectives for further tests of superstardom theories.
The paper is organized as follows: section 2 presents the game and section 3 details the data. Section 4 lays down the empirical strategy, while section 5 presents the results. Finally, section 6 concludes.
2
The Rules of the Game
In this section, we brie‡y present the fundamentals of the very sophisticated rules of the Pokemon Trading Card Game. More complete explanations are available in reference sites dedicated to pocket monsters such as pojo.com. Un-derstanding the rules is not indispensable to fully understand the remainder of the paper but having at least a super…cial idea of how it works is helpful.
2.1
The object of the game
The Pokemon TCG is played as follows: two opponents (de…ned as pokemon trainers) start with a deck of 60 cards each6 and …ght to determine who is the best “monsters” trainer.
Each player has a so-called "Active pokemon" drawn from a start-o¤ hand of 7 cards taken randomly from his deck. The objective of both players is to knock out the opponent’s active monster while keeping his active pokemon in play. A pokemon is declared to have been knocked out as soon as the total damage it
has received from the opponent’s active pokemon becomes equal to its number of hit points which is printed on the card (see below). Players play alternatively launching an attack at each turn. When launching an attack, a player has to take from his deck the energy cards needed to launch that speci…c attack (see below) and discard them at the end of the turn. He can also increase the power of the pokemon (only for that speci…c attack) using a trainer card (see below). Before the game starts, each player randomly draws six prize cards and sets them aside without unmasking them. Each time a player knocks out one of the opponent’s pokemons, he selects (randomly) one of its own prizes (not the opponent’s) and put it into his hand. The …rst player who manages …rst to take its 6 prizes wins the game.
2.2
Type of cards
In the game, there are three types of cards: Pokemon cards, energy cards and trainer’s cards. Pokemon cards can be of three types: basic, evolution one and evolution two. Evolution cards are nothing else than basic cards that have evolved to become stronger. So, for each pokemon card, say x, there will be a pokemon card called "x evolution one" and another called "x evolution two". Evolution cards can only be played together with the basic card. Energy cards provide the speci…c amount of energy Pokemons need to implement their attacks. There are seven di¤erent types of energy cards: Grass, Lightning, Colorless, Fire, Psychic, Darkness, Water, Fighting and Metal. The type and the number of energy cards needed for launching a speci…c attack are de…ned
on the pokemon card. Finally a trainer card, that increases the power of the pokemon, has a one shot e¤ect (which speci…ed on it); this implies that the card must be sent to the discard pile once it has been played.
3
The Data
In 2000, there were more than 400 pokemon cards and 250 documented species.7
Each creature has its own special …ghting abilities or characteristics. Creatures come in di¤erent shapes (mouse, rat, virtual, magnet, pig monkey, etc.) and sizes. Some Pokemon characters, such as Pikachu, are cute, while others, like Alakazam, are terrifying. In addition, each card has a speci…c rarity which is exogenously determined by “Wizard of the Coast”. Cards are commercialized in decks but, since these decks are not complete and some cards are very rarely8
included, most cards are also available on the second hand market either via the Internet or through specialized games shops.
We collected data including prices and objective characteristics of 442 Poke-mon cards, sold on the second-hand market in the United States. Three distinct periods are considered: November 2000, July 2001 and October 2005. The two former periods correspond to a boom of the Pokemon TCG. Our main source of information is www.pojo.com, the most popular Pokemon price guide on the Internet.9 Note that this up-to-date website, mainly visited by teenagers and
7And much more nowadays. 8Or even never.
9Pojo.com was launched in 1998 and is still active today. It has continuously been ranked
young adults, does not sell cards. It merely provides prices that game stores are expected to charge.
Pokemons’ characteristics are either due to the creature’s speci…cities (de-tailed in section 3.1), to its setting (de(de-tailed in section 3.2) or to the supply characteristics of the card (detailed in section 3.3). The way in which these characteristics have been codi…ed to be used on the right hand side of the esti-mated equation is described in the following three subsections.
3.1
The Creature’s Characteristics
There are two di¤erent types of Pokemon cards: basic cards and evolution cards. The latter are played on top of the basic Pokemon to make it more powerful. When one Pokemon attacks another, it will cause damage that is calculated in terms of hit points. Additionally, some cards can launch sophisticated attacks, i.e. attacks producing speci…c damage which are expressed in terms of other characteristics than hit points.10 In addition, each Pokemon is characterized by
a particular element. A Pokemon can either be lightning, …ghting, …re, grass, psychic, water or colorless. Some creatures have weaknesses with respect to other types of Pokemons. For example, …ghting is weak with respect to psychic and, quite logically, …re is weak with respect to water, etc. In such cases, damage is doubled. Conversely, a creature with a resistance to a speci…c type of
also specify that pojo.com is not sponsored, endorsed, or otherwise a¢ liated with any of the companies or products featured in it.
1 0E.g. a pokemon that su¤ered a sophisticated attack will not be able to in‡ict the same
Pokemon su¤ers less damage from its attacks. Finally, some Pokemons have a speci…c power. With the exception of damage and hit points that are variables ranging respectively from 0 to 120 and from 30 to 120, all other are dummy variables which take the value 1 if the card possesses a speci…c characteristic and 0 otherwise. Finally the level of the card (i.e. its aggregate quality or talent) is presented through a linear index ranging from 5 to 76, where 76 is the most powerful pokemon. Given the extreme collinearity which exist between the level11, the number of hit points and the damage, only the …rst variable, that is an aggregate indicator of talent, will be considered in the regressions.
3.2
The Setting
Each Pokemon card is a member of a set (also called expansion). Six expansions were registered at the beginning of 2001. They have been published in the following order: 1. Basic, 2. Jungle, 3. Fossil, 4. Team Rocket, 5. Gym Heroes, 6. Gym Challenge. Each expansion is characterized by a simple dummy variable which takes the value 1 if the Pokemon is a member of the expansion, and 0 otherwise.
3.3
Rarity and Supply Characteristics
In the Pokemon TCG, the “o¢ cial” goal is to collect all of the cards. But not all of them are easy to …nd. Pokemon cards are characterized by a rarity index. The index used in this application to take into account rarity is a categorical
variable(displayed on the cards) has four levels of rarity, level being 1 being the rarest.
For the purpose of our study, we also control for the fact that Pokemon cards are not all commercialized with the same intensity by the monopoly holder Wizard of the Coast. This is done by inserting the number of times a card was included in the decks. Two-third of the cards (65%) were not included in any deck, one-third (32%) was available between 1 and 4 times in these decks and 3% more than 4 times.
Finally, we use the number of variants (one to six) a card possesses. For example, there exist 4 cards for Pikachu (Basic, Jungle, Gym Heroes and Gym Challenge), 2 cards for Squirtle and only 1 card for Chansey. These variants explain why we have more cards (442) than Pokemons (152).
4
The Empirical Strategy
To analyze the Superstardom phenomenon underlying the Pokemon TCG, we need to control for potential quality di¤erences between cards. This is done by estimating a hedonic price function for Pokemon cards. In the …rst sub-section below, we brie‡y explain why the Rosen (1974) hedonic price method is particularly well-suited for this case (i.e. when quality can be summarized by a vector of characteristics and is fully objective). The second subsection is devoted to the presentation of the econometric technique used, more precisely motivating why a robust-to-outliers regression should be estimated. We also
detail the methodology used to identify outliers (superstars and superlosers) from the hedonic residuals. Finally, the third subsection sets up the notion of fair price or success on which our analysis of superstardom is based.
4.1
The Hedonic Price Method
The Rosen (1974) hedonic price method is commonly used to model price for-mation when products are vertically di¤erentiated. Among other restrictive as-sumptions, this model assumes that characteristics are objectively measured12
and that all between-individual heterogeneity is modeled. Furthermore, as in-dicated by Rosen (1974) and reasserted later by Nerlove (1995), hedonic prices are determined by both the distribution of consumer tastes and of producer costs. Therefore, with the exception of a few speci…c cases like this one, where the supply is exogenously determined or when consumers face exogenous prices (for instance the Swedish wine market case analyzed by Nerlove, 1995), implicit prices are di¢ cult to interpret and do not exclusively re‡ect consumers prefer-ences. Given the speci…cities of our data described before, we understand that this method is particularly well suited here.
4.2
The Econometric Model
The econometric model is a linear multiple regression where the dependent variable is the (log) of the price and the explanatory variables are, on the one 1 2The characteristics are ob jective, but consumers may di¤er in their sub jective valuations
hand, the vectors of characteristics listed above (i.e. creatures’ characteristics Zi, cards’setting SETi, supply conditions SU Pi and rarity RARi) and on the
other hand the level of the card LEV ELi. The relation that we estimate is of
the type:
Log (pi) = 0+ 1Zi+ 2SETi+ 3SU Pi+ 4RARi+ 5LEV ELi+ 6LEV EL2i+"i
(1)
where 1; 2; 3; 4; 5 and 6 are (vectors of) coe¢ cients to be estimated
and "i, the error term. LEV EL2i is introduced in the regression to test for the
convexity of the function that translates quality into income as predicted by Rosen. In our speci…cation, this means that we should end up with a positive sign for 6. To test Rosen’s theory, we obviously also need an increasing gradient
of the slope of the curve when reaching high levels of talent. This will be tested by analyzing residuals as explained later in the text.
The estimated residuals in a regression are generally di¢ cult to interpret since they contain too much information due to the unobserved heterogeneity between individuals. In our framework, this will not be the case: since we have objective information on all the characteristics for each individual of the sample, the error term will not contain any unobserved heterogeneity. Furthermore, if there is no superstar e¤ect, all residuals should lie in a narrow con…dence band around the regression hyperplane. Otherwise, superstars (superlosers) should be associated with very large and positive (negative) residuals. This means that,
given their characteristics, they are sold at an “unfair” price. Superstars can thus be easily identi…ed.
The major drawback here is that if outliers (superstars or superlosers) exist, OLS will not yield robust results. Indeed, the OLS regression line will be attracted by abnormal points and the residuals will su¤er from swamping and masking e¤ects. Stated brie‡y, the idea of a swamping e¤ect is that if the regression line rotates due to the attraction of some outliers,13 other points
that follow a standard behavior given their proximity to the regression line associated with the bulk of the data, will appear as outliers. Similarly, other points that should be considered as outliers given their excessive distance from the regression line associated with the bulk of the data, might appear as standard points, leading to a masking e¤ect.
To solve the problem, the residuals should be estimated with respect to a robust regression line, i.e. a line that is not attracted by abnormal points. In this paper, we decide to rely on the Least Trimmed of Squares (LT S) method14 both for its simple interpretation and its excellent robustness to outliers15. The
1 3In our case, superstars.
1 4We could have used other techniques such as Least Median of Squares, S-estimators or
MM-estimators but, in terms of the identi…cation of outliers they are equivalent to LTS. The advantage of the latter is that it is very similar to OLS and thus intuitively appealing.
1 5In the classical regression framework, various techniques have been proposed to identify
outliers. Among these, the best known are standardized residuals, studentized residuals and Cook distances. Even if these are theoretically appealing, they all su¤er from the fact that they are based on residuals that are estimated on a non-robust regression line (or hyperplane) i.e. a line that is attracted by outliers.
method is described in Appendix 1.
4.3
Superstardom vs. “fair” success
In this subsection we analyze the notion of superstardom with respect to fair price or fair success. By "fair price" we mean a price at which an individual should be sold given his idiosyncrasies and given the preferences of consumers with respect to the characteristics. In this context, the fair price can be com-puted as a linear prediction of the hedonic price coe¢ cients with a robust re-gression …t, ^p: Even if this might seem subjective, we de…ned an individual as being a superstar if it is sold at at least three times its fair price16. Of course,
this allows to identify only extreme superstars. Being less demanding with the de…nition would allow to identify more outliers but would not a¤ect the gen-erality of the results. To calculate the excessive pricing, pipi^ ; (i.e. the ratio of observed prices over estimated fair prices for all individuals, given speci…cation (1)), we need to transform the estimated residuals by pipi^ = exp( r ^2
2 ) where
^2is the estimated LTS scale parameter (see Appendix 2 for further details).
5
The Results
In order to retrieve the estimated elasticities of the hedonic price regression, taking into account the information we have about the proximity of data points with respect to the robust hyperplane, we estimate a weighted regression (WLS) 1 6Similarly an individual is considered as being a superloser if it is sold at less than one
where the weights are de…ned as the inverse of the robust standardized residu-als.17 In such a way, we can estimate the model by OLS but avoiding rotation
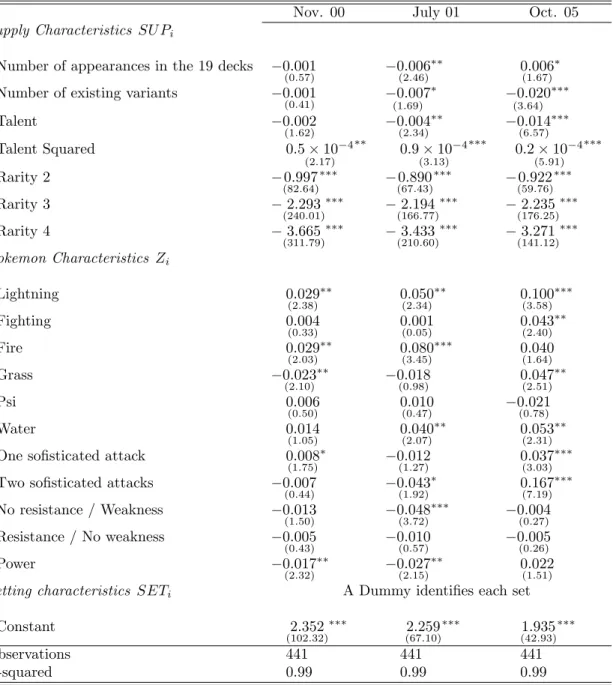
of the hyperplane due to the presence of outliers. The regression results are presented in Appendix 3, Table 1.18
The regression results indicate, as expected, that preferences are mainly based on the talent of the card, on its rarity (RARi) and on the main supply
characteristics (SU Pi).19 The quality of the …ts are quite good with R2 close
to one. The fact that the coe¢ cients corresponding to the number of variants is negative is not so surprising given that the most popular cards are the most printed: there are four di¤erent cards for Pikachu alone, for example.
Interestingly, price is a convex function of talent in all periods. This suggests a superstardom phenomenon à la Rosen, with a convex distribution of earnings with respect to talent. Furthermore, as we will see further on in …gure 1, the most talented individual (Charizard) is highly overpriced (at least during the periods in which pokemons enjoyed a huge commercial success), strenghtening the evidence supporting Rosen’s hypothesis of an increasing gradient of the slope for very talented individuals.
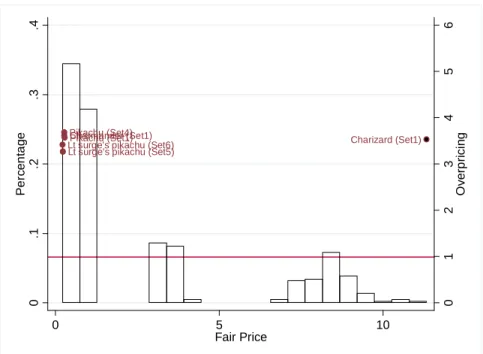
Following Adler, overpricing (or underpricing) may occur at any price level. This can be checked by using some simple graphical tools. The idea is to build a chart in which the horizontal axis represents the fair price at which individuals
1 7I.e. the estimated robust residuals over the estimated robust scale parameter.
1 8For the sake of clarity, we voluntarily dropped from Table 1 the results relating to the
setting of the card (SETi) 1 9Furthermore,
should be sold, given their characteristics and consumers’preferences, and the two vertical axes respectively represent the frequency (left hand side) and the overpricing of individuals (right-hand side). A horizontal line is drawn at the overpricing level of 1 (through the left vertical axis) indicating the level at which a card sells at its fair price. Superstars (superlosers) will be far above (below) this line and; if Adler is right, this should occur at any fair price level rather than exclusively at high fair price levels as suggested by Rosen.
During the …rst period, presented in Figure 1, it is clearee that Adler’s hypothesis is con…rmed. There are superstars among individuals with fair prices of around $1 and around $13. In particular, the biggest idol, Pikachu, whose fair price is 1$, is sold at approximately six times its fair price. There is a comparable e¤ect for Charmander, which is not that surprising. Indeed, both creatures are superstars in the pokemon movie.20 The marketing strategy of
the …rm seems to clearly involve two di¤erent steps here: the …rst step consists in promoting some creatures in the movie; the second is to transform them into bad, but a¤ordable, cards in the TCG. This strategy is aimed at inciting teenagers to …rst buy …rst some cheap, movie-popular cards to begin a collection and then buy more and more cards once addicted.
[Insert Figure 1 Here]
During the second period, presented in Figure 2, a similar phenomenon 2 0Charmander may be seen as a good substitute for those who cannot a¤ord a very expensive
occurs: superstars are not exclusively found on the right hand side of the graph as suggested by Rosen. The graph also shows the way in which the inventors of the game arti…cially maintain the Pikachu phenomenon by launching new variants of the card such as Lieutenant Surge’s Pikachu. This enables Pikachu to remain at the top of the ladder, while the original card is no longer a best-seller.
[Insert Figure 2 Here]
Finally, as can be seen in Figure 3, in the third period we observe an overall decline in the superstardom phenomenon. No superstars remain and one super-loser appears. This result suggests that, as time goes by, consumers accumulate experience and tend to diversify their consumption by adopting new idols. This result is in line with Alder’s prediction (1985, p. 210) according to which, at low levels of consumption, consumers prefer to specialize (this stage is charac-terized by concave indi¤erence curves) whereas at high-levels of consumption, they prefer to diversify (this stage corresponds to convex indi¤erence curves).
[Insert Figure 3 Here]
6
Conclusion
Adler (2005) asked the following question “Is stardom the reward for superior talent or does stardom arise because consumers need a common culture?”. Ac-cording to him, the “Economics of Superstars” is still rife with open questions.
Indeed, empirical …ndings point in several directions. If some results are con-sistent with Rosen’s “reward for talent” explanation, others instead cast doubt on it and support Adler’s theory (Schulze, 2003; Lucifora and Simmons, 2003; Blass, 1992; Chung and Cox, 1994 and Hamlen, 1991, 1994).
This paper …rst shows that Rosen’s hypothesis is con…rmed by the data but also that it is possible to be untalented and successful : anybody may become one day a superstar, whatever his talent level. Adler’s theory therefore seems to be a complement to Rosen’s.
Chung and Cox (1994) showed that initial advantages may induce the emer-gence of idols. In the case of pokemon TCG, the advantage was voluntarily created by the inventor of the game by advertising some creatures21 more
fre-quently than others. Some “good looking” Pokemons like Pikachu have been much more intensively advertised than others, as can be particularly seen by derivative products.
This paper innovates in several ways: …rst, by using original data to test for the two competing theories of superstars, it o¤ers new perspectives for a bet-ter understanding of the superstardom phenomenon. Indeed, collectible cards are particularly well-suited by o¤ering good, easily available measures of rarity, talent and success. Second, the two main theories of superstars developed by Rosen (1981), who awards a central importance to talent, and by Adler (1985), 2 1”If you’re mostly interested in playing, there are always good cards appearing in all levels
of commonality. Many of the most popular Pokemons such as Pikachu, Charmander, Squirtle, and Bulbasaur-are common cards. This ensures that players who buy di¤erent amounts of cards can still play and have a fun and fair game.”, Extract from the Pokemon TCG rules.
who gives more importance to the need of consumers to share a common cul-ture, are complementary. Third, this paper proposes an original methodology, which is particularly well adapted to this kind of data, and enables to estimate hedonic pricing models using robust regression procedures. Superstars are in-deed identi…ed from the (estimated) overpricing of individuals with respect to their fair price, given their characteristics.
References
[1] Adler, M. (1985), “Stardom and talent”, American Economic Review, 75: 208-211.
[2] Adler, M. (2005), “Stardom and talent”, forthcoming in: D. Throsby and V.A. Ginsburgh, eds., Handbook of the Economics of Art and Culture. [3] Blass, A.A. (1992), “Does the baseball labor market contradict the human
capital model of investment?”, Review of Economics and Statistics, 7: 261-268.
[4] Chung, K. and R. Cox (1994), “A stochastic model of superstardom: an application of the Yule distribution”, Review of Economics and Statistics, 76: 771-775.
[5] Hamlen, W. (1991), “Superstardom in popular music: empirical evidence”, Review of Economics and Statistics, 73: 729-733.
[6] Hamlen, W. (1994), “Variety and superstardom in popular music”, Eco-nomic Inquiry, 32: 395-406.
[7] Lucifora C. and R. Simmons (2003), “Superstar e¤ect in sport: Evidence from Italian Soccer”, Journal of Sports Economics, 4: 35-55.
[8] Lucking-Reiley, D. (1999), “Using Field Experiments to Test Equivalence Between Auction Formats: Magic on the Internet.”, American Economic Review, 89(5): 1063-1080.
[9] Nerlove, M. (1995), “Hedonic price functions and the measurement of pref-erences: the case of Swedish wine consumers”, European Economic Review, 39: 1697-1716.
[10] Rosen, S. (1974), “Hedonic prices and implicit markets: product di¤eren-tiation in pure competition”, Journal of Political Economy, 82 (1): 34-55. [11] Rosen, S. (1981), “The economics of superstars”, American Economic
Re-view, 71: 845-858.
[12] Rousseeuw, P. J. (1984). “Least median of squares regression. Journal of the American Statistical Association 79, 871–880.
[13] Schulze, G.G. (2003), “Superstars”, in: R. Towse, ed., Handbook of Cultural Economics (Edward Elgar, Cheltenham): 431-436.
7
Appendix
7.1
Appendix 1: The LTS Regression
In the classical regression framework, various techniques have been proposed to identify outliers. Among these, the most common are standardized residuals, studentized residuals and Cook distances. Even if these are theoretically ap-pealing, they all su¤er from being based on residuals that are estimated from a non-robust regression line (or hyperplane), i.e. a line that has been attracted by outliers. All distances calculated with respect to this line will then be biased causing both masking and a swamping problems. To avoid this, the only solu-tion is to rely on distances calculated with respect to a line that …ts the majority of the points and is not excessively attracted by outliers. In this paper we use the very robust Least Trimmed of Squares (LT S) method that we describe more in detail below. Assume we want to estimate a regression model of the type
yi = 0+ xi1 1+ ::: + xip 1 p 1+ "i for i = 1; :::; n (2)
where n is the sample size, xi1; :::; xip 1 are the explanatory variables, yi the
dependent variable and "ithe error term. We assume that errors "iare
indepen-dent of the explanatory variables and i:i:d: N (0; ), where is the residual scale parameter. The vector of regression parameters is = [ 0; :::; p 1]0. To
esti-mate it, the classical ordinary least squares methodology is the most commonly used; it minimizes the sum of squared residuals. More precisely:
^ LS= arg min ^ n X i=1 r2i where ri= yi ^0 xi1^1 ::: xip 1^p 1 (3)
OLS estimators are known for their sensitivity to outliers. Results can be strongly in‡uenced by the presence of just one “bad”outlier. Several “robust to outliers” regression techniques have been proposed in the literature. One is the Least Trimmed of Squares proposed by Rousseeuw (1984). The least trimmed of squares (LT S) is equivalent to ordering the residuals from a classical ordinary least squares …t, trimming the observations that correspond to the (1 h)% largest residuals, and then computing a least squares regression model for the remaining observations. More precisely:
^LT S = arg min ^ h X i=1 r2i where ri= yi ^0 xi1^1 ::: xip 1^p 1 (4)
r2(1) r(2)2 ::: r(n)2 are the ordered squared residuals and h is de…ned in the range n2 + 1 h 3n+p+14 (in this paper we use h = n+p+12 ( 50% of trimming) to guarantee extreme robustness to outliers). LT S is very similar to OLS, the only di¤erence being that the largest squared residuals are not used in the summation, thereby allowing the …t to be independent of the outliers. It should be noted that the LT S method does not “discard” 50 percent of the data. Instead, it …nds a majority …t, which can then be used to detect the actual outliers. This is generally done by …nding the excessively large standard-ized residuals (measured as the residual divided by the LT S scale parameter
estimate i.e. ri^). The scale parameter needed for the standardization has to be estimated on the basis of the trimmed residuals using the following formula: ^ = C s 1 n h P i=1 r2
i where C is a factor used to achieve consistency of Gaussian
error distributions.
7.2
Appendix 2: Estimation of Fair Prices in a Semi-Log
Model
A non-negative continuous random variable p is said to have a lognormal dis-tribution with mean E(p) and variance V ar(p)22 if the random variable log(p)
has a normal distribution with mean E(log(p)) and variance V ar(log(p)).23
The mean of the random variable p is then E(p) = exp(E(log (p))+V ar(log(p))2 ). E(p), E(log (p)) and V ar(log (p)) are not known but can be estimated (in the sample) by: ^p,log(p) and V ar( dd log(p)) respectively. Of course the latter is nothing else than the squared scale parameter. We then have that
^
p = exp( dlog(p) + ^2 2)
log(^p) = dlog(p) + ^22 ) dlog(p) = log(^p) ^22 since residuals are de…ned as:
r = dlog(p) log(p), we have
r = log(^p) ^22 log(p) or 2 2i.e. p log N (E(p); V ar(p))
log(p) log(^p) = ^22 r thus log(pp^) = r ^22 and p ^ p = exp( r ^2 2)
Of course, residuals and the scale parameter are robustly estimated by LTS. In practice, to identify superstars, we will look for individuals who are sold at least three times their fair price, i.e. individuals that are such that exp( r
^2
2) 3 where r is the robust residual and ^ 2
is the squared robust LTS scale parameter. Similarly, individuals who are sold at most one third of their fair price, i.e. exp( r ^22) 13 are considered as superlosers.
7.3
Appendix 3: The Hedonic Price Equation
Table 1: WLS results for the Hedonic Price Equation (weights: LTS robust residuals) Nov. 00 July 01 Oct. 05 Supply Characteristics SU Pi
Number of appearances in the 19 decks 0:001
(0:57) 0:006(2:46) 0:006(1:67)
Number of existing variants 0:001
(0:41) (1:69)0:007 0:020 (3:64) Talent 0:002 (1:62) 0:004(2:34) 0:014(6:57) Talent Squared 0:5 10 4 (2:17) 0:9 10 4 (3:13) 0:2 10 4 (5:91) Rarity 2 0:997 (82:64) (67:43)0:890 (59:76)0:922 Rarity 3 2:293 (240:01) (166:77)2:194 (176:25)2:235 Rarity 4 3:665 (311:79) (210:60)3:433 (141:12)3:271 Pokemon Characteristics Zi Lightning 0:029 (2:38) 0:050(2:34) 0:100(3:58) Fighting 0:004 (0:33) 0:001(0:05) 0:043(2:40) Fire 0:029 (2:03) 0:080(3:45) 0:040(1:64) Grass 0:023 (2:10) 0:018(0:98) 0:047(2:51) Psi 0:006 (0:50) 0:010(0:47) 0:021(0:78) Water 0:014 (1:05) 0:040(2:07) 0:053(2:31)
One so…sticated attack 0:008
(1:75) 0:012(1:27) 0:037(3:03)
Two so…sticated attacks 0:007
(0:44) 0:043(1:92) 0:167(7:19) No resistance / Weakness 0:013 (1:50) 0:048(3:72) 0:004(0:27) Resistance / No weakness 0:005 (0:43) 0:010(0:57) 0:005(0:26) Power 0:017 (2:32) 0:027(2:15) 0:022(1:51)
Setting characteristics SETi A Dummy identi…es each set
Constant 2:352
(102:32) (67:10)2:259 (42:93)1:935
Observations 441 441 441
R-squared 0:99 0:99 0:99
Absolute value of t statistics in parentheses
Charmander (Set1)
Lt surge's pikachu (Set5) Pikachu (Set1) Pikachu (Set4) Charizard (Set1) 0 1 2 3 4 5 6 Ov e rpr ic in g 0 .1 .2 .3 .4 P erc e nt ag e 0 5 10 15 Fair Price Figure 1: November 2000
Charizard (Set1) Charmander (Set1)
Lt surge's pikachu (Set5) Pikachu (Set1) Pikachu (Set4) Lt surge's pikachu (Set6)
0 1 2 3 4 5 6 Ov e rpr ic in g 0 .1 .2 .3 .4 P erc e nt ag e 0 5 10 Fair Price Figure 2: June 2001
Clefairy (Set1) 0 1 2 3 4 5 6 Ov e rpr ic in g 0 .1 .2 .3 .4 .5 P erc e nt ag e 0 2 4 6 8 10 Fair Price Figure 3: October 2005