HAL Id: hal-01868726
https://hal.archives-ouvertes.fr/hal-01868726
Submitted on 5 Sep 2018
HAL is a multi-disciplinary open access
archive for the deposit and dissemination of
sci-entific research documents, whether they are
pub-lished or not. The documents may come from
teaching and research institutions in France or
abroad, or from public or private research centers.
L’archive ouverte pluridisciplinaire HAL, est
destinée au dépôt et à la diffusion de documents
scientifiques de niveau recherche, publiés ou non,
émanant des établissements d’enseignement et de
recherche français ou étrangers, des laboratoires
publics ou privés.
Classification of the fibronectin variants with curvelets
Anca-Ioana Grapa, Raphael Meunier, Laure Blanc-Féraud, Georgios
Efthymiou, Sébastien Schaub, Agata Radwanska, Ellen van
Obberghen-Schilling, Xavier Descombes
To cite this version:
Anca-Ioana Grapa, Raphael Meunier, Laure Blanc-Féraud, Georgios Efthymiou, Sébastien Schaub,
et al.. Classification of the fibronectin variants with curvelets. ISBI 2018 - IEEE 15th
Interna-tional Symposium on Biomedical Imaging, Apr 2018, Washington, DC, United States. pp. 930-933,
�10.1109/ISBI.2018.8363723�. �hal-01868726�
CLASSIFICATION OF THE FIBRONECTIN VARIANTS WITH CURVELETS
Anca-Ioana Grap˘a
?Rapha¨el Meunier
?Laure Blanc-F´eraud
†Georgios Efthymiou
‡S´ebastien Schaub
‡Agata Radwanska
‡Ellen van Obberghen-Schilling
‡Xavier Descombes
??
Universit´e Cˆote d’Azur, Inria, CNRS, I3S, France
†Universit´e Cˆote d’Azur, CNRS, Inria, I3S, France
‡Universit´e Cˆote d’Azur, CNRS, INSERM, IBV, France
ABSTRACT
The role of the extracellular matrix (ECM) in the evolution of certain diseases (e.g. fibrosis, cancer) is generally accepted but yet to be completely understood. A numerical model that captures the physical properties of the ECM, could convey certain connections between the topology of its constituents and their associated biological features. This study addresses the analysis and modeling of fibrillar networks containing Fi-bronectin (FN) networks, a major ECM molecule, from 2D confocal microscopy images. We leveraged the advantages of the fast discrete curvelet transform (FDCT), in order to ob-tain a multiscale and multidirectional representation of the FN fibrillar networks. This step was validated by performing a classification among the different variants of FN upregulated in disease states with a multi-class classification algorithm, DAG-SVM. Subsequently, we designed a method to ensure the invariance to rotation of the curvelet features. Our results indicate that the curvelets offer an appropriate discriminative model for the FN networks, that is able to characterize the local fiber geometry.
Index Terms— FN networks, ECM, curvelets, DAG-SVM classification
1. INTRODUCTION
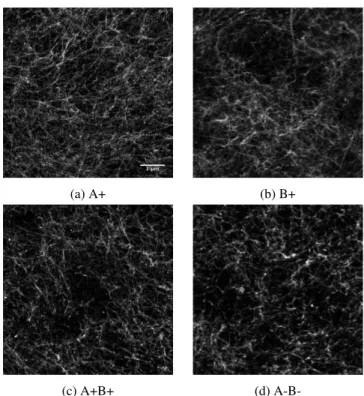
The ECM represents a molecular scaffold used by cells to ad-here, migrate and communicate in tissues. One of its major components is the Fibronectin (FN) molecule, a large multi-domain protein which is assembled by cells into fibrillar net-works. It is known that the fibrillar organization of the cellular FN is a key feature of the ECM and can take various confor-mations depending on the presence of alternatively spliced variants [1]. FN variants differ by the inclusion (or exclu-sion) of two FN Type III Domains (Extra Domains A and B). In this study, we focused on the analysis and modeling with curvelets of four variants: FN A-B-, FN A+, FN B+ and FN A+B+ illustrated in Fig. 1.
A significant number of methodologies have been pro-posed in the literature to extract highly discriminative features
out of images. We are interested in multiresolution analytical tools that are able to capture the geometrical properties (e.g. scale, orientation) of the anisotropic fibers in a multiscale-based fashion. Several studies on multi-resolution analysis show that curvelet basis is suitable to represent curvilinear features [2]. A fast discrete curvelet transform [3] was used in order to capture and describe the geometry of the FN net-works with curvelets. However, the extracted features are not invariant to rotation. For example, two images that have different main orientations but correspond to the same FN variant will be assigned to two different classes.
(a) A+ (b) B+
(c) A+B+ (d)
A-B-Fig. 1: Different variants of FN. Scale bar = 1 µm
In this paper, we describe a method to align images in a given direction before computing the discrete curvelet
coeffi-cients. Our approach was validated by performing a classifi-cation among the four variants, with a DAG-SVM classifier. In order to obtain an alternative representation of the image in the feature space, called image signature, we built a Bag of Features model of the curvelet coefficients. The results of signature classification were compared to those of a special-ist. We, therefore, show that our feature extractor model can outperform a trained biologist in terms of classification accu-racy.
2. THE CURVELET TRANSFORM AND FEATURE EXTRACTION
In the field of image processing, multiscale/multiresolution tools have been extensively used for anisotropic feature ex-traction (points, lines, edges) and detection, compression etc. Among existing methods, the wavelets can detect features such as point singularities [4] but do not constitute a well-suited technique to represent curvilinear features, such as those that describe the FN fibers.
The curvelet transform is a family of frames that is pro-posed as a means to tackle this inconvenience. We chose the second generation of curvelets, which is a multiscale pyramid allowing the representation of a certain number of possible directions at multiple scales [4].
2.1. Fast Discrete Curvelet Transform
The output of the linear transform is a collection of coef-ficients cj,l,k evaluated in Fourier domain (real-valued),
in-dexed by discrete-valued scale j, orientation l and location k. Usually, a finer scale is associated with a higher num-ber of possible orientations. This property allows for highly anisotropic elements being represented at a fine scale.
Conceptually, the transformation implements a tight frame, meaning that every function f ∈ L2(R2) can be represented as follows [3]:
f =X
j,l,k
cj,l,kψj,l,k (1)
where
ψj,l,kis the discrete curvelet waveform
and
cj,l,k = hf, ψj,l,ki (2)
The Parseval identity then holds: X
j,l,k
cj,l,k2= ||f ||2L2(R2), ∀f ∈ L 2
(R2) (3)
Regarding the digital implementation of the curvelet transform, there are multiple options for the construction of cartesian arrays, instead of polar tiling, in the frequency
plane. We chose the wrapping method implemented in Curvelet Toolbox [3] for its simplicity in the handling of the discretization grid.
2.2. Curvelet feature extraction
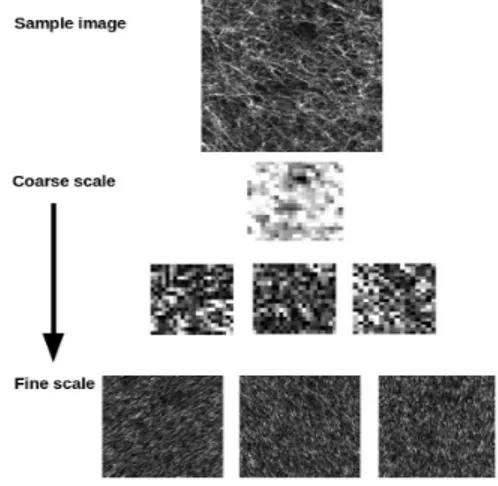
Each image of size N × N is decomposed into (log2(N ) − 3) dyadic scales and the number of angular sectors for each scale differs according to the following example: for N = 512, the curvelet transform returns 6 scales with 1, 16, 32, 32, 64, 64 possible orientations from coarse to fine scales respectively. Fig. 2 illustrates the curvelet coefficients amplitude matrices for 3 levels of decomposition corresponding to coarsest scale 1, 2, and finest scale 6. The multiple matrices at each level belong to different orientations. A certain fiber will be re-constituted by a linear combination of curvelet coefficients at different scales and orientations.
Fig. 2: Curvelet scale decomposition of a sample image at 3 scales, from coarse to fine: 1, 2, 6.
Related studies consider different statistical properties of the curvelet coefficients for texture characterization, such as energy [5], entropy or curvelet subband distribution [6]. As our main interest is to perform geometrical modeling of the fibers rather than a pure assessment of their discriminative power, instead of computing average statistical features to facilitate the classification, we have worked with the coeffi-cients themselves.
However, we chose to reduce the vast number of coeffi-cients taken into account for the classification, and thus keep the most significant ones. To do so, we selected the largest curvelet coefficients that contain a suitable percentage of the total energy. A percentage of 85% seems to be a good com-promise between the speed of the training and classification algorithm and the fidelity of image reconstruction, as illus-trated in Fig. 3. Finally, the coefficients that belong to the
finest scale, susceptible of capturing the eventual acquisition noise present in the images, were not taken into account.
(a) Input sample (b) Reconstructed sample
Fig. 3: Reconstruction of a sample image after keeping 85% of total curvelet coefficients energy.
2.3. Invariance to rotation
The curvelets that are described above are not invariant to ro-tation. In a discriminating context, this aspect can be quite problematic, as it can impact the accuracy of the classifica-tion. What is important in the FN images is the presence of multiple dominant orientations, relative to each other. Dur-ing the acquisition process, the samples of the ECM may also be differently oriented. Hence we needed to ensure that the images follow the same main privileged direction.
To do so, we estimated the dominant orientation of the fibers and rotated every image according to its own dominant orientation. Since this different information is hidden in the energy distribution over the subbands, we opted for an es-timation of the dominant orientation using the gradient vec-tor of the images. For a function f ∈ R2, we consider its
gradient vector ∇f = (fx, fy) with magnitude defined by
|∇f | =q2 f2
x+ fy2and orientation θ = arctan( fy
fx). We can
now estimate the dominant orientation Θ as:
Θ = P i |∇fi| 2 θi P i |∇fi|2 (4)
where |∇fi| is the magnitude and θiis the orientation of the
image gradient at pixel i.
Subsequently, the images were aligned to the same direc-tion, after performing a rotation by interpolation with the cor-responding Θ.
3. BAG OF FEATURES MODEL
In order to validate the assumption that curvelets can provide a suitable model for the characterization of FN fibers, we first needed to show their ability to describe the fiber geometry in terms of physical characteristics (e.g. scale, orientation, loca-tion). In addition to that, we were interested in determining
the discriminating capacity of the curvelet features (i.e. abil-ity to discriminate among the different FN variants). There-fore a bag of features model [7], adapted to our data, was developed in order to analyze the classification results of the four FN variants, as detailed below.
The curvelet features that describe the fibers are the col-lection of coefficients cj,l,a with scale j, orientation l and
magnitude a. We performed a K-means clustering of the curvelet coefficients after the curvelet decomposition of the image database, referred to as the training dataset. In order to determine an appropriate number of clusters, we used a heuristic elbow method [8] and found K = 400 number of to-tal clusters. The normalized feature histogram was computed as the rate of the number of its curvelet coefficients assigned to each cluster, as shown in Fig. 4. Also referred as image signature, it is stored as a K-dimension vector of real-positive values. The image signature constitutes the input data for the chosen classifier.
We decided to use a non-exhaustive k-fold cross valida-tion technique with k = 4 to evaluate the classificavalida-tion perfor-mance and its generalization capabilities. The classification of the feature histograms is performed using a DAG-SVM classifier, using LibSVM [9], as described below.
Fig. 4: Bag of features pipeline (from left to right): K-means clustering in curvelet feature space, image signature (feature histogram) and classification of the image signatures.
3.1. DAG-SVM classifier
In terms of classification of the previous curvelet feature his-tograms, we are faced with a supervised non-linear problem. Support vector machine (SVM) constitutes a standard statis-tical learning technique to solve binary classification and re-gression problems. An extension of SVM to multi-class tech-niques, DAG-SVM [10], was used in this study for the classi-fication of the image signatures corresponding to the FN vari-ants. For a 4-class problem, we built and trained 4(4 − 1)/2 binary SVM classifiers, arranged in a tree structure [7] with 4 layers and 4(4 − 1)/2 nodes. The classification was hence performed by evaluating a decision function in each node, re-sulting in (4 − 1) decisions to be made for a test sample. The classification process with DAG-SVM is therefore relatively fast.
4. SIMULATION RESULTS
This section describes the implementation of the proposed method for the classification of the four FN variants. We de-ployed a database of 280 images of 3128 × 3128 pixels with a lateral resolution of 0.27 µm/pixel, acquired with a Zeiss 710 confocal system. Each class contains 70 images corre-sponding to the four FN variants. For speed convenience, we selected a representative region of 512 × 512 pixels from each image and used those regions for feature extraction and clas-sification. The classification results were compared to those of a trained specialist, in terms of general classification accu-racy, as well as confusion matrices.
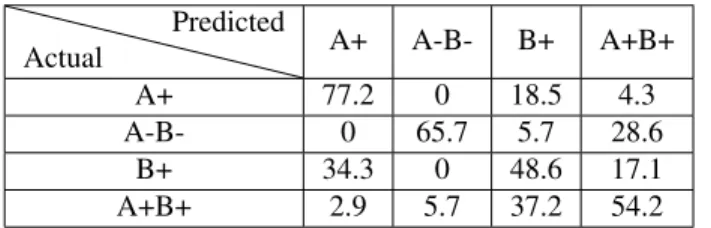
Table 1 indicates the values of the confusion matrix for the automatic classification, while Table 2 shows the results of the specialist. The confusion matrix indicates that the classifier is highly capable of distinguishing the FN images belonging to variant A-B- from the rest of the others. Additionally, the classifier is presented with a greater challenge when it comes to distinguishing among classes B+ and A+. A similar pat-tern was noted in the confusion matrix that corresponds to the classification performed by the specialist.
Actual Predicted A+ A-B- B+ A+B+ A+ 64.3 2.9 25.7 7.1 A-B- 0 90 0 10 B+ 25.7 4.3 45.7 24.3 A+B+ 0 15.7 8.6 75.7
Table 1: Confusion matrix in percentage form - automatic classification Actual Predicted A+ A-B- B+ A+B+ A+ 77.2 0 18.5 4.3 A-B- 0 65.7 5.7 28.6 B+ 34.3 0 48.6 17.1 A+B+ 2.9 5.7 37.2 54.2
Table 2: Confusion matrix in percentage form - Trained spe-cialist
The fiber geometry associated to the A-B- FN variant, characterized by short filaments without a specific pattern, seems to be represented by a more discriminative geometric model. On the other hand, the topological properties of the fibers corresponding to FN A+, and FN B+ (i.e. fiber length and the presence of an apparent directionality) are quite sim-ilar, thus increasing the difficulty in differentiating between them. FN variant that incorporate the B+ domain is the least distinguishable, both in automatic and manual classification.
Regarding the general accuracy of classification, the
clas-sification scheme that is proposed in this paper (68.92%) out-performs the results obtained by a trained specialist (61.42%).
5. CONCLUSION
FN network fibers exhibit local geometric properties that can be captured by curvelet features. We can reconstruct the fibers as a linear combination of curvelet coefficients at multiple scales and orientations. In addition, we are able to classify among the four variants of interest, with a similar perfor-mance to that of a trained specialist. Future studies will focus on the development of generative models of the 2D/3D FN variants, as well as the generation of a model based on differ-ences in FN architecture caused by tumor-like cells.
Acknowledgements. This work was supported by the French Government (National Research Agency, ANR) through the ”In-vestments for the Future” LABEX SIGNALIFE: program reference ANR-11-LABX-0028-01.
6. REFERENCES
[1] Van Obberghen-Schilling E., Tucker R.P., Saupe F., Gasser I., Cseh B., and Orend G., “Fibronectin and tenascin-c: Accom-plices in vascular morphogenesis during development and tu-mor growth,” Int J Dev Biol, vol. 55, pp. 511–25, 2011. [2] Jianwei Ma and Gerlind Plonka, “A review of curvelets and
re-cent applications,” in IEEE Signal Processing Magazine, 2009. [3] Emmanuel Cand`es, Laurent Demanet, David Donoho, and Lexing Ying, “Fast discrete curvelet transforms,” SIAM Jour-nal on Multiscale Modeling and Simulation, vol. 5, 09 2006. [4] M.J. Fadili and J.-L. Starck, “Curvelets and ridgelets,”
Ency-clopedia of Complexity and Systems Science, vol. 3, pp. 1718– 1738, 2009.
[5] Yan Shang, Yan-Hua Diao, and Chun-Ming Li, “Rotation in-variant texture classification algorithm based on curvelet trans-form and svm,” in 2008 International Conference on Machine Learning and Cybernetics, July 2008, vol. 5, pp. 3032–3036. [6] F. Gmez and E. Romero, “Rotation invariant texture
character-ization using a curvelet based descriptor,” Pattern Recognition Letters, vol. 32, no. 16, pp. 2178 – 2186, 2011.
[7] Gabriella Csurka, Christopher R. Dance, Lixin Fan, Jutta Willamowski, and C´edric Bray, “Visual categorization with bags of keypoints,” in Workshop on Statistical Learning in Computer Vision, ECCV, 2004, pp. 1–22.
[8] Trupti M. Kodinariya and Prashant R. Makwana, “Review on determining number of cluster in k-means clustering,” Interna-tional Journal of Advance Research in Computer Science and Management Studies, vol. 1, 2013.
[9] Chih-Chung Chang and Chih-Jen Lin, “LIBSVM: A library for support vector machines,” ACM Transactions on Intelligent Systems and Technology, vol. 2, pp. 27:1–27:27, 2011. [10] Pheng Shen and Shiang Liu, “An improved dag-svm for
multi-class multi-classification,” 2009 Fifth International Conference on Natural Computation, vol. 1, pp. 460 – 462, 2009.