HAL Id: halshs-02982827
https://halshs.archives-ouvertes.fr/halshs-02982827
Preprint submitted on 29 Oct 2020
HAL is a multi-disciplinary open access archive for the deposit and dissemination of sci-entific research documents, whether they are pub-lished or not. The documents may come from teaching and research institutions in France or abroad, or from public or private research centers.
L’archive ouverte pluridisciplinaire HAL, est destinée au dépôt et à la diffusion de documents scientifiques de niveau recherche, publiés ou non, émanant des établissements d’enseignement et de recherche français ou étrangers, des laboratoires publics ou privés.
Hosting Refugees and Voting for the Far-Right:
Evidence from France
Sarah Schneider-Strawczynski
To cite this version:
Sarah Schneider-Strawczynski. Hosting Refugees and Voting for the Far-Right: Evidence from France. 2020. �halshs-02982827�
WORKING PAPER N° 2020 – 69
Hosting Refugees and Voting for the Far-Right:
Evidence from France
Sarah Schneider-Strawczynski
JEL Codes: F22, J15, D72, P16, R23
Hosting Refugees and Voting for the Far-Right:
Evidence from France
∗
Sarah Schneider-Strawczynski
†October 28, 2020
Abstract
Does exposure to refugees change the political preferences of natives towards far-right parties, and how does this change in preferences occur? This paper exam-ines the political economy of refugee-hosting. Using the opening of refugee centers in France between 1995 and 2017, I show that voting for far-right parties in cities with such opening between two presidential elections has fallen by about 2 per-cent. The drop in far-right voting is higher in municipalities with a small population, working in the primary and secondary sectors, with low educational levels and few migrants. I show that this negative effect can not be explained by an economic chan-nel, but rather by a composition chanchan-nel, through natives’ avoidance, and a contact channel, through natives’ exposure to refugees. I provide suggestive evidence that too-disruptive exposure to refugees, as measured by the magnitude of the inflows, the cultural distance and the media salience of refugees, can mitigate the beneficial effects of contact on reducing far-right support.
JEL: F22, J15, D72, P16, R23
Keywords: Migration, Refugees, Political Economy, Preferences
I. Introduction
Since 2015, Europe has been confronted with a migration crisis characterized by large refugee influxes. The European Union alone received 366,000 new refugees out of a total of 1.2 million asylum seekers in 2016. This surge in refugee and asylum seeker inflows has revived the public’s concerns over hosting refugees and these fears have been used and fuelled by the long-term anti-immigrant extreme-right parties. Concurrently, Europe experienced a rise in extreme-right voting with parties such as the AfD in Germany, the
∗Contact : [email protected]
I would like to thank Clément de Chaisemartin, Julien Grenet, Sergei Guriev, Xavier d’Haultfoeuille, Camille Hémet, Thomas Piketty, Hillel Rapoport, Liam Wren-Lewis, and seminars participants for their advice and comments.
FPöparty in Austria, the Lega in Italy, the Golden dawn party in Greece, or the
Rassem-blement Nationalin France gaining prominence.
In this paper, I focus on the native population directly exposed to refugee inflows and answer the following question: does exposure to refugees change natives’ political preferences towards far-right parties, and how does this change in preferences happen? On the one hand, direct exposure to refugees could lead to an extreme-right vote due
to the actual or feared economic and fiscal costs of immigration (Becker et al., 2016),
negative externalities on the neighbourhood of residence (Halla et al., 2017a), on the
educational environment of native children (Otto and Steinhardt, 2014a), or on natives’
culture (Hainmueller and Hopkins,2014). On the other hand, intergroup contact between
natives and refugees could decrease natives’ prejudice (Allport, 1954) by reducing the
distance of practices and situations between the two groups (Agier, 2013). As Allport
(1954) who complements his contact hypothesis by a set of prerequisites1, I will undertake
my analysis from the premise that it is not just any kind of contact that can lead to a change
in immigration and political preferences (Valentine,2008).
I use the opening of refugee centers in 446 municipalities in France between 1995 and 2017 to identify the effect of small-scale humanitarian inflows on the far-right vote at presidential elections. Using a difference-in-difference strategy in a staggered adoption design, I compare the evolution of extreme-right voting in both hosting and non-hosting municipalities before and after the opening of a refugee center. The opening of a refugee center is a good experiment to examine the political consequences of exposure to humani-tarian migrants because they do not choose the centers to which they are assigned, but also because the process of opening refugee centers is centralized, leaving municipalities with very little discretion over the opening. I also use various specification strategies, using a control group of municipalities matched on observable characteristics, using a control group of municipalities that will open a refugee center at a later date, looking at varia-tions within municipalities using data at the polling station level, and performing several robustness tests, to address potential identification concerns. This enables me to derive the causal impact of the opening of refugee centers on the extreme-right vote. I then use the detailed information on the center’s openings to analyze the channels that can explain such an effect, and under which conditions the contact hypothesis channel is maximized. On average, the vote-share for the extreme-right at presidential elections decreases by 1.8 to 3.7 percent following the opening of a refugee center in hosting municipalities compared to non-hosting municipalities. I show that the effect on the vote for the extreme right two elections after the opening almost doubles so that the vote for the extreme-right drops relatively from 3.7 to 10 percent from about 5 to 10 years after the opening of
1“[Prejudice] may be reduced by equal status contact between majority and minority groups in the
pursuit of common goals. The effect is greatly enhanced if this contact is sanctioned by institutional supports (i.e., by law, custom, or local atmosphere), and provided it is of a sort that leads to the perception of common
a refugee center. I find a sharper decrease in municipalities with a small population, a higher proportion of primary and secondary workers, a lower proportion of highly skilled people, lower incomes, and a lower migrant population. The effect is also stronger in municipalities which voted more for the left-wing party at the beginning of the period, and that the relative decrease of the vote for the extreme-right seems to benefit the left-wing party whose vote-share at presidential elections increases afterwards. This is consistent with the fact that the openings can reduce the existing vote for the extreme right but also prevent it from growing, or in other words, shifting the minds of extreme-right voters but also hindering traditional-party voters from moving to the far-right.
I demonstrate that this decline in far-right voting is not due to an economic demand shock and I am the first to explain this effect through both a composition and a contact channel. I show that even in the absence of a native flight, the results can be partly explained by a native avoidance phenomenon. I then use the characteristics of the centers’ openings to investigate how the contact hypothesis is maximized. First, I do not detect any variation in the effect with the duration of exposure to the refugee centre or with the distance from the city-center. I then find suggestive evidence that the drop in the vote for the extreme right is lower in housing centers with a higher capacity relative to the population, with a higher proportion of non-European immigrants, and that opened at at time where the salience of the refugee topic in the national press was higher. In line with the threshold and realistic group conflict theories, these latest findings point to the fact that too-intense or too-disruptive contact, due to higher levels of refugee arrival, higher cultural distances between refugees and the native population, or media salience of the refugee arrival, may not activate the contact hypothesis as well as a more proportionate contact.
This paper adds to the literature on the political economy of immigration in three ways. For immigration in general, a substantial part of the literature finds that
immigra-tion can increase anti-immigrant party voting (Otto and Steinhardt, 2014b; Becker and
Fetzer, 2016;Barone et al.,2016;Halla et al., 2017b;Harmon, 2018;Dinas et al., 2019;
Edo et al., 2019). Some indicate more nuanced findings. Mayda et al.(2018) show that an increase in low-skilled immigrants improves the votes for the Republican Party (more anti-immigration during the period considered), whereas a rise in high-skilled migration has the opposite effect. These studies concentrate primarily on contexts with significant migration inflows whose overall political effect may be explained by a variety of compet-ing factors, such as real or perceived economic risks, changes in attitudes due to contact, compositional effects, etc... A similar statement holds for studies on refugee migration.
On the one hand,Dustmann et al.(2019) find an increase in far-right voting in rural
Dan-ish municipalities hosting refugees, with opposite effects in urban municipalities. Dinas
et al. (2019) show that far-right Golden Dawn votes increased in the Greek islands
Greek islands subject to sudden and large increases in refugee inflows have become in-creasingly hostile to them. On the other hand, exposure to small-scale refugee inflows due to dispersal policies has been found to have a negative impact on extreme-right wing
voting in Austria (Steinmayr, 2016), Italy (Gamalerio et al., 2020), and France (Vertier
and Viskanic,2019), a result that the authors attribute to the contact hypothesis.
This work also supports the contact hypothesis channel. However, unlike the above reviewed literature, this paper finds support for the contact hypothesis once accounted for potential confounding factors such as economic consequences of refugee-hosting or
compositional changes (building on previous work byBatut and Schneider-Strawczynski
(2019) using the same context), and qualifies it in relationship to the “threshold” (Schelling,
1971;Card et al.,2008;Aldén et al.,2015) and “realistic group conflict” theories ( Camp-bell, 1965; Bobo, 1983;Quillian, 1995;Dustmann et al., 2019). More precisely, it pro-vides comprehensive evidence that the relationship between the contact with refugees and votes for the far-right depends on the intensity of contact, as measured by the capacity of the center, the cultural distance of hosted refugees, or the media salience of the refugee topic. To the best of my knowledge, this paper is the first to provide several pieces of evidences to connect the threshold or the realistic group conflict theories to the contact hypothesis to show that a too-intensive contact may have counteracting effects. This last finding can explain the contrasting results found in the literature on the political economy
of refugee migration (Steinmayr,2016;Dinas et al.,2019;Vertier and Viskanic,2019).
Second, it contributes to the context on which the literature usually studies the elec-toral consequences of refugee-hosting. My time frame of analysis of more than twenty years allows to look at small and regular inflows of refugees encompassing both periods of crisis and of normal inflows of refugees. For now, the literature on the political conse-quences of hosting refugees focus almost exclusively on the context of the 2015 refugee
crisis (Dinas et al., 2019;Steinmayr, 2020;Vertier and Viskanic,2019;Gamalerio et al.,
2020). In particular, this an important aspect that differentiate my work from the one of
Vertier and Viskanic(2019) as they focus on the French context of emergency relocation of refugees to provisional housing centers for dismantling the Calais Jungle during the refugee crisis and on a short-term exposure to refugees. To my knowledge, the only paper that focuses on the political effects of refugee-hosting outside of the refugee crisis is the
one byDustmann et al.(2019) who look at the effect of refugee hosting in Danish
munici-palities over the 1986-1998 period. Differently from that paper, I focus the French context on a longer and more recent period from 1995 to 2017 and I find different heterogeneity results for small and rural municipalities. Moreover, these studies focus on the effect of hosting refugees only in subsequent elections and do not have the opening date to account for exposure time, limiting the possibility of studying longer-term patterns. Unlike them, not only can I investigate the role of the exposure time, but I can also robustly estimate the effect on the two subsequent presidential election periods and, combined with data on
European elections, can plot the dynamics of this impact over up to five election periods. Thus, compared to literature, my analysis context enables me to study the short-term and long-term consequences of a representative and typical refugee-hosting pattern.
Finally, this paper provides a methodological contribution to literature on immigra-tion’s impact on political outcomes. The first part of the literature uses instrumental vari-able strategies to circumvent the endogeneity threat from immigrants’ location choices.
In the spirit ofAltonji and Card (1991) and Card (2001), the literature often resorts to
a shift-share instrument (Otto and Steinhardt, 2014b; Barone et al., 2016; Halla et al.,
2017b; Edo et al., 2019; Lonsky, 2020). For refugee-hosting, the number of buildings suitable for group hosting has been used as an instrument for refugee-centers’ location (Steinmayr, 2016; Harmon, 2018; Vertier and Viskanic, 2019; Gamalerio et al., 2020). Using an instrumental variable strategy only provides the Local Average Treatment on
the Treated (ATT) (Angrist and Imbens, 1995), that is, the Average Treatment Effect
(ATE) only for units that are effected by the instrument, while policy makers may be more interested in the ATE for all units. Another part of the literature on the effect of migration resorts to quasi-experimental settings such as mine in which the exogenous
al-location of refugees is used for the identification of the ATE (Edin et al.,2003;Åslund and
Rooth, 2007;Damm,2009;Dustmann et al.,2019). I will use such a setting to estimate the ATE and I contribute to this strand of the literature by using the latest developments in the difference-in-difference econometric literature for the staggered adoption design (de Chaisemartin and d’Haultfoeuille, 2020). I also propose new specification strategies as robustness checks for the identification, such as using as a control group municipalities that have not yet opened a refuge-center or looking at within municipalities variations using polling-station-level data. Finally, to the best of my knowledge, I am the first to perform a dynamic analysis in this context, which is useful not only for distinguishing be-tween short-term and long-term effects, but also to check for the existence of pre-trends.
The paper is structured as follows. Section IIpresents the context and data. Section
IIIdetails the empirical and identification strategy. Section IVinvestigates the effect of
refugee center openings on the vote for the extreme-right. SectionVconcludes.
II. Context
II.1. Humanitarian migrants
France has a long tradition of hosting those who were named refugees, starting with Dutch refugees who arrived in 1787 to escape from the Orangists’ revolution in the United Province of the Netherlands, the Poles in the 1830s, Spanish refugees fleeing Carlist wars in the 1840s, Russian whites and Armenian refugees in the 1920s, Spanish Republicans
in the 1930s, or refugees from Vietnam, Cambodge or Laos from the mid 1970s (Burgess,
migra-tion has raised public awareness of refugees. In 2015, we saw a significant increase in the number of sea and land arrivals from 6,913 monthly detected sea arrivals in the Mediter-ranean sea in January 2015 to 222,800 sea arrivals detected in October 2015. More than 1 million first-time asylum applicants were registered in 2015 and 2016 in Europe. Within the European Union the situation was more heterogeneous. Although the number of asy-lum seekers per year in Germany rose by 159 percent between 2014 and 2016 to about 587 thousand in 2016, France experienced a much milder increase of 12 per cent over the same period to reach 63 thousand new asylum seekers in 2016. In fact, as can be seen in
Figure1, France has experienced various waves of asylum seekers inflows over the last
two decades.
Figure 1: Asylum seekers inflows in France – 1995 - 2017
● ● ● ● ● ● ● ● ● ● ● ● ● ● ● ● ● ● ● ● ● ● ● 20,416 17,398 21,42522,461 30,897 38,633 47,168 50,839 52,382 50,314 42,229 25,984 23,553 26,864 32,903 36,602 40,11541,254 45,92545,545 59,335 63,935 73,802 Former Yougoslavia Bosnia and Herzegovina
Algeria Chechnya Bangladesh Armenia Kosovo Albania China DRC Soudan Afghanistan Albania Haïti Syria DRC 20,000 30,000 40,000 50,000 60,000 70,000 1995 1996 1997 1998 1999 2000 2001 2002 2003 2004 2005 2006 2007 2008 2009 2010 2011 2012 2013 2014 2015 2016 2017 Years
Asylum applications in France
Source: OFPRA activity reports. Note: Main asylum seekers’ countries of origin are displayed for the specific periods.
This paper focuses on these several waves of humanitarian migration involving asylum seekers, subsidiary protection beneficiaries, and refugees. Asylum seekers are individuals who apply for the refugee status. In France, and since 1991, they do not work during
their asylum procedure2and receive the “Allocation pour demandeurs d’asile” , a monthly
subsidy that is equivalent to 6.80 euros per day for a household of one person. The average time taken to process an asylum application since 2000 is 5 months, with peaks depending on period, as in 2015, when processing time rose to 7 months. Asylum seekers can be assigned to a housing center to wait for their asylum application to be processed. They
2Asylum applicants are allowed to ask for a temporary work permit if the processing of their application
takes more than nine months. In practice, even if their application has been processed for more than 9 months, they do not engage in this demanding procedure to obtain the right to work.
have no choice as to the location of the housing center to which they are assigned, and the monthly subsidy is conditional on them accepting the housing solution offered. The “Office Français de Protection des Réfugiés et des Apatrides” (OFPRA, French Office for the Protection of Refugees and Stateless Persons) evaluates their asylum demand and either rejects their request, grants them the refugee status, or grants them the subsidiary protection status. Those who obtain the refugee status have a ten-year renewable residence permit and the same rights as a French citizen, aside from voting rights. Asylum seekers who do not meet the refugee status criteria but are at risk of serious harm in the origin
country3obtain the subsidiary protection, which is a one-year renewable residency permit
with the right to work. Those whose requests are denied either leave French territory or become undocumented.
II.2. Hosting scheme for humanitarian migrants in France
European countries have introduced dispersal policies for refugees to spread hosting costs
across the territory4. The welcome scheme in France consists of different types of centers
that host refugees or asylum seekers during the processing of their applications. The first center was set up in the 1970s to house South American refugees fleeing the dictatorships of the 1960s and 1970s, as well as boat people from Vietnam. Several waves of asylum seekers have put the hosting scheme under stress, and new centers have often been set up to cover these new waves. There are several types of centers for refugees and asylum seekers. The “Centres Provisoires d’Hébergements” (CPH) are the oldest centers created in the 1970s and host refugees and beneficiaries of subsidiary protection. The “Centres d’Accueil pour Demandeurs d’Asile” (CADA) were established at the beginning of the 1990s and are usually only for asylum seekers, but refugees can remain there for up to 3 months and sometimes more in practice if other hosting schemes are overflowing. Then there are the “Hébergements d’Urgence des Demandeurs d’Asile” (HUDA), the “Acceuil Temporaire - Service de l’Asile” (AT-SA) and “Programme d’Accueil et d’Hébergement des Demandeurs d’Asile” (PRAHDA) for hosting asylum seekers. In order to deal with the refugee crisis, another type of center, “Centres d’Accueil et d’Orientation” (CAO),
was set up in 2015 to help absorb migrants and asylum seekers from the Calais camp5, but
most of them were temporary and closed within the year of their opening. The average capacity of a housing center is 66 humanitarian migrants. The largest increase in the
3Among the possible serious harm covered are: death penalty or execution, torture or inhuman or
de-grading treatment or punishment, serious and individual threat to the life or person by reason of indiscrimi-nate violence resulting from a situation of internal or international armed conflict.
4Like Denmark from 1986 to 1998, Sweden from 1984 to 1994, the Netherlands from 1987, Norway
from 1994, Ireland from 2000 or the United Kingdom from 2000 (Robinson et al.,2003;Dustmann et al.,
2017).
5The Calais Camp (also known as Calais Jungle) are migrant and refugee camps near the town of Calais.
They have been in existence since 2002,and they have been dismantled several times by law enforcement. It hosted up to 9,000 migrants in August 2016.
number of centers created was in 2015-2016 as can be seen on Figure9a. As can be seen
on Figure10, most of the increase in that year was due to the opening of CAO centers.
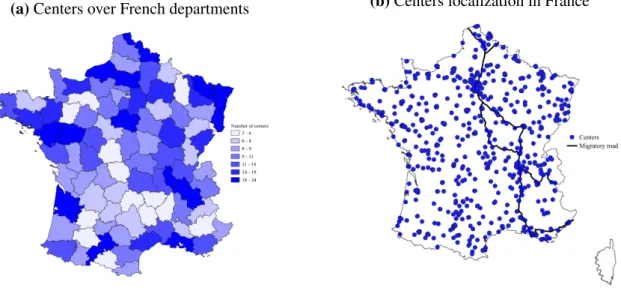
In 2018, there were about 1,000 housing centers spread across the territory. Figure 2
shows that, as of April 2018, housing centers for humanitarian migrants are relatively homogeneously spread across national territory.
The French government is implementing a centralized hosting scheme in order to “spread the burden” – to limit the feared adverse economic or social impact – of hosting humanitarian migrants. The French Interior Ministry launches project calls to open
hous-ing centers. Social houshous-ing landlords6 and NGOs then apply to open and run a center.
From discussions with French asylum actors (NGOs and social housing landlords), we know that the choice of a location to open a housing center is mainly driven by the avail-ability of a building already owned or rentable for about 15 years. They also provided us with anecdotal evidence that if the project is not selected, they don’t change the location and that they "recycle" the project for next open center calls. This anecdotal evidence is also central to one of the specification strategies where I look at only municipalities in which a center opens. Importantly, municipalities cannot influence the allocation process: they cannot choose the allocation timing nor the number or the characteristics of refugees allocated to them.
Figure 2: Housing centers for refugees and asylum seekers in France
(a) Centers over French departments (b) Centers localization in France
Source: Ministry of the Interior with data extraction in April 2018 (centers) and IOM - monitoring
flows (migratory routes). Note: Figure2ais a map of French departments, the darker the shade, the
more centers in the department. Figure2bshows the location of all housing center for refugee in France
in April 2018 and the migratory routes.
The selection of winning projects is informed by a selection grid covering a number
6National housing landlords are called “bailleurs sociaux” in French and operate over the entire French
territory. A social landlord is an organization that rents social housing to households in return for a moder-ate, means-tested rent, paid either by the occupants or paid for by the state. It may also be responsible for the construction of such housing.
of criteria, a shown in the example of a project call for the opening of CADA centers in
2013 on Figure 16 in Appendix A.1. The three main components are the architectural
aspects (22 percent of the coefficients), the quality of the project and the future operator (47 percent of the coefficients) and the funding modalities of the center (31 percent of the coefficients). Because the choice of the project was top-down and that there were no criteria for whether the localities should accept the opening of the center, the municipality had no say in the opening process until 2015. Starting in the autumn of 2015, criteria for the “position of local representatives” were added to the project architecture section of the selection grid, as can be seen from the example of the project call for the opening of
the CPH centers in 2019 in Figure17. Although this was added, it represented a
maxi-mum of 12.5 percent of the coefficients and local representatives did not necessarily mean the mayor but could be for instance the agreement of the Departmental Representatives (prefects) who were in charge of facilitating the openings. We also know a number of examples of local authorities’ opposition to the physical opening of centers post-2015, which means that municipal authorities were not necessarily consulted or their views were not taken into account in the centralized process. The selection process for the CAO centers opened in 2015 differed, as the Interior Ministry needed to quickly open them to dismantle the Calais and Dunkerque camps. The Interior Ministry and prefects played an active sourcing role in finding and persuading local authorities, generally mayors, to open CAO centers. Given the opening of CAO centers in 2015 and the slight change in selection criteria for other centers in 2015, we show that our results are still of a similar magnitude if we exclude CAO centers or focus on the period 1995-2012.
II.3. The extreme-right in France
The rise in the number of humanitarian immigrants following the 2015 refugee crisis was not the only dynamic of social change in Europe. Simultaneously, extreme-right parties grew rapidly, with examples like France’s Rassemblement National, Germany’s AFD, Italy’s Lega Nord, and Austria’s FPÖ. In France, the far-right share rose from 15% in 1995 to 21.3% in 2017 in the first round of presidential elections. In Germany, the AFD rose from 1.9% of the votes cast in the 2013 federal election to 12.6% of the votes cast in the 2017 federal election. In Europe, the rise of the extreme right was often linked to the current refugee crisis, given that if the population’s discontent with immigration were expressed in the ballot box, the extreme right-wing party would be the one harvesting the votes.
In France, the main extreme-right party is the Rassemblement National. Formerly known as the Front National, it was founded on 5 October 1972, following the neo-fascist group Ordre Nouveau ideology. It was led for most of its history by Jean-Marie Le Pen, and since 2011 by Marine Le Pen. From the outset, the Front National developed an anti-immigration discourse as a party unifying theme. As early as 1988, Jean-Marie Le
Pen was spreading his anti-immigration discourse “The people who give in to foreign
invasions have not long survived”.7’ From 1995 to 2017, the prevention of immigration
to France has always been the main focus of the extreme-right Rassemblement National candidates. Their immigration policy platform during presidential elections ranged from expelling all foreigners and preventing any immigration to France from 1995 to 2007, to cutting immigration to 10,000 immigrants per year from 2012 to 2017.
Figure 3: Extreme-right vote share at presidential elections first round in France
(a) 1995 (b) 2002 (c) 2007
(d) 2012 (e) 2017
Source: Ministry of the Interior. Note: Figure3presents maps of the extreme-right vote share at the
first round of presidential elections in 1995, 2002, 2007, 2012 and 2017 over French departments. The darker the shade, the higher the extreme-right vote-share.
In France, presidential elections are held using a two-round majority system. Presi-dential elections were held every 7 years before 2002 and since 2002, every 5 years. In my paper, I look at the evolution of the share of votes received by the extreme-right in the
first round of presidential elections from 1995 to 2017. Figure3 shows the geographic
distribution of the far-right voting shares in the first round of presidential elections over the period. The extreme-right appears to be particularly prominent in the eastern part of the country, and we can clearly see an increase in far-right voting, which increased by 40% between 1995 and 2017 in the first round of presidential elections.
II.4. Data
To examine the impact of exposure to humanitarian migrants on extreme-right voting, I focus on housing centers opening for humanitarian migrants in France. I use a database that I obtained from the French Interior Ministry in April 2018 that provides information on housing centers in France. It includes all types of centers for asylum seekers (HUDA,
CADA, AT-SA8) and all centers for refugees and beneficiaries of the subsidiary protection
(CPH9), and CAO10 centers. It provides information on the type of center, the name of
the operator, the date of opening, the capacity of the center, and its address.
Presidential elections results at the municipal level for 1995, 2002, 2007, 2012 and 2017 are publicly available through the French Ministry of the Interior. I compute the share of votes for the extreme right as the number of votes cast for the extreme right over the number of registered voters. The Front National (FN) was the only party classified as extreme-right in the 1995, 2007, 2012 and 2017 presidential elections. Bruno Mégret’s
Mouvement National Républicainis classified as an extreme-right party alongside the FN
for 2002.
I also rely on data from INSEE at municipal level on population age, proportion of workers in the primary, secondary and tertiary sectors, proportion of the population with baccalaureate or tertiary education, proportion of unemployed, proportion of vacant hous-ing, proportion of immigrants, density or population size. I also use DGFIP IRCOM data for the average resident income in each municipality.
Table 1: Descriptive statistics by hosting and non-hosting municipalities
1995 2017
Non-hosting Hosting Difference Non-hosting Hosting Difference
Far-right vote-share 11.61 11.54 0.08 21.45 15.97 5.48∗∗∗
Men share 0.50 0.49 0.02∗∗∗ 0.50 0.48 0.02∗∗∗
Young share (0-19 years-old) 0.26 0.26 -0.00∗ 0.24 0.23 0.00
Elderly share (>65 years-old) 0.18 0.17 0.01∗∗∗ 0.20 0.21 -0.01∗
Migrants share 0.02 0.06 -0.04∗∗∗ 0.03 0.07 -0.04∗∗∗
Unemployed share 0.09 0.11 -0.03∗∗∗ 0.09 0.14 -0.05∗∗∗
Primary sector workers share 0.17 0.04 0.13∗∗∗ 0.09 0.02 0.07∗∗∗
Secondary sector workers share 0.29 0.28 0.01 0.24 0.21 0.03∗∗∗
Tertiary educated share 0.10 0.13 -0.03∗∗∗ 0.22 0.24 -0.02∗∗∗
Vacant housing share 0.07 0.07 0.00 0.08 0.10 -0.01∗∗∗
Rural municipality 0.50 0.25 0.25∗∗∗ 0.50 0.25 0.25∗∗∗
Density 126 1274 -1147∗∗∗ 146 1390 -1243∗∗∗
Population 1,150 21,477 -20,326∗∗∗ 1,345 23,047 -21,702∗∗∗
Observations 33,520 446 33,966 33,520 446 33,966
Source: INSEE - French censuses (1990,1999,2006-2017). Note: For pre-2006 data, a linear interpo-lation is performed to convert data annually. The Table compares municipalities which experienced a refugee housing center opening between 1995 and 2017 (Hosting) and those that did not (Non-hosting).
8HUDA: Emergency Accommodation for Asylum Seekers. CADA: Reception Centres for Asylum
Seekers. AT-SA: Temporary Reception Asylum Service.
9CPH:Provisional Accommodation Centre.
Table1shows static differences between municipalities that opened a center after 1995 and those that never opened a center. We see that the share of the vote for the extreme right in the hosting and non-hosting municipalities was similar in 1995, and while both types of municipalities reported an increase in the vote for the extreme right, the non-hosting municipalities showed a 5 percentage points higher share of the vote for the extreme right in 2017 compared to hosting municipalities. We also see that centers open in less rural municipalities, that are more populated, with a higher proportion of migrants, a higher proportion of tertiary-educated population, more tertiary-sector specialized, and more unemployment.
III. Empirical Strategy
III.1. Specification
I estimate the following specification over the period 1995-2017:
Yit = α + β Openingit+ ωi+ δt+ εit (1)
with municipality i in election year t. Yit is my outcome of interest, that is the log share of
votes for the extreme right at the first round of presidential elections in my main
specifi-cations. Openingit is a variable equals to the number of refugee centers opened in
munic-ipality i at time t. δt, ωiare election year and municipality fixed effects respectively.
Mu-nicipality fixed effects capture any unit-specific time-invariant unobserved factors. Elec-tion year fixed effects capture any time-specific unit-invariant unobserved confounders. Standard errors are clustered at the municipality level. Under conventional identification assumptions, the OLS estimated coefficient of β measures the average deviation in the outcome of interest of hosting municipalities relative to non-hosting municipalities.
In Table10, I estimate the effect by using a standard difference-in-difference design.
However, recent developments in the estimation of difference-in-difference in staggered
adoption designs (Borusyak and Jaravel,2017;Goodman-Bacon,2018;de Chaisemartin
and d’Haultfoeuille, 2020) show that the estimated ATE is a weighted sum of different ATEs (comparisons between early treated and untreated, lately treated and untreated, early treated and lately treated before the treatment, lately treated and early treated after the treatment) with weights that may be negative. This can lead to substantial estimation errors.
Therefore, I usede Chaisemartin and d’Haultfoeuille(2020) estimation procedure to
com-pared to those remaining untreated: βS= E " 1 NS(i,t):t≥2,D
∑
t6=Dt−1[Yi,t(1) −Yi,t(0)]
#
(2)
with municipality i and election year t. NS= ∑t≥2,Dt6=Dt−1Nt with Nt the number of
reg-istered voters at t. Dt denotes the average treatment at t, Yi,t(1) and Yi,t(0) the average
potential outcomes with and without treatment respectively. βSis the average of the
treat-ment effect at the time when the treattreat-ment is received across all treated units. In our context, it will estimate the effect of opening refugee centers, in a municipality that did not have any center before, compared to municipalities that did not opened a center. This estimator estimates the treatment effect in the groups that switch to treatment, at the time when they switch, and does not rely on any treatment effect homogeneity condition.
Re-sults in Table 2 using the estimator of de Chaisemartin and d’Haultfoeuille (2020) are
very similar to results using the standard difference-in-difference estimation, as shown on
Table10.
III.2. Identification
The identification hypothesis is that the same evolution in the vote for far-right parties would have occurred in control and treated municipalities in the absence of the opening of refugee centers.
The main concern is the selection into treatment. For instance, one might think that control municipalities do not open a refugee centers because they are against migrants or that treated municipalities open a refugee center because they are pro-migrants. First, I
provide descriptive evidence in SectionII.2 that this is unlikely given how centralized is
the process of opening a refugee center is. I do note that starting from mid-2015, centers that opened had to, in theory, obtain local authority’s consent, especially in the case of CAO centers. To test if this potential endogeneity can drive my results, I remove CAO
centers from the estimation and I remove 2017 election year in Table7. I show that the
magnitude and significance of my coefficients remain unchanged when removing CAO centers or focusing on the 1995-2012 period.
Another concern might be whether control and treated municipalities experience dif-ferent trends because they differ in the level of their socio-demographic characteristics. To ensure that the results are not driven by differences in socio-demographic characteristics, I use a propensity score matching procedure to address differences in socio-demographic
characteristics. As shown in the column (3) of Table2, the significance and magnitude
of my estimate remains unchanged. In Table7, I also controls for municipalities
charac-teristics in column (5) and for department-specific time trends in column (4), and I show
extreme-right vote-share at presidential elections in 1995 with all the control variables described
in Table1and find no significant differences between the predicted values in control and
treated municipalities.
I also provide three additional specifications to address any remaining concerns about differential trends in control and treated municipalities. In a first specification, I focus solely on municipalities that are treated at one point in time. This specification is based
on anecdotal evidence described in SectionII.2that operators usually use the location of
unsuccessful applications to open a center for next project calls. Comparing only treated municipalities, i.e. comparing at t hosting municipalities opening centers at time t to hosting municipalities opening centers at time t+1, mitigates the concerns about the
dif-ferences between the control and treated municipalities. In columns (2) of Table2, I show
that the significance and magnitude of my results remain the same. In column (3) in Table
8, I also restrict the control group to only adjacent municipalities of localities in which
centers opened and still find a significant and negative effect on far-right voting. Finally,
in AppendixA.6, I use an instrumental variable strategy and find similar effects.
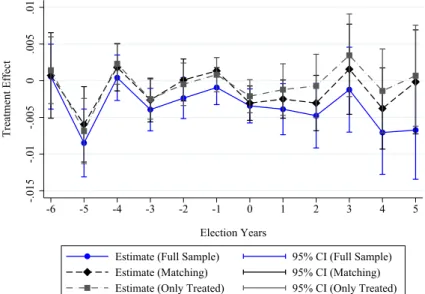
Finally, I provide additional robustness checks to address identification concerns and support the common-trend assumption. Combining data on European and presidential elections, I test for the presence of pre-trends by plotting the estimate with leads and lags
using thede Chaisemartin and d’Haultfoeuille(2020) estimator in Figure4and show that
the pre-trend assumption is valid for all my specifications. I also perform placebo tests on all my specifications as if treated municipalities opened a center in the previous period.
Table3shows that all my specifications pass placebo tests. To address potential spillovers,
I also test the robustness of the results by excluding all control municipalities that share
a common border with a municipality that opens a refugee center. Column (2) in Table8
shows that the effects remain very similar.
IV. Results
IV.1. Contemporaneous impact of opening a refugee center on far-right vote
This section examines the impact of opening a refugee center on the 1995-2017 vote for
the extreme right in France. Table 2shows the estimated β for extreme-right voting in
three specifications. Column (1) presents the estimate when the control group consists of all non-hosting municipalities. Column (2) presents the estimate when the control group consists of municipalities not being treated at that time, but being treated at subsequent pe-riods. Column (3) presents the estimate when the control group consists of municipalities
matched by a propensity score as described in AppendixA.5. Results are significant and
similar in magnitude in all specifications. On average, after a refugee center opening, the voting share for the extreme right decreases by about 2 percent compared to the control group. As, on average, municipalities that did not experience the opening of the refugee
center had an extreme right-wing vote of 16.2 over the period 1995-2017, the voting share for the extreme right increased by 0.328 points less in the hosting municipalities than in the non-hosting municipalities.
Table 2: Effect of refugee center openings on far-right voting at presidential elections
Outcome: vote-share (1) (2) (3)
of the extreme-right Full Sample Only Treated Matching
Center opening -0.037∗∗∗ -0.021∗∗∗ -0.018∗∗∗
(0.006) (0.008) (0.007)
Election year Fixed Effects Yes Yes Yes
Municipality Fixed Effects Yes Yes Yes
Observations 135,048 1,522 3,928
Source: Ministry of the Interior. Note:∗p< 0.10,∗∗p< 0.05,∗∗∗p< 0.01. The dependent variable is
the log vote share of the extreme-right at presidential election’s first round. Weighted by the number of registered voters at the beginning of the period. Standard errors are clustered at the municipality level.
The estimator relies on the assumption that municipalities that have opened a refugee center have experienced similar trends as municipalities that did not. To test this
assump-tion, I use the placebo estimate of de Chaisemartin and d’Haultfoeuille (2020) which
compares the evolution of the extreme-right voting from t − 2 to t − 1 in the
municipal-ities that are treated and not treated between t − 1 and t. Table3displays the results of
these placebo tests for all specifications and none of these placebo tests have a significant effect on extreme right voting. This supports the claim that our estimate captures well the impact of the opening of a refugee center. Using the standard difference-in-difference
es-timation, I present qualitatively similar estimates in AppendixA.2 and provide evidence
that some of the specifications are actually exposed to the negative weights issue when using the standard estimate.
Table 3: Placebo tests – Effect of refugee center openings on far-right voting at presiden-tial elections
Outcome: vote-share (1) (2) (3)
of the extreme-right Full Sample Only Treated Matching
Center opening -0.012 0.011 0.010
(0.010) (0.013) (0.009)
Election year Fixed Effects Yes Yes Yes
Municipality Fixed Effects Yes Yes Yes
Observations 100,839 860 2,755
Source: Ministry of the Interior. Note:∗p< 0.10,∗∗p< 0.05,∗∗∗p< 0.01. The dependent variable is
the log vote share of the extreme-right at presidential election’s first round. Weighted by the number of registered voters at the beginning of the period. Standard errors are clustered at the municipality level.
IV.2. Dynamic impact impact of opening a refugee center on far-right vote
Table4 extends the results to the next election period to show the dynamic effect of the
opening of a refugee center on extreme-right vote one and two presidential elections after the opening. The negative effect on the far-right vote significantly doubles two elections after the opening as the vote for the extreme-right dropped between 3.7 to 10 percent. Since presidential elections were held every five years from 2002, two elections after the opening correspond to about 5 to 10 years. This suggests a significant long-term impact of the opening of refugee centers on reducing extreme-right voting.
Table 4: Treatment dynamics – Effect of refugee center openings on far-right voting at presidential elections
Outcome: vote-share (1) (2) (3)
of the extreme-right Full Sample Only Treated Matching
Center opening at election t + 1 -0.037∗∗∗ -0.021∗∗∗ -0.018∗∗∗
(0.006) (0.008) (0.007)
Center opening at election t + 2 -0.100∗∗∗ -0.042∗∗ -0.037∗∗
(0.017) (0.20) (0.018)
Election year Fixed Effects Yes Yes Yes
Municipality Fixed Effects Yes Yes Yes
Observations t + 1 135,048 1,522 3,928
Observations t + 2 100,561 860 2,755
Source: Ministry of the Interior. Note:∗p< 0.10,∗∗p< 0.05,∗∗∗p< 0.01. The dependent variable is
the log vote share of the extreme-right at presidential election’s first round. Weighted by the number of registered voters at the beginning of the period. Standard errors are clustered at the municipality level.
On Figure4, I extend the number of periods by complementing presidential elections
with European elections to take a better look at the dynamics of the effect. I take
ad-vantage of the fact that, as shown on Figure18in AppendixA.3, European elections are
held regularly between presidential elections and the National Front has participated in all those elections.
In this section, I estimate the impact of refugee center opening on National Front’s vot-ing share. Several new estimators were proposed to estimate the dynamic treatment effect
of staggered adoption designs. For example,Callaway and Sant’Anna(2018) use groups
that are never treated as their control group, andAbraham and Sun(2018) use groups that
become treated at the last period as a control group. I chose the estimator proposed by
de Chaisemartin and d’Haultfoeuille(2020) because it uses both never treated units and non-treated units at t+1, forming a larger control group that could lead to a more precise
estimator. To estimate the dynamic treatment effect, I replace in equation2all Yi,t(0) by
set the past treatment status equal to its actual values.
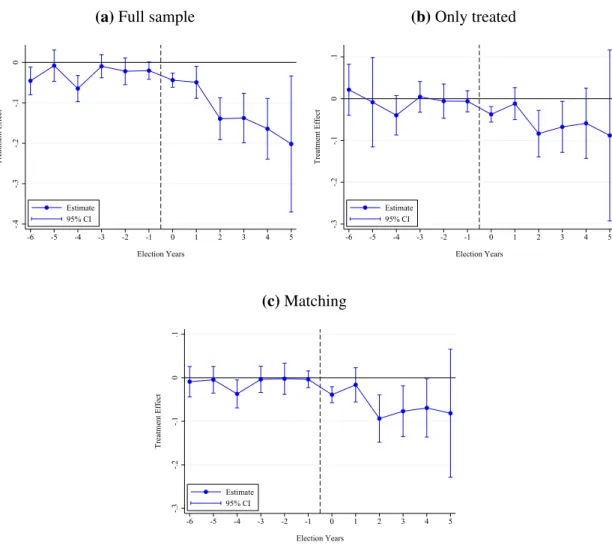
Figure 4 plots the effect coefficients comparing the outcome evolution from t1 to
t+ 1, between groups treated at period t, and groups still untreated at period t + 1 with
t ∈ {−6; 5}. 95 percent confidence intervals are presented with the vertical lines. There
are no trends prior the opening of a refugee center in all specifications. After the opening of a refugee center, we observe a shift in the trend towards a decline in National Front
voting share from the very next elections after the opening. In Table11it can be seen that
the magnitude of the effect of opening of a refugee center when pooling European and presidential elections together indicates a decrease in the National Front vote of about 4 percent in all specifications.
Figure 4: Treatment dynamics – Effect of a refugee center openings on voting for the
National Frontvoting at presidential and European elections
(a) Full sample
-.4 -.3 -.2 -.1 0 Treatment Effect -6 -5 -4 -3 -2 -1 0 1 2 3 4 5 Election Years Estimate 95% CI (b) Only treated -.3 -.2 -.1 0 .1 Treatment Effect -6 -5 -4 -3 -2 -1 0 1 2 3 4 5 Election Years Estimate 95% CI (c) Matching -.3 -.2 -.1 0 .1 Treatment Effect -6 -5 -4 -3 -2 -1 0 1 2 3 4 5 Election Years Estimate 95% CI
Source: Ministry of the Interior. Note: Estimated βSfrom equation (2) where the x-axis is the number
of elections relative to the opening of the refugee housing center and where the outcome is the log vote-share for the national front at presidential and european first round of elections. The incertitude of each point is asserted with a 95% confidence interval.
IV.3. Heterogeneity of the effect
IV.3.1. Municipalities’ characteristics
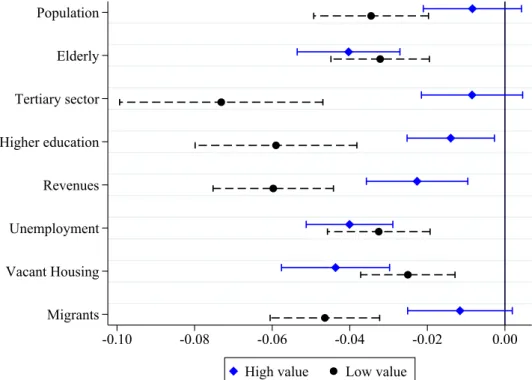
This section examines the effect’s heterogeneity to see if certain characteristics of the municipality play a role in the magnitude of the results. I divide the samples at the median value of the observable characteristics of treated municipalities in 1995. For example, the median population in 1995 in municipalities that will open a center between 1995 and 2017 is 782. I define “High” a sample of municipalities with a population in 1995 that is greater than or equal to 782 and “Low” a sample of municipalities with a population in
1995 that is less than 782. Figure5and Table14in Appendix A.4present an analysis of
the heterogeneity of the effect based on population size, proportion of elderly, proportion of people employed in the tertiary sector, proportion of people with tertiary education, income, proportion of unemployed, share of vacant housing and proportion of migrants in the municipality.
Figure 5: Treatment heterogeneity by municipal characteristics – Effect of refugee center openings on far-right voting at presidential elections
Population Elderly Tertiary sector Higher education Revenues Unemployment Vacant Housing Migrants -0.10 -0.08 -0.06 -0.04 -0.02 0.00
High value Low value
Source: Ministry of the Interior, INSEE - French censuses, and IRCOM data. Note: The incertitude of
each point is asserted with a 90% confidence interval. Estimated βSfrom equation (2) in the full sample
specification. The dependent variable is the log vote share of the extreme-right at presidential election’s first round. Weighted by the number of registered voters at the beginning of the period. Standard errors are clustered at the municipality level.
First, we see that the reduction in the vote for the extreme right after the opening of the refugee center is higher in small municipalities, which could be because the vote for
the extreme right generally increases more in small municipalities or because the contact
or compositional channels are more active in small towns. Table 12 in Appendix A.4
displays the extreme-right vote-share in 1995 and 2017 with samples divided by the same
cutoff is in Table14. If the extreme-right vote-share was higher in small towns in 1995, it
was much higher in the highly populated municipalities in 2017, as the extreme-right vote increased more in large cities. This suggests that the most indicated channels at work are contact or composition changes.
Secondly, with regard to the characteristics of the population living in the
munici-pality, it can be seen in Table 14 that the vote for the extreme right decreased more in
municipalities where the population worked mainly in the secondary or primary sector, was less skilled, and with lower incomes. This points to the intuition that the effect of opening a refugee center is mainly due to a contact that has changed the minds of those who are traditionally more opposed to immigration (low education, lower incomes, not
tertiary sector). These findings differ from those found byDustmann et al.(2019) in
Den-mark where hosting refugee has a positive effect on far-right rural voting but a negative effect on urban areas.
Finally, this is reinforced by our last finding that the effect of the decrease in the vote for the extreme-right is higher in municipalities that initially had a low proportion of immigrants. This again points to the contact hypothesis as a refugee center opening in municipalities in which fewer immigrants were living would increase the salience of refugee’s presence but would decrease the likelihood of disruptive/frictional contact with an immigrant population according to the threshold hypothesis.
IV.3.2. Vote for other political parties
On Figure6and in Table16in AppendixA.4, I investigate whether the drop in
extreme-right voting after the opening of a refugee center was more pronounced in more left or right-wing municipalities. To do so, I split the sample of treated municipalities at the median vote share for the extreme-right, right-wing, left-wing, and the extreme-left vote share in 1995. It shows that the reduction in vote the for the extreme-right was signifi-cantly higher in municipalities with a high share of left-wing votes at the beginning of the period.
Table 5reproduces the main analysis presented in Table2 for other political parties.
The left-wing parties are the ones who benefit from the relative decrease in the far-right
vote. The descriptive statistics in Table1showed that the vote for the extreme-right still
rose in treated municipalities but less than in control municipalities. This suggests a buffering effect of opening a refugee center such that it prevents people from starting to vote for the extreme-right. As the effect predominates in municipalities that were more left-wing at the beginning of the period, it is sensible that the left should be the political parties that gain from the opening of a refugee center because natives do not switch their
votes to the extreme right.
Figure 6: Treatment heterogeneity by political parties vote-share in 1995 – Effect of refugee center openings on far-right voting at presidential elections
Extreme-right
Right
Left
Extreme-left
-0.08 -0.06 -0.04 -0.02 0.00
High value Low value
Source: Ministry of the Interior. Note: The incertitude of each point is asserted with a 90% confidence
interval. Estimated βSfrom equation (2) in the full sample specification. The dependent variable is the
log vote share of the extreme-right at presidential election’s first round. Weighted by the number of registered voters at the beginning of the period. Standard errors are clustered at the municipality level.
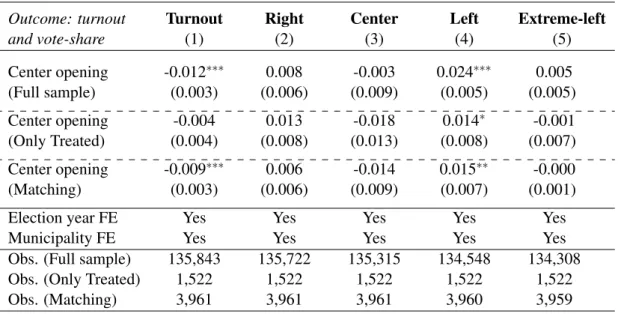
Table 5: Effect of refugee center openings on turnout and other political parties voting at presidential elections
Outcome: turnout Turnout Right Center Left Extreme-left
and vote-share (1) (2) (3) (4) (5) Center opening -0.012∗∗∗ 0.008 -0.003 0.024∗∗∗ 0.005 (Full sample) (0.003) (0.006) (0.009) (0.005) (0.005) Center opening -0.004 0.013 -0.018 0.014∗ -0.001 (Only Treated) (0.004) (0.008) (0.013) (0.008) (0.007) Center opening -0.009∗∗∗ 0.006 -0.014 0.015∗∗ -0.000 (Matching) (0.003) (0.006) (0.009) (0.007) (0.001)
Election year FE Yes Yes Yes Yes Yes
Municipality FE Yes Yes Yes Yes Yes
Obs. (Full sample) 135,843 135,722 135,315 134,548 134,308
Obs. (Only Treated) 1,522 1,522 1,522 1,522 1,522
Obs. (Matching) 3,961 3,961 3,961 3,960 3,959
Source: Ministry of the Interior. Note:∗p< 0.10,∗∗p< 0.05,∗∗∗p< 0.01. The dependent variable is
the log turnout in (1), and the log vote share at presidential election’s first round of right-wing parties in (2), center-wing parties in (3), left-wing parties in (4), and extreme-left parties in (5). Weighted by the number of registered voters at the beginning of the period. Standard errors are clustered at the municipality level. “FE” stands for Fixed Effects.
IV.4. Channels
IV.4.1. Economic changes
Better economic or labor market conditions could explain the decline in the extreme right-wing vote after the opening of the refugee center. A positive economic shock could be
plausible as humanitarian migrants are eligible for monetary subsidies11which could lead
to increased demand and expenditure on local services. Vertier and Viskanic (2019) that
examine the effect of opening CAO housing centers in France from 2012 to 2017, do not find any significant difference in net job creation per inhabitant between
municipal-ities that eventually received a CAO center and those that did not. Batut and
Schneider-Strawczynski(2019) investigate the same refugee-allocation context as I look at in France in 2002-2014, and find that the opening of a refugee center does not impact the
em-ployment or salary of workers in treated municipalities. However,Batut and
Schneider-Strawczynski(2019) observe a reduction in the firms’ economic activity and a decrease in the municipalities’ taxes income due to the native avoidance entailed by the refugee-center opening. If bad economic conditions were to spur the vote for the extreme-right party, it would work against the effect of a decrease in the vote for the extreme-right, making the reported estimate a lower bound of the true effect.
Figure 7: Effect of refugee center openings on population’s revenues
-.015 -.01 -.005 0 .005 .01 Treatment Effect -6 -5 -4 -3 -2 -1 0 1 2 3 4 5 Election Years
Estimate (Full Sample) 95% CI (Full Sample)
Estimate (Matching) 95% CI (Matching)
Estimate (Only Treated) 95% CI (Only Treated)
Source: IRCOM data. Note: Estimated βSfrom equation (2) where the x-axis is the number of years
relative to the opening of the refugee housing center and where the outcome is the log average revenues of the municipal population. The incertitude of each point is asserted with a 95% confidence interval.
I still check for the presence of positive effects of opening a refugee center on local population’s incomes as variations in this characteristic could affect electoral outcomes.
11Asylum seekers are entitled to the “Allocation pour Demandeurs d’Asile” while refugees over 25
To do so, I use the annual IRCOM tax data on revenues of the municipal population and
show no evidence of a revenue shock from the arrival of refugees in Figure7. This is also
useful for checking the presence of economic pre-trends prior to the opening of a refugee center, and it can be seen that hosting municipalities do not differ in income trend from non-hosting municipalities prior to opening a refugee center.
IV.4.2. Compositional changes
Batut and Schneider-Strawczynski(2019) show that the opening of a refugee center leads to a decline in the municipal population, which stagnates at around 2 per cent four years after the opening. This decline in population is not due to a native flight – to locals leaving hosting municipalities – but rather to native avoidance – to natives avoiding mov-ing to refugee-hostmov-ing municipalities. Thus, the municipal population could differen-tially change between hosting and non-hosting municipalities, with people coming less to treated municipalities and going to control municipalities instead. This could be a factor explaining the decline in far-right voting if, for example, prospective far-right voters were less likely to come to host municipalities. For the time being, the literature has overlooked this potential channel, although it is particularly relevant when looking at municipal data.
Table 6: Effect of opening a refugee center on voters
Outcome: (1) (2) (3)
Registered Voters ER voters ER vote share with
simulated population transfers
Center opening -0.010∗∗∗ -0.048∗∗∗ -0.030∗∗∗ (Full sample) (0.002) (0.007) (0.006) Center opening -0.005 -0.026∗∗∗ -0.016∗ (Only Treated) (0.003) (0.007) (0.009) Center opening -0.007∗∗∗ -0.025∗∗∗ -0.012∗ (Matching) (0.003) (0.006) (0.007)
Election year FE Yes Yes Yes
Municipality FE Yes Yes Yes
Obs. (Full sample) 135,854 135,048 135,048
Obs. (Only Treated) 1,522 1,522 1,522
Obs. (Matching) 3,961 3,961 3,961
Source: Ministry of the Interior. Note:∗p< 0.10,∗∗ p< 0.05,∗∗∗p< 0.01. The dependent variables
are the log number of registered voters in (1), the log number of voters who cast a ballot for the extreme-right in (2), and the log vote-share of the extreme-right after simulating populations changes in (3). Weighted by the number of registered voters at the beginning of the period. Standard errors are clustered at the municipality level. “FE” stands for Fixed Effects.
one year to occur. It can be seen on Figure13that 40 percent of the openings occurred
in the year before the previous election. I check in column (1) of Table 6 whether the
number of registered voters decreased more in hosting municipalities compared to non-hosting municipalities after the opening of a refugee center. The matching and full sample specifications detect a decrease by 0.7 to 1 percent of the registered population between the elections before and after the opening of a refugee center. To check whether this pop-ulation change could explain the results, I first look in column (2) whether the measure of the decline in voting for the extreme right as a share of registered voters does not decrease mechanically due to the higher decrease in registered population in hosting municipalities compared to non-hosting municipalities. Estimates in all three specifications still suggest a drop in the number of extreme-right voters from 2.5 to 4.8 percent.
Column (3) of Table6displays the result of an exercise in which I try to cancel the
native avoidance channel by doing as if treated municipalities would receive 2 percent more of their number of registered voters after the opening of the refugee center
com-ing from control municipalities12, and that all of them would vote for the extreme-right.
This is a conservative simulation as it assumes a 2 percent change based onBatut and
Schneider-Strawczynski(2019) population’s estimates and not the 0.7 to 1 percent found in registered voters data, and because it assumes that all newcomers would vote for the extreme-right. Accounting for the compositional channel does reduce the effect of the opening of a refugee center on voting for the extreme-right, but a part of the effect re-mains and is significant. This suggests that a compositional effect may explain a part of the decline in extreme-right voting after the opening of a refugee center, but not all of it. Following the literature, the rest of the effect could be attributed to the contact hypothesis channel.
IV.4.3. Contact hypothesis
TheAllport (1954) Intergroup Contact Theory postulates that contact between majority and minority groups could reduce prejudice of majority against minority groups.
Accord-ing toAllport(1954), the intergroup contact theory is activated when both groups have
i) similar characteristics, ii) work together towards a common goal, and iii) support their environment’s authorities, laws or customs. Inherent differences in the characteristics of natives and refugees, however, prevent condition iii) from being met. The analysis is thus based on the premise that, in this context, it is not just any type of contact between two
different groups that can lead to a reduction in prejudice (Valentine,2008). In particular,
I qualify the “contact theory” in relationship to the “threshold (or tipping-point) theory” (Schelling, 1971;Card et al., 2008;Aldén et al., 2015) to show that the relationship be-tween contact with refugees and voting for the far right (prejudiced against immigration)
12I take this 2 percent of population from control municipalities weighted by their vote-share for the
depends on the perceived contact intensity. In other words, it depends on how much con-tact is perceived as potentially disruptive, which is consistent with the “realistic group
conflict theory” (Campbell, 1965; Bobo, 1983; Quillian, 1995; Dustmann et al., 2019).
I provide a number of measures of different dimensions that could characterize disrup-tive contact, such as the duration of exposure to refugees, the capacity of the center, the proximity of the refugee center to the city-center, the cultural distance with the hosted
refugees, and the salience of the refugee arrival in the media. Figure8examines whether
the effect of the drop in the extreme-right vote following the opening of the refugee center is modified with the characteristics of the center opening. I use the full sample specifi-cation and divide the treated municipalities at the election period in which they become treated between municipalities below or above the median value of centers’
characteris-tic13. In Figure20in AppendixA.4, I split the sample over more percentiles to investigate
the heterogeneity’s dynamic in more details.
Figure 8: Treatment heterogeneity by centers’ characteristics – Effect of refugee center openings on far-right voting at presidential elections
Exposure time
Distance to city-center
Relative capacity
European asylum seekers
Refugee-topic in the press
-0.06 -0.04 -0.02 0.00
High value Low value
Source: Ministry of the Interior, “annuaire de l’administration”, OFPRA, and Europress data. Note:
The incertitude of each point is asserted with a 90% confidence interval. Estimated βSfrom equation
(2) in the full sample specification. The dependent variable is the log vote share of the extreme-right at
presidential election’s first round. Weighted by the number of registered voters at the beginning of the period. Standard errors are clustered at the municipality level.
First, I investigate whether the magnitude of the drop in extreme-right voting varies depending on the duration of exposure to refugees before the next election. The time-distance variable between the refugee center opening and next election ranges from 0
13This ensures that treated municipalities are evenly split across election periods and prevents that treated
to about 80 months, as shown in Figure 13 in Appendix A.1. Figure 8 shows that the duration of exposure to the refugee center does not produce a significant differential effect
on the vote for the far-right. Compared to the results described in Section IV.2, this
suggests that the subsequent reduction in extreme-right voting is not a long-term effect of exposure to the center, but rather a continuation of the political change driven by opening
the refugee center. Figure8 and Figure 20b in Appendix A.4 highlight the role of the
distance between the refugee center and the municipal center in the extreme-right vote decline. This distance is proxyed by the distance between the refugee center and the city-hall, which is often located in the active center of the municipality. There are no significant differences in the reduction of the vote for the far-right when the center is close or far from the city center. Taken together with the results on the duration of exposure, this is suggestive evidence that the contact effect may not result from direct interactions between refugees and natives, but rather from accepting a modified version of the living environment in which the likelihood of contact is not too disruptive.
Figure8shows how the effect on decreasing far-right voting varies with the relative
capacity of the center, measured as the number of places available in the refugee center relative to the municipality’s population. Looking at variations at the median, there do not
seem to be a significant difference, but Figure20cin AppendixA.4show some suggestive
evidence that the effect on the extreme-right vote reduction appears to be higher when the relative capacity of the center is low (below the 20 percentile of the distribution). This
is in line with the findings ofVertier and Viskanic (2019) and Gamalerio et al. (2020).
Figure8and Figure20din AppendixA.4investigate the role of cultural distance between
the hosted refugees and the native population on the decrease in decreasing extreme-right voting after the opening of a refugee center. I use monthly data on the country origin of
asylum seekers taken from the OFPRA14to proxy for the origin of humanitarian migrants
in the refugee center on its opening date. I find that the greater the proportion of European asylum seekers in the center, ie. the lower the cultural distance with the hosted refugees,
the higher the effect on the extreme-right vote reduction. Finally, Figure8and Figure20e
analyze whether the decline in far-right voting is heterogeneous when the center opened at a time when the media focused more on refugee issues. I matched Europress data on the monthly share of refugee articles in the national generalist press with the opening date
of refugee centers. Figure 11 in Appendix A.1 displays the occurrence of the refugee
topic in the national press from 1995 to 2018. I find that the more press coverage of refugees at the opening time of the refugee-center, the lower the decline in the extreme-right vote. These three findings suggest that the possibility of a too-disruptive contact between natives and refugees – enhanced by a higher number of hosted refugees, a greater cultural distance with the hosted refugees, and a higher salience of the refugee topic in the press – can mitigate the positive effect of opening a refugee center on the reduction of
far-right voting.
IV.5. Robustness
In this section, I test the robustness of the results by varying the specification, the sample of control municipalities, and the sample of treated municipalities to address the remain-ing identification concerns.
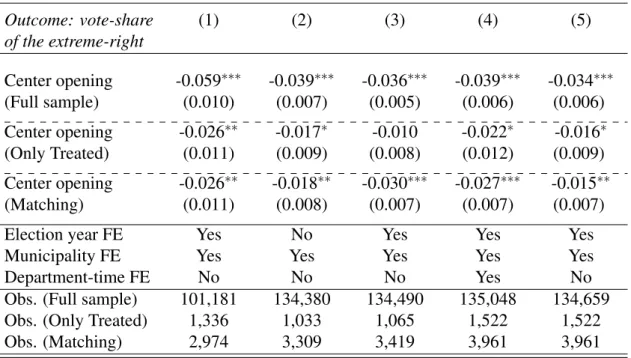
Table 7: Robustness tests – Effect of refugee center openings on far-right voting at presi-dential elections Outcome: vote-share (1) (2) (3) (4) (5) of the extreme-right Center opening -0.059∗∗∗ -0.039∗∗∗ -0.036∗∗∗ -0.039∗∗∗ -0.034∗∗∗ (Full sample) (0.010) (0.007) (0.005) (0.006) (0.006) Center opening -0.026∗∗ -0.017∗ -0.010 -0.022∗ -0.016∗ (Only Treated) (0.011) (0.009) (0.008) (0.012) (0.009) Center opening -0.026∗∗ -0.018∗∗ -0.030∗∗∗ -0.027∗∗∗ -0.015∗∗ (Matching) (0.011) (0.008) (0.007) (0.007) (0.007)
Election year FE Yes No Yes Yes Yes
Municipality FE Yes Yes Yes Yes Yes
Department-time FE No No No Yes No
Obs. (Full sample) 101,181 134,380 134,490 135,048 134,659
Obs. (Only Treated) 1,336 1,033 1,065 1,522 1,522
Obs. (Matching) 2,974 3,309 3,419 3,961 3,961
Source: Ministry of the Interior, INSEE - French censuses. Note: * p < 0.10, ** p < 0.05, *** p < 0.01. The dependent variable is the log vote share of the extreme-right at presidential election’s first round. Weighted by the number of registered voters at the beginning of the period. Standard errors are clustered at the municipality level. “FE” stands for Fixed Effects. In (1), I remove the election-year 2017 and perform the analysis over the 1995-2012 period. In (2), I remove all CAO centers from the estimation. In (3) I run the regression on a subsample of large NGOs operating housing centers. In (4), I include department-time fixed-effects. In (5) I control for the share of workers in the primary sector, in the secondary sector, the share of elderly, the share of migrants, the share of the population with a higher education, and the share of vacant housing.
Given the increased media attention received by refugees following the 2015 refugee crisis, one may be worried that this increased interest may have change the practice of opening refugee centers in a way that was more careful not to challenge local authorities’ preferences about hosting refugees. Since this could be a source of endogeneity, I exam-ine whether the results hold in the period 1995-2012, i.e. before the refugee crisis when
there was much less public concern or awareness of refugees. In column (1) of Table7,
I remove the election year 2017 and show that the results hold for the period 1995-2012 and even seem a bit higher than for the period 1995-2017. Given the heterogeneity