doi: 10.1093/cercor/bhx064
Advance Access Publication Date: 14 March 2017 Original Article
O R I G I N A L A R T I C L E
What
’s Behind a “+” Sign? Perceiving an Arithmetic
Operator Recruits Brain Circuits for Spatial Orienting
Romain Mathieu
1,2
, Justine Epinat-Duclos
1
, Monica Sigovan
3
,
Audrey Breton
1
, Anne Cheylus
1
, Michel Fayol
4
, Catherine Thevenot
5
and Jérôme Prado
1
1
Institut des Sciences Cognitives Marc Jeannerod, UMR 5304, Centre National de la Recherche Scienti
fique
(CNRS), Université Lyon 1, Bron, France,
2Faculté de Psychologie et des Sciences de l’Education, Université de
Genève, 1205 Genève, Switzerland,
3Laboratoire CREATIS, Université Lyon 1, CNRS/INSERM, INSA-Lyon &
HCL, Lyon, France,
4Clermont II & CNRS, UFR de Psychologie, LAPSCO, Université Blaise Pascal, 63037
Clermont-Ferrand, France and
5Institut de Psychologie, Université de Lausanne, 1015 Lausanne, Switzerland
Address correspondence to Romain Mathieu and Jérôme Prado, Institut des Sciences Cognitives Marc Jeannerod, UMR 5304, Centre National de la Recherche Scientifique (CNRS), Université Lyon 1, 67 Boulevard Pinel, 69675 Bron, France. Email: [email protected] (R.M.)/[email protected] (J.P.)
Abstract
Do mathematical symbols evoke spatial representations? Although behavioral studies have long demonstrated interactions between space and the processing of Arabic digits, how to interpret these results remains controversial. Here, we tested whether activity in regions supporting spatial processing contributes to the processing of symbols conveying fundamental arithmetic concepts—such as operation signs—even in the absence of associated digits. Using functional magnetic
resonance imaging, we show that merely perceiving a“+” sign triggers activity in brain regions that support the orienting of spatial attention in adults. Activity in these regions was greater for“+” than for “×” signs, indicating that it is modulated by whether an operator reflects an operation that evokes numerical manipulation (rather than rote memorization). Finally, the degree to which subjects activated a spatial region in response to a“+” sign was correlated with the degree to which subjects benefited from being briefly presented with that sign before having to calculate a single-digit addition problem, an effect termed operator-priming. Therefore, not only are some arithmetic operators linked to spatial intuitions, but such intuitions might also have an important role during arithmetic calculation. More generally, ourfindings support the view that mathematical symbols inherently evoke spatial representations.
Key words: arithmetic, attention, fMRI, space, symbol
Introduction
There is accumulating evidence that math skills relate to spa-tial skills in both adults and children (Casey et al. 1992;Hegarty and Kozhevnikov 1999;Kyttälä and Lehto 2008;Mix and Cheng 2011; Cheng and Mix 2014). To some extent, this may be explained by the fact that many basic mathematical concepts are grounded in space (e.g., measurements). However, it has also long been proposed that mathematical symbols by
themselves may rely on spatial representations (Fischer and Shaki 2014). Early support for this idea comes from an effect termed Spatial Numerical Association of Response Codes (SNARC). The SNARC effect refers to the observation that when participants are asked to process Arabic digits (e.g., classify them as even or odd), they respond faster to small numbers with the left hand than with the right hand. The reverse pattern is found for large numbers (Dehaene et al. 1993;Wood et al.
© The Author 2017. Published by Oxford University Press. All rights reserved. For Permissions, please e-mail: [email protected]
2008). According to a popular account, the SNARC effect might arise because participants mentally organize numbers of increasing size from left to right along a mental number line (MNL) in long-term memory. The MNL is typically thought to be the manifestation of an evolutionary old approximate number system (ANS), according to which numerical values are repre-sented as a series of partially overlapping Gaussian tuning curves along a mental continuum (Gallistel and Gelman 1992;
Dehaene et al. 1998; Piazza et al. 2004; Nieder and Dehaene 2009). Further studies have suggested that associations between space and numbers might be so strong that the passive percep-tion of a digit can bias spatial attenpercep-tion (Fischer et al. 2003;
Ristic et al. 2006;Dodd et al. 2008). For instance, passively view-ing small digits atfixation leads to better detection of subse-quent targets in the left visualfield, whereas passively viewing large digits facilitates the detection of targets in the right visual field (Fischer et al. 2003). Therefore, there is clear evidence of interactions between space and the processing of Arabic digits in the literature.
However, these spatial-numerical interactions may not necessarily indicate that Arabic digits inherently rely on spatial representations. For example, in a series of experiments, van Dijck and colleagues have argued that the SNARC effect might be an artifact of the way information is organized in working memory during task performance (van Dijck and Fias 2011;van Dijck et al. 2014;Fias and van Dijck 2016). That is,van Dijck and Fias (2011)showed that when participants are asked to perform a parity judgment task on digits that come from a random sequence previously encoded in working memory (e.g., 7-3-2-9-6), they do not associate smaller and larger numbers to the left and right sides of space (respectively). Instead, numbers at the beginning of the sequence (e.g., 7) are responded faster with the left hand and numbers at the end of the sequence (e.g., 6) are responded faster with the right hand. Thus, the SNARC effect might not reflect the fact that numerical values are represented along an MNL in long-term memory, but rather that information is spatially encoded in working memory during the task (i.e., elements that are early vs. late in a sequence are associated with the left vs. right side of space). Interestingly, van Dijck et al. (2013)found that such spatial organization of information in working memory might also account for the attentional SNARC effect observed inFischer et al. (2003). Thus, it is possible that the spatial-numerical interactions observed in behavioral studies arise entirely (or partly, see Huber et al. 2016) from working-memory effects. This, of course, casts doubt on the claim that there are long-term associations between space and mathematical symbols such as Arabic digits.
It is thus interesting to note that spatial associations do not appear to be restricted to Arabic digits. They can also be observed with non-numerical symbols that convey fundamen-tal arithmetic concepts, such as operation signs (e.g., “+”) (Marghetis et al. 2014;Pinhas et al. 2014). For instance,Pinhas et al. (2014)asked participants to classify“+” and “−” signs with right-hand or left-hand response keys. They found that “+” signs were responded faster with the right key, whereas“−” signs were responded faster with the left key. Unlike the SNARC effect, this“operation sign spatial association” (OSSA) effect is more easily explained by positing long-term associa-tions between space and numbers than by working-memory effects. For instance, if numbers are organized from left to right along an MNL, the OSSA may originate from the experience of always activating results that are larger than the operands when adding and results that are smaller than the operands when subtracting. It is also possible that adding or subtracting
numbers resemble rightward and leftward movements along the MNL, such that“+” and “−” signs themselves might become progressively associated with a rightward or leftward shift of attention (McCrink et al. 2007;Knops et al. 2009b;Masson and Pesenti 2014, 2016; Masson et al. 2016; Mathieu et al. 2016;
Pinheiro-Chagas et al. in press). The existence of such move-ments along the MNL during arithmetic calculation is sug-gested by findings from Knops et al. (2009a). The authors measured functional magnetic resonance imaging (fMRI) activ-ity of adult participants while they 1) performed saccades toward targets presented in the left and right visualfield and 2) calculated the results of multidigit subtraction and addition problems. The study not only revealed that brain activity in the posterior superior parietal lobule (PSPL) could distinguish between leftward and rightward saccades, but also that this classification could be used to distinguish between subtraction and addition. In other words, patterns of brain activity for eye movements resemble patterns of brain activity for arithmetic calculation in the PSPL, in line with the idea that subtracting or adding quantities is somewhat similar to moving to the left or right of an MNL. The perception of an arithmetic sign might thus prime such movements, giving rise to the OSSA (note that this hypothesis remains speculative because Knops et al. did not use actual arithmetic signs in their study, but rather the let-ters A and S for“adding” and “subtracting”).
Regardless of the factor at the source of the spatial intuitions underlying the OSSA, there are reasons to posit that such intui-tions may critically contribute to mental arithmetic. This is sug-gested by a study showing that the mere presentation of a“+” sign 150 ms before a single-digit addition problem facilitates problem-solving, an effect that can be termed “operator-prim-ing” (Roussel et al. 2002;Fayol and Thevenot 2012). Interestingly, this“operator-priming effect” appears to be specific to “+” (as well as“−”) signs because it is not observed for “×” signs and multiplication problems. This suggests that perceiving multipli-cation signs might not elicit any type of intuition that contri-butes to problem-solving. This may be due to the fact that associations between operands and multiplicative answers are explicitly learned by rote in school, such that the mere presenta-tion of a“×” sign may not by itself evoke an MNL. Together, the OSSA and the operator-priming effect thus suggest that some arithmetic operators (e.g.,“+”) might be associated with stronger spatial intuitions than others (“×”), and that these intuitions might have an important role in mental arithmetic.
Here, we set out to test this hypothesis using fMRI. Specifically, we tested 1) whether the mere perception of a “+” sign triggers activity in brain regions that are associated with the orienting of spatial attention (to a greater extent than“×” signs) and 2) whether this activity contributes to the operator-priming effect. In the scanner, adult participants were first asked to perform an overt spatial attention task in which they moved their eyes toward horizontal targets. This task, adapted fromKnops et al. (2009a), allowed us to precisely localize the brain regions involved in the orienting of spatial attention. Within these brain regions, we then measured brain activity while participants were presented with trials in which a“+” sign was displayed without any operands (hereafter addition “sign-only” trials) (see Fig.1). Tight control for the perception of that“+” sign was provided by trials in which a “×” sign was dis-played without any operands (hereafter multiplication sign-only trials). Both“+” and “×” signs have similar conceptual and perceptual features. However, “×” signs do not elicit any operator-priming effect and therefore should not be associated with any specific intuition (see above). To provide a context for
the perception of these signs and disguise the goal of the fMRI experiment, sign-only trials were also interspersed withfiller trials in which the “+” or “×” was immediately followed by operands (hereafter “sign-plus-operands” trials), prompting subjects to solve the arithmetic problem. Finally, outside the scanner, the size of the operator-priming effect was measured for each participant using a version of the operator-priming task employed byFayol and Thevenot (2012).
Materials and Methods
Participants
Twenty-nine native French-speaking volunteers with no prior history of neurological disease, mental disorders, or attention deficits participated in the study. Following the selection cri-teria ofFayol and Thevenot (2012), subjects were included in the study only if they scored above 70 on the addition and sub-traction–multiplication subtests of the French Kit to ensure that they were all proficient in arithmetic (French et al. 1963). The French Kit is a nonstandardized test of arithmetic abilities that is widely used in behavioral research (Campbell and Xue 2001;Imbo et al. 2007;Fayol and Thevenot 2012). Each of its subtests (i.e., addition and subtraction–multiplication) consists of 2 pages of 60 problems. The addition subtest involves add-ition problems with 3 numbers of either 1 or 2 digits (e.g., 63+ 99 + 5). The subtraction–multiplication subtest involves sub-traction problems with 2-digit operands (e.g., 51–28) and multi-plication problems with both 2-digit and 1-digit operands (e.g., 73 × 8). All participants were given 2 min per page and were instructed to solve the problems as fast and accurately as pos-sible. The number of problems correctly solved on each of the addition and subtraction–multiplication tests were summed up to yield a total arithmetic score. Scores ranged from 70 to 144 (mean= 92) across subjects. All subjects included in the study were also right-handed, as measured by the Edinburgh Handedness Inventory. Data from 2 subjects were excluded because of excessive head movement in the scanner (i.e., great-er than 3 mm,n = 1) and poor whole-brain coverage (i.e., insuf-ficient coverage of the temporal and the occipital lobes, n = 1). Therefore, the final sample consisted of 27 participants (13 males) aged from 18 to 27 years (mean age= 22.7 years). All participants provided written informed consent to participate in the study, which was approved by the local ethics committee (CPP Sud-Est II, Lyon). Across the 2 sessions, the total duration
of the experiment was about 3 h. Subjects were paid 80€ for their participation in the study.
Psychometric Assessment
Because the French kit is not a standardized test, participants’ arithmetic skill with respect to the general population was fur-ther assessed with the Math Fluency subtest of the Woodcock-Johnson III Tests of Achievement (Woodcock et al. 2001). The Math Fluency is a standardized test in which participants solve simple addition, subtraction, and multiplication problems within a 3-min time limit. The test consists of 2 pages of 80 problems involving operands from 0 to 10. Addition, subtraction, and multi-plication problems are intermixed, but multimulti-plication problems are only introduced after Item 60. Standardized scores ranged from 100 to 128 (mean= 111), indicating that participants had average to high arithmetic skills. Scores on the French kit and on the Math Fluency were highly correlated across subjects (r = 0.56, P = 0.0025, BF10= 18.15; see below for details on Bayes Factor).
Behavioral Session
During afirst behavioral session, each participant performed a version of the operator-priming task used by Fayol and Thevenot (2012)andRoussel et al. (2002). Stimuli were single-digit addition and multiplication problems. Problems were composed of pairs of operand between 2 and 9, presented in both commutative orders (e.g., 7+ 2 and 2 + 7). Tie problems (e.g., 2+ 2) were excluded. Thus, there were 56 addition pro-blems and 56 multiplication propro-blems.
In each trial, a problem was presented in its entirety, with the 2 operands, the operator sign (+ or ×), the equal sign and the answer (Fig. 4a). The answer could be valid or invalid. Invalid answers were obtained by adding or subtracting 1 to or from the valid answer (see Supplementary Table 2 for a full list of problems and answers). For both operations, the arithmetic sign was presented either 150 ms before (negative Stimulus Onset Asynchrony or SOA) or at the same time as the operands (null SOA). Therefore, there were 448 trials (i.e., 56 pairs of oper-ands× 2 operations [addition/multiplication] × 2 SOA [negative/ null]× 2 answers [valid/invalid]). Trials were distributed across 4 successive blocks of 112 trials each. In each block, trials were pseudorandomly ordered so that no more than 3 problems of the same type could appear consecutively. The order of blocks was counterbalanced between subjects. The experiment started Figure 1. fMRI experimental design. In the scanner, participants (n = 27) were presented with sign-only and sign-plus-operands versions of addition and multiplica-tion trials. At the beginning of each trial, a sign was presented at the center of the screen for 150 ms. The sign was“+” in addition trials and “×” in multiplication trials. In sign-only trials (left), the trial ended with the presentation of the sign and was simply followed by the intertrial period offixation. In sign-plus-operand trials (right), the“+” or “×” sign was immediately followed by a single-digit addition or multiplication problem presented along with an answer. In those cases, participants were asked to evaluate whether the answer of the problem was true or false.
with 8 practice trials. These practice trials included tie pro-blems (e.g., 2+ 2), problems involving 0 (e.g., 5 × 0), and pro-blems involving 1 (e.g., 3+ 1). The whole behavioral session lasted about 30 min.
Stimulus presentation was controlled by Presentation soft-ware (Neurobehavioral Systems). Problems were displayed in white Arial 60-point font on a black background (single-digit operands size: 1.5°; arithmetic sign size: 1°). Problems were pre-sented left-to-right (e.g., 3× 4 = 12) with the center of the screen corresponding to the arithmetic operator. All trials started with the presentation of a white central fixation dot for 1500 ms, immediately followed by a red centralfixation dot for 1000 ms signaling that the problem was about to be presented. The con-tent of the next screen varied as a function of the SOA condi-tion. In the negative SOA condition, the arithmetic sign (+ or ×) appeared alone for 150 ms and was immediately followed by the operands, the operator, the equal sign, and the answer (Fig.4a). In the null SOA condition, the whole problem appeared directly after the red centralfixation dot (Fig.4a). The subjects had to indicate whether the answer was valid or invalid as quickly as possible by pressing one of two keys on the computer keyboard. Participants had a maximum of 4000 ms to give their response. Response time (RT) corresponded to the time between the pres-entation of the whole problem and the button press.
fMRI Session
Ten days on average after the behavioral session (and no longer than 2 months after), subjects participated in the fMRI session. Participants performed 2 different tasks in the scanner: an overt spatial attention task and an arithmetic task (Fig.1). Participants practiced both tasks before entering into the scanner. Visual stimuli were generated using Presentation software and pro-jected onto a screen at the front of the scanner that was viewed by the participants through a mirror attached to the head coil.
The overt spatial attention task was adapted from Knops et al. (2009a)and consisted in alternating blocks of saccades and fixation. During saccade blocks (9 blocks), participants were asked to make saccades toward several successive target dots. Each saccade block contained 16 target dots (width and height, 0.2° visual angle) that appeared at random positions with an eccentricity of 3°, 3.5°, 4°, 4.5°, 5°, or 5.5° in the left or right visual field (up to ±0.42° jitter in y) for an average of 800 ms (with a jitter of ±200 ms). During fixation blocks (9 blocks), participants were asked to maintain fixation on a central dot for 12 800 ms. Block order was counterbalanced across participants. The total duration of the task was 4 min.
In the arithmetic task, participants were presented with sign-only and sign-plus-operands versions of addition and multiplication trials. At the beginning of each trial, a sign was presented at the center of the screen for 150 ms. The sign was“+” in addition trials and “×” in multiplication trials (Fig.1). In sign-only trials (30 trials each), the trial ended with the pres-entation of the sign and was simply followed by the intertrial period offixation (see below). This allowed us to isolate neural activity due to the presentation of the sign alone. In sign-plus-operands addition and multiplication trials (50 trials each), the“+” or “×” sign was immediately followed by a single-digit addition or multiplication problem (respectively) presented with an answer. Those trials were used asfillers and required partici-pants to evaluate whether the answer of the problem was true or false. Problems were constructed using the exact same cri-teria as in the behavioral session (see above and see Supplementary Table 2 for a full list of problems and answers).
The answer was valid in half of the trials (e.g., 4+ 3 = 7; 4 × 3 = 12) and invalid in the other half (e.g., 4+ 3 = 6; 4 × 3 = 13). The baseline consisted of trials in which an abstract “◊” sign replaced the“+” or “×” sign. There were 30 baseline sign-only trials (in which the“◊” sign was not followed by any operands) and 50 baseline sign-plus-operand trials (in which the“◊” sign was immediately followed by a string of 3 letters), prompting participants to indicate whether one of the letters presented was a B. In all sign-plus-operand trials, the problem remained on the screen for 4000 ms or until the participants gave an answer. All trials were followed by a variable period offixation ranging from 3000 to 3800 ms. A red centralfixation dot appear-ing between trials signaled that the next trial was about to begin in 1000 ms. As in the behavioral session, problems were dis-played in white Arial font on a black background (single-digit operands size: 1.5°; arithmetic sign size: 1°). Problems were pre-sented left-to-right (e.g., 3× 4 = 12) with the center of the screen corresponding to the arithmetic operator. The arithmetic task was decomposed in 4 functional runs of about 5 min each. The timing and order of trial presentation within each run was opti-mized for estimation efficiency using optseq2 (http://surfer.nmr. mgh.harvard.edu/optseq/). Behavioral responses were recorded using an MR-compatible response device placed in each hand. In sign-plus-operand trials, participants responded with their right thumb if the problem was valid and with their left thumb if the problem was invalid. RT corresponded to the time between the presentation of the whole problem and the button press. No response was required for sign-only trials.
Behavioral Analyses
RT data were logarithmically transformed to reduce skew of the RT distributions and improve the conformity of the data to the standard assumptions of parametric testing (Howell 2011). Mean RT was calculated based on valid problems that were responded correctly. Following Fayol and Thevenot (2012), mean RT during the operator-priming task was analyzed using planned comparisons generated by a within-subject ANOVA with the factors Operation (Addition, Multiplication) and SOA (Negative, Null). Standard statistics are reported for all effects, as well as Bayes Factors (BF10) indicating the strength of
evi-dence for the alternative hypothesis (H1) relative to the null hypothesis (H0) (Jeffreys 1961;Dienes 2011). Bayes Factors were calculated using JASP (https://jasp-stats.org). A BF10 greater
than 3 is typically suggestive of substantial evidence in favor of the alternative hypothesis (Jeffreys 1961;Dienes 2011).
fMRI Data Acquisition
Images were collected with a Philips Achieva 3T MRI scanner (Philips Medical Systems). The fMRI blood oxygenation level dependent (BOLD) signal was measured with a susceptibility weighted single-shot echo planar imaging sequence. Imaging parameters were as follows: time repetition (TR) = 2200 ms, time echo (TE)= 30 ms, flip angle = 90°, matrix size = 128 × 128, field of view = 220 mm, slice thickness = 3.5 mm (0.5 mm gap), number of slices= 25, voxel size = 2 × 2 × 4 mm3. About 118
volumes (standard deviation, SD = 2) were obtained during each run of the arithmetic task and 119 volumes were obtained during the spatial attention task. A high-resolutionT1-weighted
whole-brain anatomical volume was also collected for each participant. Parameters were as follows: TR = 6.59 ms, TE = 2.96 ms,flip angle = 8°, matrix size = 512 × 512, field of view = 240 mm, slice thickness= 1 mm, number of slices = 188.
fMRI Data Preprocessing
Data analysis was performed using the Statistical Parametric Mapping software (SPM12; Functional Imaging Laboratory, UCL, London, UK, http://www.fil.ion.ucl.ac.uk/spm). Each fMRI run started with 5 dummy scans to allow for magnetization equili-bration effects. The functional images were corrected for slice acquisition delays and spatially realigned to thefirst image of the first run to correct for head movements. The realigned functional images and the anatomical scans for each subject were then normalized into the standard Montreal Neurological Institute (MNI) space. This was done in 2 steps. First, after core-gistration with the functional data, the structural image was segmented into gray matter, white matter, and cerebrospinal fluid by using a unified segmentation algorithm (Ashburner and Friston 2005). Second, the functional data were normalized to the MNI space by using the normalization parameters esti-mated during unified segmentation (normalized voxel size, 2 × 2 × 4 mm3). Finally, the functional images were spatially
smoothed with a Gaussianfilter equal to twice the voxel size (4× 4 × 8 mm3full width at half-maximum).
fMRI Data Processing
Saccades andfixation blocks in the overt spatial attention task were modeled as epochs and the hemodynamic response func-tion was convolved with a boxcar funcfunc-tion corresponding to the epoch duration (about 12.8 s). Six regressors of no interest reflecting head motion were also included in the model, and the time-series data from each run were high-pass filtered (1/128 Hz). Finally, serial correlations were corrected using an autoregressive AR (1) model. For each subject, the fMRI response for saccades blocks was compared with the fMRI response for fixation blocks. These subject-specific contrasts were subsequently entered into a random effect (RFX)
one-sample t-test across subjects. A whole-brain family-wise error (FWE) corrected cluster-level threshold of P< 0.05 was applied to that contrast map (voxel height threshold:P < 0.005). This cluster-level threshold was calculated by 1) estimating the group smoothness using the group residuals from the general linear model and 2) using this information as input in whole-brain Monte Carlo simulations (10 000 iterations calculated with the 3dClustSim program—Compile date = 8 July 2016,
http://afni.nimh.nih.gov/afni/).
Following prior fMRI studies involving fast-rate attention cueing paradigms with cue-only trials (Weissman et al. 2005;
Orr and Weissman 2009;Griffis et al. 2015), sign-only trials of the arithmetic tasks were analyzed using a finite impulse response (FIR) model. Therefore, no assumption was made regarding the shape of the fMRI response for addition (“+”) and multiplication (“×”) sign-only trials, which was estimated with respect to baseline sign-only trials (“◊”). We modeled 8 time points with an interval of 2.2 s (corresponding to one TR) ran-ging from the onset of the sign to 17.6 s after the sign. The mag-nitude of the fMRI response for each type of sign-only trial was calculated by subtracting activity at the onset of the sign (i.e., first bin, or 0 s after the onset) from the peak activity (i.e., third bin, or ~6.6 s after the onset). Six regressors of no interest reflecting head motion were also included in the model. The time-series data from each run were high-pass filtered (1/128 Hz), and serial correlations were corrected using an auto-regressive AR (1) model. To ensure that our model was adapted to capture the BOLD response associated with our stimuli, we plotted the hemodynamic time-series in all activated clusters (see below and Fig.2b). For each subject, the magnitude of the fMRI responses for addition sign-only trials was contrasted against the magnitude of the fMRI responses for multiplication sign-only trials. Subject-specific contrasts were then submitted to a RFX one-sample t-test that was restricted to the voxels identified in the contrast of saccades versus fixation of the
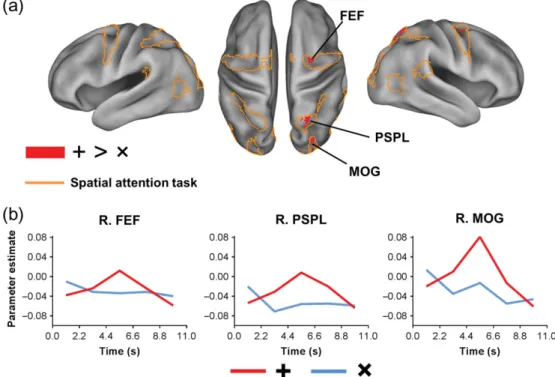
Figure 2. Neural activity associated with the perception of a“+” sign in the brain network for spatial attention. (a) Brain regions showing greater activation for addition than multiplication sign-only trials. Orange outlines delineate regions that were more activated during saccades thanfixation in the overt spatial attention task. (b) FMRI time courses in each activated cluster, with respect to baseline (for visualization only). Activations are overlaid on a 3D rendering of the MNI-normalized anatomical brain.
spatial orienting task. Using 3dClustSim and the procedure described above, an FWE-corrected cluster-level threshold of P < 0.05 was applied to that contrast map (voxel height thresh-old:P < 0.005). All coordinates are reported in MNI space and cytoarchitectonic areas are identified by referencing to the Jüelich atlas from the SPM Anatomy toolbox (Eickhoff et al. 2005). Complementary analyses of filler sign-plus-operand trials are described in Supplementary Data.
Regions of Interest Analyses
Brain activity in clusters showing a greater response to addition than multiplication sign-only trials within the brain network for spatial orienting was extracted using the SPM toolbox Marsbar (http://marsbar.sourceforge.net/). Regions of interest (ROIs) included all significant voxels within a 6-mm radius of each coordinate of interest, so as to ensure that plots would represent activity around the peak of each cluster. For each participant and ROI, we calculated the average response for 1) addition sign-only trials (versus baseline) and 2) multiplication sign-only trials (versus baseline). Hemodynamic time-series were plotted for visualization purpose.
Two analyses were performed with the ROIs. First, we assessed the functional coupling between ROIs during addition and multiplication sign-only trials (versus baseline) by per-forming across-subject correlations between contrast estimates in each pair of ROI. This was done separately for addition sign-only trials and multiplication sign-sign-only trials, yielding an × n − 1 correlation matrix (wheren is the number of ROIs) in each case. P values were corrected for multiple comparisons using the Bonferroni procedure. Second, we correlated the contrast esti-mates associated with addition sign-only trials (vs. baseline) to the operator-priming effect calculated in the behavioral session for addition problems in each ROI. P values were corrected for multiple comparisons using the Bonferroni procedure. Bayes Factor are reported for eacht-test and correlation.
Control Experiment
In a control experiment outside the scanner, 15 participants (mean age= 24.33 years, 6 males) performed a version of the fMRI task while their eye movements were continuously mea-sured using a Tobii X120 eye-tracker (temporal resolution: 60 Hz, spatial resolution: 0.5 degree of visual angle). This experi-ment was composed of sign-only trials (15 addition, 15 multi-plication, 15 baseline) and sign-plus-operand trials (25 addition, 25 multiplication, 25 baseline), which were randomized across 2 separate runs. Participants were seated at 80 cm from a com-puter screen with their head stabilized by a chin rest and fore-head rest to minimize fore-head movements, as in the MRI scanner (operands size: 1.5°; arithmetic sign size: 1°). We measured the proportion of time spent at fixating the arithmetic sign for each sign-only trial. First, we defined a 3° square area of inter-est (AOI) around the center of the screen. Second, we divided the time spent in this AOI by the total time elapsed between the onset of the sign and the end of the trial (i.e., a period of 2 s of white centralfixation).
Results
“+” Signs Elicit Responses in Several Brain Regions Underlying the Orienting of Spatial Attention
We first identified the voxels that were involved in the orienting of spatial attention using the contrast of saccades versus fixation in the spatial attention task. This contrast was associated with activity in several regions of a dorsal fronto-parieto-occipital network, including the bilateral superior and middle frontal gyri extending to the precentral gyrus, the bilateral inferior and middle occipital gyri, and the bilateral superior and inferior parietal lobules (see orange outlines in Fig. 2a and Table 1). We then tested whether there were any voxels in this spatial orienting network in which the magnitude of the response to addition sign-only
Table 1 Brain regions that were activated during the overt spatial attention task
Anatomical location Cluster size in mm3(number of voxels) MNI coordinates Z-score
X Y Z
L. Middle Occipital Gyrus 5392 (337) 42 −64 6 6.42
L. Calcarine (17) 30 800 (1925) −10 −76 6 6.23
R. Calcarine (17) — 14 −80 10 5.89
L. Lingual (17) — −12 −66 2 5.35
R. Lingual (18) — 10 −70 2 5.34
R. Superior Occipital Gyrus (18) — 22 −92 10 4.74
R. Middle Occipital Gyrus — 28 −70 26 4.60
L. Frontal Eye Field (6) 18 784 (1174) −24 −6 46 6.21
L. Precentral Gyrus (6) — −44 −4 50 5.86
L. Supplementary Motor Area (6) — −6 0 62 4.90
R. Supplementary Motor Area (6) — 4 6 62 3.78
R. Precentral Gyrus (6) 11 088 (693) 56 8 42 5.71
R. Frontal Eye Field (6) — 26 −6 50 4.91
L. Posterior Superior Parietal Lobule (7A) 14 032 (877) −24 −58 62 5.23
L. Inferior Parietal Lobule (7PC) — −34 −46 54 5.09
L. Precuneus (7A) — −14 −66 58 4.77
R. Superior Temporal Gyrus (PF) 3568 (223) 66 −36 22 5.22
R. Posterior Superior Parietal Lobule (hIP3) 7456 (466) 28 −58 54 4.65
R. Inferior Parietal Lobule (7PC) — 32 −46 50 3.56
R. Precuneus (7P) — 14 −70 62 3.20
L. Putamen 1888 (118) −22 6 6 4.40
Note: L., left; R., right; cytoarchitectonic areas were found with SPM Anatomy toolbox (Eickhoff et al. 2005) and are shown in parenthesis.
trials was greater than the magnitude of the response to multiplication sign-only trials. This was the case in 3 regions: the right PSPL, the right frontal eye field (FEF), and the right middle occipital gyrus (MOG) (see red clusters in Fig. 2a and Table 2). fMRI time courses in each of these regions (hereafter regions of interest or ROIs) are plotted in Figure2b for visualization purpose. Thus, the mere presenta-tion of a“+” sign (compared with a “×” sign) triggered activ-ity in several brain regions that were also involved in the orienting of spatial attention.
Related Activity in the FEF Is Coupled with Sign-Related Activity in the PSPL Across Subjects
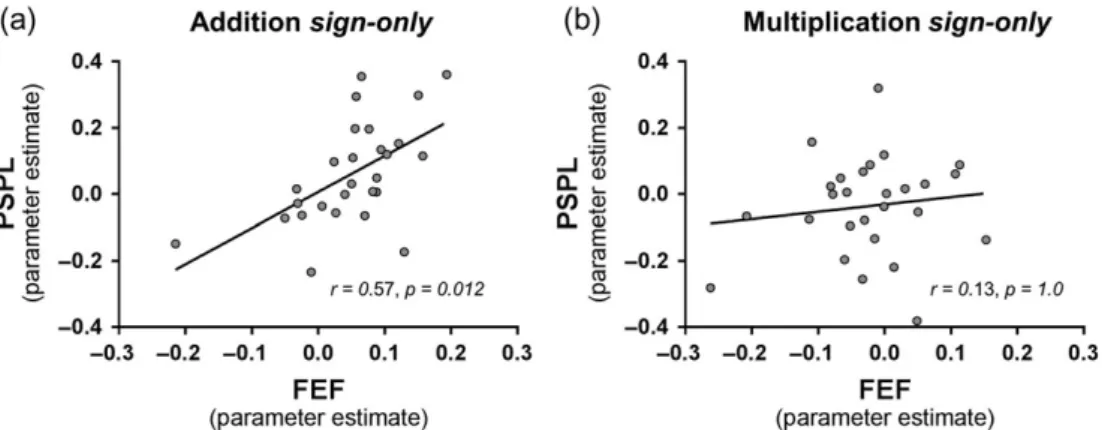
Brain regions underlying spatial attention are often conceptua-lized as components of a functionally coherent network (Corbetta et al. 1998; Corbetta and Shulman 2002; Grosbras et al. 2005). Therefore, we investigated whether any pairs of ROIs that were more responsive to addition than multiplication only trials were functionally coupled during addition sign-only trials (across subjects). Specifically, we calculated the across-subject correlations between each pair of ROI, separately for addition sign-only trials and multiplication sign-only trials. All P values were corrected for multiple comparisons (see Materials and Methods). For addition sign-only trials, we found a significant correlation between the FEF and the PSPL (r = 0.57, P= 0.012) (see Fig.3a). No such correlation was found for multi-plication sign-only trials (r = 0.13, P = 1; see Fig. 3b). Bayes Factor analysis indicated substantial evidence for a coupling between the FEF and PSPL during addition sign-only trials (BF10= 20.97), but no evidence for such a coupling during
multi-plication sign-only trials (BF10 = 0.29). Therefore, across
sub-jects, the FEF and PSPL were functionally coupled with each other in addition but not in multiplication sign-only trials.
Responses to“+” Signs in the FEF Relate to the Operator-Priming Effect
We then asked whether interindividual variability in the degree to which ROIs responded to the“+” sign was related to interin-dividual variability in the size of the operator-priming effect (i.e., a facilitation of addition problem-solving when the oper-ator is presented 150 ms before the problem). To this aim, we asked all participants to perform a version of the operator-priming task (Fayol and Thevenot 2012) outside the scanner (see Materials and Methods and Fig.4a). First, we sought to rep-licate the results ofFayol and Thevenot (2012), who obtained a priming effect for addition but not for multiplication signs. In line with their results, planned comparisons confirmed that addition problems were solved faster when the operator was presented 150 ms before the problem (negative SOA trials) than when it was presented at the same time (null SOA trials) (968 vs. 988 ms;F1, 26= 9.02, P = 0.006), whereas no difference was
observed for multiplication problems (910 vs. 920 ms;F1, 26=
1.50, P= 0.23). Bayes Factor analysis indicated substantial evi-dence for an operator-priming effect with addition problems (BF10 = 7.37), but no evidence for an operator-priming effect
with multiplication problems (BF10 = 0.40). Second, for each
ROI, we calculated the interindividual correlation between the size of the operator-priming effect for addition problems and the magnitude of the fMRI response to addition sign-only trials. We found a significant correlation in the FEF (r = 0.53, P = 0.004), surviving Bonferroni correction for multiple compari-sons across all 3 ROIs (Pcorr= 0.024). Bayes Factor analysis
indi-cated substantial evidence for this correlation (BF10= 11.08). In
other words, subjects who show greater responses to“+” signs in the FEF are those who show larger operator-priming effects with addition problems (see Fig.4b). No such correlation was found between the size of the operator-priming effect for multi-plication problems and the magnitude of the fMRI response to
Table 2 Brain regions involved in the orienting of spatial attention that were more activated for addition than multiplication sign-only trials
Anatomical location Cluster size in mm3
(number of voxels)
MNI coordinates Z-score
X Y Z
R. Frontal Eye Field (6) 512 (32) 26 −4 50 4.03
R. Middle Occipital Gyrus 704 (44) 34 −84 26 3.52
R. Posterior Superior Parietal Lobule (7A) 624 (39) 24 −58 62 3.48
Note: L., left; R., right; cytoarchitectonic areas were found with SPM Anatomy toolbox (Eickhoff et al. 2005) and are shown in parenthesis.
Figure 3. Functional coupling between FEF and PSPL across subjects. Across-subject (n = 27) correlation between the FEF and the PSPL during addition sign-only trials (a) and multiplication sign-only trials (b). r represents the Pearson correlation coefficient.
addition sign-only trials in the FEF (r = 0.06, P = 0.76, Pcorr= 1;
see Fig.4c). Bayes Factor analysis also indicated no evidence for such a correlation (BF10= 0.25). Finally, there was no significant
(and anecdotal evidence for a) correlation between the operator-priming effect for addition problems and the fMRI response to multiplication sign-only trials in any ROIs (allrs < 0.33, allPs > 0.60, all BF10< 0.87).
Control Analyses
Our main analyses revealed differences in activity between the perception of a“+” sign and that of a “×” sign in the brain sys-tem for spatial orienting. However, it is important to ensure that thisfinding is not driven by any confounding factors. First, across all subjects, multiplication sign-plus-operand trials were solved faster than addition sign-plus-operand trials (1009 ver-sus 1075 ms;t26= 3.27, P = 0.003; BF10= 12.91). Therefore,
great-er ovgreat-erall difficulty for solving addition problems (as compared with solving multiplication problems) might have led partici-pants to engage more attentional resources when perceiving a“+” sign in comparison with a “×” sign, explaining differences in activity between the signs. To discard this hypothesis, we performed an additional analysis in which we included the mean RT difference between addition and multiplication sign-plus-operand trials as nuisance covariate. This analysis revealed that, over and above differences in RT between the 2 operations, the exact set of brain regions (FEF, PSPL, and MOG) that were activated in our main analyses was still signifi-cantly more activated for“+” than for “×” signs. Thus, differ-ences in activity between addition and multiplication sign-only trials do not appear to have been driven by differences in behavioral performance between addition and multiplication sign-plus-operand trials.
Second, even though participants were explicitly told to keep fixation throughout the entire experiment, it could be
argued that differences in activity between addition and multi-plication sign-only trials might have been driven by differences in the rate of eye movements associated with the perception of “+” and “×” signs (i.e., there could have been more eye move-ment in addition than multiplication sign-only trials). To test whether eye movements differed between those trials, we asked 15 new participants to perform a version of the fMRI task outside the scanner while their eye movements were recorded on-line (see Materials and Methods). We did notfind any differ-ence in the proportion of time spent atfixating the arithmetic sign between addition and multiplication sign-only trials (t14=
0.07, P= 0.95, BF10= 0.26), indicating that participants did not
make more eye movements in addition than multiplication sign-only trials. Therefore, greater activity in the FEF, PSPL, and MOG in addition than multiplication sign-only trials is not due to more eye movements when perceiving“+” than “×” signs.
Discussion
It has long been claimed that mathematical symbols may rely on spatial representations (Fischer and Shaki 2014). Much evi-dence for that claim comes from behavioral studies demon-strating interactions between space and the processing of Arabic digits (Dehaene et al. 1993;Fischer et al. 2003). However, studies have challenged this idea by showing that such interac-tions could be an artifact of the organization of information in working memory during task execution (van Dijck and Fias 2011;van Dijck et al. 2013). Here, we used fMRI to test whether the brain mechanisms for space contribute to the processing of fundamental arithmetic symbols, that is, operation signs, even when these signs are not associated with digits. We show that the mere perception of a“+” sign (compared with a “×” sign) triggers activity in several brain regions that also underlie the orienting of spatial attention. We further show that such activ-ity contributes to the operator-priming effect, whereby addition Figure 4. Brain-behavior correlation. (a) During the behavioral session, participants (n = 27) were asked to evaluate the result of single-digit addition and multiplica-tion problems. For both operamultiplica-tions, the arithmetic sign was presented either 150 ms before (negative SOA trials), or at the same time as the operands (null SOA trials). (b) Activity in the right FEF (R. FEF) in response to “+” signs as a function of the operator-priming effect calculated in the behavioral session for addition problems (b) and multiplication problems (c).r represents the Pearson correlation coefficient.
problem-solving is facilitated by the preview of a“+” sign. Our findings demonstrate that at least some arithmetic symbols evoke spatial intuitions in adults, and that such intuitions might play a role in arithmetic calculation.
The Mere Perception of a“+” Sign Recruits Several Brain Regions that Are Involved in the Orienting of Spatial Attention
Our mainfinding is that the mere presentation of a “+” sign eli-cits enhanced fMRI activity in 3 regions that support the orient-ing of spatial attention (as identified by an independent overt spatial attention task): the PSPL, the FEF, and the MOG. Because the PSPL and the FEF were found to be coupled with each other during the processing of a “+” sign across subjects, both of these regions are likely components of a functionally coherent network. This network is often thought to support the orienta-tion of covert and overt spatial attenorienta-tion (Corbetta et al. 1998;
Corbetta and Shulman 2002;Grosbras et al. 2005). For example, the FEF is a key region for the planning and execution of eye movements (Grosbras et al. 2005). Both the FEF and the PSPL have also been shown to be associated with covert shifts of attention (i.e., rapidly orienting attention without moving the eyes) and the updation of spatial information (Simon et al. 2002;Grosbras et al. 2005). In the present study, participants were explicitly told to keepfixation in the scanner and we did notfind additional eye movements during the perception of “+” than “×” signs in a control eye-tracking experiment (see Results). Thus, the recruitment of such a network in response to a“+” sign suggests that the perception of this sign may auto-matically deploy covert spatial attention.
It is interesting to speculate about the potential explana-tions for such a deployment. One possibility is that, with experience, educated adults might have associated “+” signs with the activation of a result that is necessarily larger than any of the operands (e.g., a form of plausibility check that can-not be used for multiplication problems, whose results can be smaller than or equal to an operand) (Marghetis et al. 2014). The rightward associations that large numbers have might thus cause automatic shifts of attention to the right side of space in adults. Another possibility is that calculating the result of an addition problem per se might involve moving rightward along the MNL, thereby increasing number size (McCrink et al. 2007). This is in keeping with the proposal that spatial updating mechanisms in the FEF and PSPL may be co-opted for arith-metic calculation (Knops et al. 2009a). For example, it has been shown that the pattern of activation in the PSPL during add-ition problem-solving is correlated to the pattern of activation during right saccadic movements, suggesting that subjects use the same neural mechanisms when moving their eyes to the right and adding numbers (Knops et al. 2009a). It is possible that these movements (which would be largely absent for multiplication problems because these are mostly learned by rote) might have been progressively associated with the add-ition sign itself with practice, and be triggered by the mere presentation of that sign in adults.
Spatial Intuitions Are Relevant for Simple Arithmetic Our results further indicate that activity related to a“+” sign in the spatial orienting network may be functionally relevant for simple addition problem-solving. That is, interindividual differ-ences of activity in the FEF were related to interindividual dif-ferences in the size of the operator-priming effect measured
outside the scanner. Thus, participants for whom the FEF responded the most to a “+” sign were the participants who benefited the most for having a “+” sign presented 150 ms before the operands. This might be because individuals who deploy their attention the most upon viewing a“+” sign may the most prepared for a rightward shift of attention that is rele-vant for either intuitively checking the plausibility of the result (which should be larger than any of the operands) (Marghetis et al. 2014) or calculating that results by moving to the right of the MNL (Mathieu et al. 2016). Although future studies might disentangle between these possibilities, this brain-behavior correlation demonstrates that a selective deployment of spatial attention in response to the arithmetic operator contributes to the operator-priming effect.
Our findings are also generally consistent with several recent studies showing interactions between arithmetic pro-cessing and spatial attention (Fischer and Shaki 2014;Masson and Pesenti 2014,2016;Mathieu et al. 2016). For example, we recently found evidence for rapid shifts of spatial attention dur-ing simple problem-solvdur-ing in adults. Specifically, we asked adults to solve single-digit addition and subtraction problems while each constituent was presented sequentially (Mathieu et al. 2016). Whereas thefirst operand and the arithmetic sign were presented at the center of the screen, the second operand was presented either on the left or the right visual field. Participants were faster to solve an addition problem when the second operand was presented in the right visualfield, whereas they were faster to solve a subtraction problem when the second operand was presented in the left visualfield. Such a result, along with several other consistent reports (Fischer and Shaki 2014;Masson and Pesenti 2014,2016), indicates that even very simple arithmetic problem-solving in adults may be asso-ciated with spatial intuitions.
It might be argued that the claim that spatial intuitions con-tribute to simple arithmetic is at odds with the consensual view that results of simple arithmetic problems (including add-ition) are typically not calculated but simply retrieved from memory in adults (Campbell and Xue 2001). We see at least 2 possible explanations for such an apparent inconsistency. First, as proposed byMarghetis et al. (2014), it is possible that spatial intuitions complement memory-based strategies by providing“an intuitive check on rote or algorithmic calculation, supplying a rough sense of expected magnitude against which the algorithmically derived solution can be compared” (p. 1591). According to this view, the fact that arithmetic is associated with spatial intuitions does not negate the fact that simple pro-blems may still be solved by retrieving results from long-term memory. Rather, it may provide a mechanism for limiting errors (e.g., when the result of an addition is smaller than the operands). Second, it is also possible that memory-based strat-egies are not as prevalent as typically thought, and in several cases supplanted by procedures that may be spatial in nature (Baroody 1983; Roussel et al. 2002; Fayol and Thevenot 2012;
Barrouillet and Thevenot 2013;Mathieu et al. 2016; Thevenot et al. 2016;Uittenhove et al. 2016). For example, although adults typically report retrieving results of most frequent addition pro-blems, the time it takes to solve these problems is not constant (as would be predicted by a systematic use of retrieval). Rather, it increases linearly with the distance between the original operand and the sum (e.g., adults take 20 ms longer to solve 1+ 3 than 1 + 2 or 1 + 4 than 1 + 3) (Groen and Parkman 1972;
Barrouillet and Thevenot 2013; Uittenhove et al. 2016). Therefore, it is possible that adults might unconsciously solve these problems by rapidly moving to the right of an MNL
(solving time would then depend on the distance between the original operand and the target sum to be reached) (Barrouillet and Thevenot 2013). Future studies are needed to test between these possibilities.
The“×” Sign as a Control Condition
In the present study, brain activity elicited by “+” signs was compared with that elicited by“×” signs. The “×” sign was cho-sen as a control condition because 1) it is not associated with any specific intuition as demonstrated by a lack of operator-priming effect inFayol and Thevenot (2012)and in the present study, 2) it is as familiar as a“+” sign, and 3) it is perceptually very similar to a“+” sign. Thus, we reasoned that such signs might act as excellent controls for the purpose of the present study. However, it could be argued that these symbols may dif-fer in terms of mathematical or nonmathematical meanings. This, rather than the idea that addition signs evoke spatial intuitions, may have driven the observed differences. For instance, although the “+” sign is relatively unambiguously associated with the concept of addition, the “×” sign may be used to describe the concept of multiplication but also the alphabetic letter“×” or the concept of “unknown” in algebra. We think that it is very unlikely that participants may have interpreted the “×” sign with such meanings in the present study for 2 reasons. First, our experiment was clearly not ambiguous concerning the potential meaning of the signs that were presented on the screen. Participants were explicitly told at the beginning that they will be presented with simple arith-metic problems along with aritharith-metic signs during the task. Sign-only trials were also intermixed with sign-plus-operand trials that clearly and unambiguously reinforced a context of addition and multiplication problem-solving. Second, no par-ticipant reported having interpreted the“×” sign as a letter or anything else than a multiplication sign after the fMRI session. This was supported by an exploratory whole-brain analysis in which we did notfind any more activity for “×” than “+” signs in brain regions that are involved in the visual recognition of letters such as the fusiform gyrus (McCandliss et al. 2003). Therefore, we believe that the perception of a “×” sign is an excellent control for the perception of a“+” sign in the context of the present study.
Relevance of the Current Findings to the Debate about the Link Between Mathematical Symbols and Space Overall, our results are in keeping with a long line of studies showing interactions between space and the processing of mathematical symbols (Fischer and Shaki 2014). However, most prior studies have demonstrated such interactions with Arabic digits, for example in the context of the SNARC effect (Dehaene et al. 1993; Fischer et al. 2003). It has been argued, however, that the SNARC effect may not provide definitive evidence that mathematical symbols rely on spatial representations. This is because the effect may be related to the spatial coding of num-bers in working memory during task execution rather than to a long-term organization of numbers along an MNL (van Dijck and Fias 2011;van Dijck et al. 2013). Ourfindings are relevant to this debate because, together with a previous behavioral study also showing associations between space and arithmetic signs (Pinhas et al. 2014), they demonstrate that associations between space and mathematical symbols can occur even in the absence of numerical information. This is more readily explained by positing that numbers may indeed be organized
from left to right along an MNL (such that arithmetic signs might prime shifts of attention along that MNL) than by a working-memory account. Of course, this does not mean in any way that the SNARC effect cannot be accounted for by a purely working-memory account. Rather, ourfindings may be more consistent with the proposal that “long-term memory associations between number and space exist independent of temporary associations or ordinal positions in working mem-ory” (Huber et al., p. 12).
Conclusion
To summarize, the present study shows that the simple per-ception of a“+” sign in adults triggers a specific response in several brain regions that are also involved in the orienting of spatial attention. We further demonstrate that this sign-related activity is linked to the operator-priming effect, whereby the preview of a “+” sign before a problem facilitates problem-solving. Thus, ourfindings not only show that some arithmetic signs evoke spatial intuitions in educated adults, but also that these intuitions relate to arithmetic performance. More gener-ally, our study lends support for the idea that mathematical symbols inherently evoke spatial representations. It is also con-sistent with the growing body of research showing associations between space and the processing of symbolic and nonsym-bolic magnitudes in a variety of tasks (Fischer and Shaki 2014). It has been suggested that such association may have an ancient evolutionary origin (Adachi 2014; Rugani et al. 2015) and might be intimately related to the ANS (Brannon and Merritt 2011). Future studies may thus explore to what extent these associations are related to measures of the ANS acuity in adults, and how they emerge over development and learning in children.
Supplementary Material
Supplementary material can be found atCerebral Cortex online.
Funding
European Commision (Marie-Curie Carreer Integration Grant no. PCIG12-GA-2012-333602 to J.P.); French Ministry of Higher Education and Research to R.M.
Notes
We thank the Hospices Civils de Lyon for sponsoring the research, as well as Flora Schwartz and the MRI technicians (Sylvaine Couderc and Philippe Combet) at the Lyon neuro-logical hospital for their assistance in collecting the fMRI data. Finally, we are grateful to Pr. Christian Scheiber for his help with the pre-MRI medical exams. Conflict of Interest: None declared.
References
Adachi I. 2014. Spontaneous spatial mapping of learned sequence in chimpanzees: evidence for a SNARC-like effect. PloS One. 9:e90373.
Ashburner J, Friston KJ. 2005. Unified segmentation. Neuroimage. 26:839–851.
Baroody AJ. 1983. The development of procedural knowledge: an alternative explanation for chronometric trends of men-tal arithmetic. Dev Rev. 3:225–230.
Barrouillet P, Thevenot C. 2013. On the problem-size effect in small additions: can we really discard any counting-based account? Cognition. 128:35–44.
Brannon EM, Merritt D. 2011. Evolutionary foundations of the approximate number system. In: Dehaene S, Brannon EM, editors. Space, time, and number in the brain: searching for the foundations of mathematical thought. 1st ed. London: Oxford University Press. p. 207–224.
Campbell JI, Xue Q. 2001. Cognitive arithmetic across cultures. J Exp Psychol Gen. 130:299–315.
Casey MB, Pezaris E, Nuttall RL. 1992. Spatial ability as a pre-dictor of math achievement: the importance of sex and handedness patterns. Neuropsychologia. 30:35–45.
Cheng Y-L, Mix KS. 2014. Spatial training improves children’s mathematics ability. J Cogn Dev. 15:2–11.
Corbetta M, Akbudak E, Conturo TE, Snyder AZ, Ollinger JM, Drury HA, Linenweber MR, Petersen SE, Raichle ME, Van Essen DC. 1998. A common network of functional areas for attention and eye movements. Neuron. 21:761–773.
Corbetta M, Shulman GL. 2002. Control of goal-directed and stimulus-driven attention in the brain. Nat Rev Neurosci. 3: 201–215.
Dehaene S, Bossini S, Giraux P. 1993. The mental representation of parity and number magnitude. J Exp Psychol Gen. 122: 371–396.
Dehaene S, Dehaene-Lambertz G, Cohen L. 1998. Abstract repre-sentations of numbers in the animal and human brain. Trends Neurosci. 21:355–361.
Dienes Z. 2011. Bayesian versus orthodox statistics: which side are you on? Perspect Psychol Sci. 6:274–290.
Dodd MD, Van der Stigchel S, Leghari MA, Fung G, Kingstone A. 2008. Attentional SNARC: there’s something special about numbers (let us count the ways). Cognition. 108:810–818. Eickhoff SB, Stephan KE, Mohlberg H, Grefkes C, Fink GR,
Amunts K, Zilles K. 2005. A new SPM toolbox for combining probabilistic cytoarchitectonic maps and functional imaging data. Neuroimage. 25:1325–1335.
Fayol M, Thevenot C. 2012. The use of procedural knowledge in simple addition and subtraction problems. Cognition. 123: 392–403.
Fias W, van Dijck J-P. 2016. The temporary nature of number— space interactions. Can J Exp Psychol. 70:33–40.
Fischer MH, Castel AD, Dodd MD, Pratt J. 2003. Perceiving num-bers causes spatial shifts of attention. Nat Neurosci. 6: 555–556.
Fischer MH, Shaki S. 2014. Spatial associations in numerical cognition—From single digits to arithmetic. Q J Exp Psychol. 67:1461–1483.
French JW, Ekstrom RB, Price LA. 1963. Kit of reference tests for cognitive factors. Princeton, NJ: Educational Testing. Gallistel CR, Gelman R. 1992. Preverbal and verbal counting and
computation. Cognition. 44:43–74.
Griffis JC, Elkhetali AS, Vaden RJ, Visscher KM. 2015. Distinct effects of trial-driven and task set-related control in primary visual cortex. Neuroimage. 120:285–297.
Groen GJ, Parkman JM. 1972. A chronometric analysis of simple addition. Psychol Rev. 79:329–343.
Grosbras MH, Laird AR, Paus T. 2005. Cortical regions involved in eye movements, shifts of attention, and gaze perception. Hum Brain Mapp. 25:140–154.
Hegarty M, Kozhevnikov M. 1999. Types of visual–spatial repre-sentations and mathematical problem solving. J Educ Psychol. 91:684–689.
Howell DC. 2011. Statistical methods for psychology. Belmont, CA: Wadsworth Cengage Learning.
Huber S, Klein E, Moeller K, Willmes K. 2016. Spatial–numerical and ordinal positional associations coexist in parallel. Front Psychol. 7:438.
Imbo I, Vandierendonck A, Rosseel Y. 2007. The influence of problem features and individual differences on strategic performance in simple arithmetic. Mem Cognit. 35:454–463. Jeffreys H. 1961. Theory of probability. 3rd ed. Oxford: Oxford
University Press.
Knops A, Thirion B, Hubbard EM, Michel V, Dehaene S. 2009a. Recruitment of an area involved in eye movements during mental arithmetic. Science. 324:1583–1585.
Knops A, Viarouge A, Dehaene S. 2009b. Dynamic representa-tions underlying symbolic and nonsymbolic calculation: evi-dence from the operational momentum effect. Atten Percept Psychophys. 71:803–821.
Kyttälä M, Lehto JE. 2008. Some factors underlying mathemat-ical performance: the role of visuospatial working memory and non-verbal intelligence. Eur J Psychol Educ. 23:77–94. Marghetis T, Núñez R, Bergen BK. 2014. Doing arithmetic by
hand: hand movements during exact arithmetic reveal sys-tematic, dynamic spatial processing. Q J Exp Psychol. 67: 1579–1596.
Masson N, Pesenti M, Dormal V. 2016. Impact of optokinetic stimulation on mental arithmetic. Psychol Res. doi:10.1007/ s00426-016-0784-z.
Masson N, Pesenti M. 2014. Attentional bias induced by solving simple and complex addition and subtraction problems. Q J Exp Psychol. 67:1514–1526.
Masson N, Pesenti M. 2016. Interference of lateralized distractors on arithmetic problem solving: a functional role for attention shifts in mental calculation. Psychol Res. 4:640–651.
Mathieu R, Gourjon A, Couderc A, Thevenot C, Prado J. 2016. Running the number line: rapid shifts of attention in single-digit arithmetic. Cognition. 146:229–239.
McCandliss BD, Cohen L, Dehaene S. 2003. The visual word form area: expertise for reading in the fusiform gyrus. Trends Cogn Sci. 7:293–299.
McCrink K, Dehaene S, Dehaene-Lambertz G. 2007. Moving along the number line: operational momentum in nonsym-bolic arithmetic. Percept Psychophys. 69:1324–1333.
Mix KS, Cheng Y-L. 2011. The relation between space and math: developmental and educational implications. Adv Child Dev Behav. 42:197–243.
Nieder A, Dehaene S. 2009. Representation of number in the brain. Annu Rev Neurosci. 32:185–208.
Orr JM, Weissman DH. 2009. Anterior cingulate cortex makes 2 contributions to minimizing distraction. Cereb Cortex. 19: 703–711.
Piazza M, Izard V, Pinel P, Le Bihan D, Dehaene S. 2004. Tuning curves for approximate numerosity in the human intrapar-ietal sulcus. Neuron. 44:547–555.
Pinhas M, Shaki S, Fischer MH. 2014. Heed the signs: Operation signs have spatial associations. Q J Exp Psychol. 67: 1527–1540.
Pinheiro-Chagas P, Dotan D, Piazza M, Dehaene S. 2017. Finger tracking reveals the covert stages of mental arithmetic. Open Mind.http://doi.org/10.1162/opmi_a_00003.
Ristic J, Wright A, Kingstone A. 2006. The number line effect reflects top-down control. Psychon Bull Rev. 13:862–868. Roussel J-L, Fayol M, Barrouillet P. 2002. Procedural vs. direct
retrieval strategies in arithmetic: a comparison between
additive and multiplicative problem solving. Eur J Cogn Psychol. 14:61–104.
Rugani R, Vallortigara G, Regolin L. 2015. At the root of the left– right asymmetries in spatial–numerical processing: from domestic chicks to human subjects. J Cogn Psychol. 27: 388–399.
Simon O, Mangin J-F, Cohen L, Le Bihan D, Dehaene S. 2002. Topographical layout of hand, eye, calculation, and language-related areas in the human parietal lobe. Neuron. 33:475–487.
Thevenot C, Barrouillet P, Castel C, Uittenhove K. 2016. Ten-year-old children strategies in mental addition: a counting model account. Cognition. 146:48–57.
Uittenhove K, Thevenot C, Barrouillet P. 2016. Fast automated counting procedures in addition problem solving: when are they used and why are they mistaken for retrieval? Cognition. 146:289–303.
van Dijck J-P, Abrahamse EL, Acar F, Ketels B, Fias W. 2014. A working memory account of the interaction between num-bers and spatial attention. Q J Exp Psychol. 67:1500–1513. van Dijck J-P, Abrahamse EL, Majerus S, Fias W. 2013. Spatial
attention interacts with serial-order retrieval from verbal working memory. Psychol Sci. 24:1854–1859.
van Dijck J-P, Fias W. 2011. A working memory account for spa-tial–numerical associations. Cognition. 119:114–119. Weissman DH, Gopalakrishnan A, Hazlett C, Woldorff M. 2005.
Dorsal anterior cingulate cortex resolves conflict from dis-tracting stimuli by boosting attention toward relevant events. Cereb Cortex. 15:229–237.
Wood G, Willmes K, Nuerk H-C, Fischer MH. 2008. On the cogni-tive link between space and number: a meta-analysis of the SNARC effect. Psychol Sci Q. 50:489.
Woodcock RW, McGrew K, Mather N. 2001. Woodcock-Johnson tests of achievement. Itasca, IL: Riverside Publishing.