• Aucun résultat trouvé

Dosimetry for radiobiology experiments at GANIL

N/A
N/A
Protected

Academic year: 2021

Partager "Dosimetry for radiobiology experiments at GANIL"

Copied!
9
0
0

Texte intégral

(1)

HAL Id: cea-01938057

https://hal-cea.archives-ouvertes.fr/cea-01938057

Submitted on 28 Nov 2018

HAL is a multi-disciplinary open access

archive for the deposit and dissemination of

sci-entific research documents, whether they are

pub-lished or not. The documents may come from

teaching and research institutions in France or

abroad, or from public or private research centers.

L’archive ouverte pluridisciplinaire HAL, est

destinée au dépôt et à la diffusion de documents

scientifiques de niveau recherche, publiés ou non,

émanant des établissements d’enseignement et de

recherche français ou étrangers, des laboratoires

publics ou privés.

Dosimetry for radiobiology experiments at GANIL

Florent Durantel, Emmanuel Balanzat, Amine Cassimi, François Chevalier,

Yvette Ngono-Ravache, Toiammou Madi, Jean-Christophe Poully, Jean-Marc

Ramillon, Hermann Rothard, Frédéric Ropars, et al.

To cite this version:

Florent Durantel, Emmanuel Balanzat, Amine Cassimi, François Chevalier, Yvette Ngono-Ravache, et

al.. Dosimetry for radiobiology experiments at GANIL. Nuclear Instruments and Methods in Physics

Research Section A: Accelerators, Spectrometers, Detectors and Associated Equipment, Elsevier, 2016,

816, pp.70 - 77. �10.1016/j.nima.2016.01.052�. �cea-01938057�

(2)

Dosimetry for radiobiology experiments at GANIL

Florent Durantel

a,n

, Emmanuel Balanzat

a

, Amine Cassimi

a

, François Chevalier

b

,

Yvette Ngono-Ravache

a

, Toiammou Madi

a

, Jean-Christophe Poully

a

, Jean-Marc Ramillon

a

,

Hermann Rothard

a

, Frédéric Ropars

a

, Lucas Schwob

a

, Isabelle Testard

c

,

Yannick Saintigny

b

a

CIMAP-GANIL, Caen, France b

CEA/DSV/LARIA, Caen, France c

CEA/DSV/CBM/iRTSV, Grenoble, France

a r t i c l e i n f o

Article history:

Received 30 October 2015 Received in revised form 14 January 2016 Accepted 18 January 2016 Available online 9 February 2016 Keywords:

High energy heavy ions Carbon hadrontherapy X-ray detector CR39

a b s t r a c t

Mainly encouraged by the increasing application of ion beams for cancer treatment (hadron-therapy) including carbon beams, the use of heavy ion facilities for radiobiology is expanding rapidly today. As an alternative to dedicated centers for treatment and medical research, accelerators like GANIL offer the possibility to undertake such experiments.

Since 20 years, CIMAP, reinforced 15 years ago by the biological host laboratory LARIA, has been receiving researchers in radiobiology and assisted them in performing experiments in differentfields such as hadron-therapy, space radioprotection and fundamental biological and physico-chemical mechanisms. We present here a short description of the beam line and the on-line equipments that allow the automatic irradiation of up to 24 biological samples at once.

We also developed an original on-line beam monitoring procedure for low ionflux (low dose rates) based on the measurement of the K-shell X-rays emitted from a thin iron foil. This detector is calibrated on an absolute scale before each experiment by counting etched tracks on an irradiated CR39 polymer plate. We present the performances and limits of this method andfinally give typical fluence (dose) uncertainties for a standard irradiation in radiobiology.

& 2016 Elsevier B.V. All rights reserved.

1. Introduction

The spectacular development of radiobiology during the last decades is largely due to advances in hadron-therapy and ther-apeutic hopes it raises in the treatment of cancers. Hadron-therapy is indeed an innovative technique based on the use of heavy ion beams or protons for tumor treatment in either replacement of or addition to widely practiced X-rays treatments.

Unlike X-rays, the energy deposition of the hadrons can reach a maximum and be very well localized in-depth. This ballistic exploitation and the resulting accuracy of the well known Bragg curve gives strength to this method, as it seems more appropriate to treat internal localized tumors in the vicinity to radiation-sensitive organs which would be considerably affected by the radiationfield of less localized energy deposition by X-rays[1].

Although the idea of using proton beams for radiotherapy has been suggested very early in the 1940s by Robert Wilson[2], thefirst real clinical treatment centers (exclusively for clinical applications)

were born in 1990 (LLUMC, Loma Linda University Medical Center). Their number is now increasing rapidly and expected to exceed 50 in 2015[3]with a result of 110,000 patients treated worldwide (85% in protons).

Heavy ions present both higher dose deposition capacities and better ballistic properties and in particular, carbon ions appear to have some significant clinical benefits[4]. Until a few years ago, carbon treatment centers were not numerous and mostly localized in two countries (HIMAC, HIBTM, NIRS in Japan and GSI in Germany).

But with the advent of new generations of low cost turnkey accelerators, dedicated to industrial use, treatment center projects are multiplying (CNAO, HIT, MEDAUSTRON, ARCHADE, only to mention Europe)[5]. Pending the construction of these new cen-ters, the demands of beam time for research purposes are increasingly important, which mainly explains the use of struc-tures originally designed for other applications. Thus, at GANIL (Grand Accélérateur National d’Ions Lourds, Caen, France) a quota of beam time is intended for interdisciplinary (i.e. non nuclear) research, including radiobiology. The laboratory CIMAP (Centre de recherche sur les Ions, les MAtériaux et la Photonique) undertakes Contents lists available atScienceDirect

journal homepage:www.elsevier.com/locate/nima

Nuclear Instruments and Methods in

Physics Research A

http://dx.doi.org/10.1016/j.nima.2016.01.052 0168-9002/& 2016 Elsevier B.V. All rights reserved.

nCorresponding author.

(3)

the interdisciplinary research at GANIL and manages, through its so called CIRIL1platform and together with the biology laboratory

LARIA (Laboratoire d'Accueil et de Recherche avec les Ions Accél-érés, CEA), the hosting of experiments in radiobiology[6].

The GANIL accelerator can provide various beams, from carbon to uranium, at maximum energies ranging from 95 MeV /A for light ions down to 24 MeV/A for uranium. This diversity allows expanding the activities to space radiation biology studies and the study of fundamental processes. On the other hand, cyclotrons supply only afixed energy2, but which can be reduced afterward

by beam degraders.

In Part 2 we describe the beam line and instruments that have been developed for radiobiology experiments. This adaptation of a physics machine to biological context with its specific constraints is reinforced by the presence of LARIA since 2003. Part 3 is dedicated to the monitoring of low beam intensities and the description of dosi-metry carried out for each experiment. The proposed method aims to be not only compatible with the specificities of a large nuclear phy-sics facility, but also to guarantee a good repeatability which is of a great interest for experiments sometimes spaced by more than a year. An evaluation of standard uncertainties will be given.

2. Beam line and equipments 2.1. Beam line

The radiobiology experiments take place in the D1 cave on the so called IRRABAT beam line, which is also the name of the diag-nostic and experiment vacuum chamber used in a standard way for high energy irradiations. At the end of the line, after crossing a stainless steel window of 25mm thickness, an automated sample holder of 24 positions is installed. It allows handling and proces-sing in a proces-single irradiation run a set of 4 lines with 6flasks each, in order to limit the number of time consuming access into the cave. Vertical and horizontal motions are controlled by two step-motors allowing a precise positioning of the samples in front of the beam. The optics of the line was adapted to focus the beam behind IRRABAT, just on the position of theflasks. The standard char-acteristics of the beam are the following ones3: a spotlight on the

target of 13 13 mm2size, a deflection angle (semi angle with the

medium beam axis) of 10 mrad in horizontal direction and 15 mrad in vertical direction, an emittance of 5 5

π

.mm.mrad and a resolution in energy

Δ

W/w of 0.007 (seeFigs. 1A and2).

With the help of two fast scanning magnets, the beam is swept horizontally at a frequency of 425.8 Hz and vertically at a fre-quency of 4.4 Hz. Both frequencies are chosen to avoid that one is a multiple of the other. In this way, no spatial structure (like Lissa-jous figure) is artificially created, which would damage the homogeneity of the dose deposition. The maximum reachable scanning surface is 60 60 mm2, allowing a maximal irradiation

field large enough for a 25 cm2flask. A couple of horizontal and

vertical slits delimit accurately the irradiationfield area. This data is used in the calculation of thefluence. Upstream of the line, a thin Ta foil can be inserted into the beam path in order to smooth and homogenize the beam spot, if needed.

At the beginning of each experiment the radiationfield defined by both the amplitude of scanning and the position of the slits (Fig. 1B), is visually controlled by irradiating (with a dose of usually around 8 Gy) a Gafchromic EBT2 typefilm, placed on a flask in the sample holder.

Until now, these films were only used for checking the size and position of the radiationfield, but it might be possible in the future to use them for an additional dosimetry by exploiting the optical density variations of thefilm. Some teams are working on this topic[7–9].

The precise beam spot position depends on each upstream beam tuning, so the zero beam position has to be adjusted by use of set of horizontal and vertical steerers. This zero position is placed out of the irradiation area (that is“in the slits”), where the scanning amplitude is zero. This allows, on the one hand, setting the reversal point of the sweeping out of the area to be irradiated, so as not to impair the homogeneity of the dose deposition, and, on the other hand, pro-tecting the sample in case of failure of the scanning magnets. 2.2. Biological side: LARIA facility

The radiation-biology research laboratory LARIA embedded at GANIL hosts experiments in biology thanks to a partnership with CIMAP. The biology platform operated by LARIA includes a com-prehensive tissues culture room, a molecular biology laboratory and a proteomic laboratory allowing hosted teams to perform various canonical assays in the radiation biology field. Furthermore, the platform may be adapted for special requirements if needed. The automatic biological sample holder may be used with 12.5 and 25 cm2flasks, tubes (0.5; 1.5; 2 and 15 ml), lab-tek™ chamber slide,

8 cm2culture dishes, 96-well plates (36 wells irradiated).

Fields of interest of platform users are either radiation protec-tion of space travelers (healthy tissues) or cancer treatment (tumors and surrounding healthy tissues). During the late 15 years, multiple ions were used with an emphasis on carbon ions. To date, 20 peer-reviewed articles of radiation biology were published with data obtained at GANIL on the IRRABAT beam line, as summarized in the table ofAnnex 1.

3. Dosimetry

3.1. Method and main results

The typical dose rates used during a radiobiology experiment are of the order of few Gy/min (equivalent in water), this implies, for a

12C beam of 75 MeV/A, fluxes of about 3 105 ions/(s cm2) which,

considering the typical radiationfields, corresponds to E107

ions/s. This intensity is far too low to be correctly measured and monitored by the standard methods applied at GANIL for non-biological sam-ples. The latter are based on current measurements for monitoring the beam intensity via Faraday cups, and the secondary electron emission of a thin metallic foil[10]. The alternative method devel-oped in the laboratory is based on the measurement of the emitted K-shell X-rays when the beam passes through a thin metallic foil.

Dosimetry, or calibration of this X-ray detector, is divided into two stages:

1. Calculation of the expected X-ray count rate. This step may be optional, since it does not belong to the calibration process itself, but it saves a considerable amount of time by adjusting immediately the different parameters of the detector to the right range offluence.

2. Calibration of the whole detector and acquisition chain by an absolute measurement of the fluence by means of a CR39 polymer sheet track-etched detector.

3.1.1. Set-up

A thin metallic (Fe) foil (from 5 up to 25mm thick and tilted with respect to the beam axis) is placed inside the IRRABAT chamber (item ‘a’ onFig. 3). A 25mm thick stainless steel exit window (item ‘b’ on

Fig. 3) 15 cm downstream, separates the high vacuum in the beam line

1

CIRIL: Centre Interdisciplinaire de Recherche avec des Ions Lourds;www. cimap.ensicaen.fr.

2The tuning of the cyclotrons to a new energy takes time on the experiment. It is generally an option which is not retained by the experimenters.

3

These values might slightly change from an experiment to another

(4)

from the ambient atmosphere in which the irradiated samples are placed. The K-shell ionization of the target atoms by the ion beam creates X-ray photons. The configuration is optimized to collect the K

α

photons. The photon energy spectrum is measured with a scintillator and Photo Multiplier (PM) set, placed 90° to the beam axis. The position of the detector can be varied and a diaphragm of variable diameter is placed in front of the scintillator window: in this way, the solid angle of X-ray detection can be adjusted. The scintillator is a classic NaI (Tl) crystal, 1 mm thick. Although developed in the 1940s

[11], this type of inorganic scintillators is still widely used nowadays. NaI(Tl) scintillators offer a good compromise between a high light yield ( about 4 104photons/MeV) and a decay time of 230 ns

com-patible with count rates for standard ion beam intensities used in

radiobiology. The low energy resolution (6.5% at 660 keV[12]) does not present a major drawback in simple counting operations. A charge preamplifier is placed close to the detector behind the PM. The signal is then transferred to the control/acquisition room.

3.1.2. Acquisition chain

From the charge preamplifier, the signal is injected into a shaper amplifier and then “windowed” by a Single Channel Analyzer (SCA) (Fig. 4). The upper and lower levels of the SCA are controlled by dis-playing the energy spectrum of the signal by means of a Multiple Channel Analyzer (MCA). This level adjustment allows suppressing the electronic noise on the one hand and the tail-end of energy distribu-tion that may not correspond to the expected K-lines, on the other.

The counting noise can be estimated straight after irradiation in the range of 5–10 counts/s – for a standard irradiation at 6  105ions/

(s cm2). These values take into account both the electronic noise of

the acquisition and the activation of the line, whose radioactive decay is fast. The upper limit of the counting rate is limited to about 6000 counts/s, since beyond this level, some signal pile-up starts to be observed. Therefore, the best working conditions are usually found close to about 3000 counts/s.

The irradiation procedure is fully conducted via dedicated com-puter software. Input parameters, provided by the user are the beam parameters, the irradiated surface and the set pointfluence

Φ

:

Φ

¼ kUNxCx

Sirr ð1Þ

where k is the inverse of the ion charge (in C1), Nxis the X-ray

counting, Cxis the calibration constant (C/X) and Sirrthe irradiation

surface (in cm²) calculated knowing the position of the slits. Flux monitoring is done by measuring thefluence change,

ΔΦ

, atfixed time intervals,

Δ

t:

φ

¼

ΔΦ

=

Δ

t ð2Þ

It should be noticed that the measurement chain is calibrated influence. From the biological side, according to the recommen-dations of the SI, the clinical requirements and established prac-tices, dose results should be reported in Gray [13]. The dose deposited on a given layer of material of density

ρ

can be calcu-lated from thefluence as follows:

D Gy½  ¼ 1:610 9dE

dx keV=

μ

m


Φ

cm 21

ρ

cm3=g ð3Þ Fig. 1. (A) D1 Beam line and IRRABAT– (a) fast scanning magnets; (b) steerers; (c) H and V slits; (d) X-ray detector; (e) sample holder position. (B) Zero position of the beam with respect to the slits position during the beam scanning.

Fig. 2. IRRABAT: (A) Sample Holder 24 positions. (B) PM detector and preamplifier.

Fig. 3. IRRABAT chamber and X detector.

G&D MCA

Counter

PC : Energy spectrum

SCA window control

SCA Delay G G&D MCA Counter From CPA PC : fluence measuring SCA Delay G

Fig. 4. X detector signal processing. The coincidence circuit allows adjusting the SCA window in order to limit the noise of X-ray signal.

(5)

where dE/dx is the mean linear energy loss of the ion in the layer and can be assimilated to the linear energy transfer LET, which is the energy received by the material[14]. The passage from“dose” to“fluence” requires knowing the LET. The information provided by the accelerator to the users is the ion beam energy at the entrance of the biological system. With this information and depending on the nature of their samples, users can calculate the appropriate LET. Without further information on the studied bio-logical system, a LET value based on a water model and extracted from a SRIM calculation[15]is provided for information purpose. However, this value is not required for the calibration procedure. As an example,Annex 1illustrates the targetfluence to be reached for a desired dose, with liquid water hypothesis (

ρ

¼1 g/cm3).

3.1.3. CR39 Calibration

CR39, Polyallyl diglycol carbonate, C12H18O7, is a rigid polymer

with excellent surface qualities, even after etching, and is widely used as a track detector[1618]. Above a threshold in LET, around 5 keV/microns[19–21], a charged particle that passes through the sheet forms a latent track in the polymer. The individual counting of each track becomes possible after a controlled chemical etching process that progressively enlarges the tracks from nanometers up to micrometers. In the present case, we use a 12N KOH solution in which the material is immersed for about 12 min at 80°C. These very severe conditions, compared to the ones generally used for track etching in polymers, are the result of a compromise concerning the devoted time: the need of obtaining a good track quality for an optimal counting versus minimizing time for dosimetry. This fast etching is acceptable as long as no further analysis such as influence of LET orfine particle discrimination is carried out.

The X-ray chain is calibrated for each new experiment, or every time the X-ray production yield may change (different projectile and/or energy). For each calibration, three CR39films are irradiated at targetfluences

Φ

tof 106, 2 106, and 3 106ions/cm2. These target

fluences are measured by the X-ray chain using a theoretical cali-bration constant, Cxtheo, calculated as explained below. The

com-parison between the targetfluences and the corresponding fluences

Φ

CR39measured on the CR39 plates allows correcting the calibration

constant by a factor fc. fc¼

Φ

CR39=

Φ

twith

Φ

CR39¼ NCR39=Smicroand

Φ

t¼ kCxtheoNx=Sirrhence, the calibratedfluence can be expressed as:

Φ

¼kCxtheo

Sirr

ϕ

t

Nx

Φ

CR39 ð4Þ

The track counting is performed with a 1000 magnification optical microscope (10 camera focus and  100 oil immersed objective), in a precisely calibratedfield, thereby allowing direct determination offluence. The choice of these fluences also results in a compromise: With a 1000 magnification the appropriate size of tracks isE2 mm; below 106ions/cm2the tracks are too rare

and thus the statistical uncertainties are high. At the opposite, above 3 106ions/cm2, the track overlapping begins to be

notice-able and affects the accuracy of the counting.

The main drawback of our approach (X-ray monitoring and CR39 calibration) is a relatively limited dynamics in terms of dose rate. For ensuring an acceptable homogeneity of the field, the minimum exposure time isE30 s which corresponds to a couple of hundred vertical passages of the beam on the frame. The maximumflux for the CR39 calibration is then 1 105cm2s1(3

106cm2in 30 s), hence for C beams at 75 MeV/A, the maximum

dose rate useful for calibration isE0.2 Gy min1.

During an experiment, because of the limited counting dynamics of the X-ray chain (50oNxo6000 counts/s), the ratio

between maximum and minimum dose rate achievable is in the same proportion i.e.

φ

max/

φ

minE120. The solid angle for the X-ray

detection is tuned for each calibration in order to adapt the counting rate at the expected mean dose rate. Thus, taking the

higher calibration points as the lower limit of the dose rate range leads to an upper limit of E10 Gy min1. Obviously, the higher

the LET, the higher the maximum dose rate. Applying our approach to higher dose rates, would imply increasing the cali-bration range by increasing the fluence on the CR39 plates and hence observing much smaller tracks. This would require different analyzing capacities much more powerful than a simple optical microscope (AFM type for instance), which are hardly compatible with quick routine calibration procedures, as needed here[22].

The pros of this method are: simplicity, relatively low cost and possibility of performing an absolute dosimetry by means of both an exhaustive counting and a selective one:

– The track geometry (with completely different angles, for instance) allows to exclude the particles not linked to the beam[23]. – Under 100 MeV/A for a carbon beam, and considering the thin

layer of crossed material (1.5 mm) we assume the fragmentation of the projectile to be negligible. This is probably not the case with a degraded beam and it would be interesting to probe to what extend this discrimination is possible in these conditions[24–26]. – In any case, a SRIM calculation shows that light particles like protons or

α

particles should not be recorded in CR-39 as their stopping power (E1 keV/mm) is lower than the polycarbonate threshold.

3.1.4. Results and measurement uncertainties

The calibration method described above allows to eliminate numerous systematic errors which could be caused by the elec-tronic gain of the chain, solid angles, irradiation surface and the-oretical constant Cx. The precision of this correction depends on

the fluence measurement accuracy with the CR39. The first important remaining error therefore stems from the estimation of the surface of the CR39 picture provided by the microscope, since the direct calculation of fluence by track counting strongly depends on this parameter. A precise measurement of this observationfield reduces this error down to 1% per dimension.

The second, and principal, source of error can be attributed to the statistical uncertainty on track counts. The corresponding counting value for eachfluence to be calibrated is the average of the number of counts on a statistical sample of 10 pictures randomly distributed over the entire CR39film. This number of ten pictures has been arbitrary chosen in order to reduce the standard deviation on the mean counting values and minimize the duration of the calibration step. Considering a posteriori a very large collection of pictures sample, we can estimate a confidence interval at 2, 4 or 6 sigmas of the average of the counting of 10 images, as illustrated inTable 1. The results of about 5% for 2-sigma uncertainties do not reach the precision of primary standards like calorimeters (which are complicated to implement), but they are consistent and compatible with the results published in recent years forfluence based methods and standards for flat ioniza-tion chambers designed for scanned heavy ion beams[27,28].

Another irradiation of CR39 performed at the end of experiments for control purposes does not show a deviation larger than 3% from the initial calibration. It thus allows saying that no significant drift of the X-ray acquisition chain is observed during the run.

Regarding random uncertainties, Eq.(4)shows in turn that the uncertainties in the measurement offluence depend on the X-ray counting Nx. The noise on the counting rate as mentioned before is

at most 10 cts/s, leading to a ratio of 0.5% for a standard func-tioning of the acquisition chain around 2000–3000 cps/s. It can be noted, however, that part of this mean value of the counting noise is already taken into account in the CR 39 calibration at lowflux.

(6)

3.2. Further details in description and analysis 3.2.1. Estimation of X-count-rate

The theoretical constant Cxtheo depends on the solid angle of

detection

Ω

and the number of X-rays created per incident ion, nxi:

Cxtheo¼

k

nxi

Ω

ð5Þ

For simplifying the estimation of Cxtheo, the solid angle is

cru-dely estimated assuming a equivalent X-ray source in the center of the radiationfield. Thus, the number of X-rays created during the passage of an ion through a metallic sheet of thickness d tilted at the angle

θ

¼π2

φ

from the beam axis is given by:

nxi¼

σ

UN U tan

φ

1expð

μ

d tan

φ

Þ


UT UTBe ð6Þ

with:

σ

¼

σ

iUYf luoðKαÞ ð7Þ

being the product of the K-shell ionization cross section,

σ

i, and the

fluorescence yield Yfluofor the Kαlines[29]. T and TBeare the

trans-mission coefficients for the kaptonTMand beryllium windows (see on

Fig. 3) respectively. N is the number of atoms per unit volume of the target (in m3),

μ

(in cm-1) is the attenuation coefficient of the target.

At the energies provided by the accelerator, the energy loss in the ion-matter interaction process is dominated by inelastic col-lisions with the target electrons, see for example[30].

A simple model for the calculation of the K-shell ionization cross section is given by the Binary Encounter Approximation (BEA)[31–33]. The BEA hypothesis assumes that ionization is fully due to a classical binary interaction between the charged projectile and the target electron via an electric coulomb potential. The target nucleus and the remaining electrons are supposed to play no other role than just providing the initial momentum distribution and the binding energy Ik

of the ejected electron. In this context, Gryzinski suggested a formula for the K-shell ionization cross-section given by Eq.(8) [34]:

σ

σ

0

Z2p

I2k

GðVÞ ð8Þ

with

σ

π

e4¼ 6.56  1014cm2eV2

The scaling law G(V) is a function of a dimensionless value V¼vi

ve, the ratio between the velocity of the ion and the orbital

velocity of the electron. It allows calculating the ionization cross section for charged projectiles of any energy. The electronic velo-city can be calculated with the assumption that the kinetic energy is equal to the binding energy of the electron in the orbit k. For V40.2 the G function takes the form of Eq.(9):

GðxÞ ¼ f 1þxx22þ 2 3ð1þuÞlnð2:7þxÞ   ð1uÞð1u1þ x2 Þ; x40:2 ð9Þ With u¼ ð4xð1þxÞÞ 1and f¼1 x2 x2 1þ x2  3=2

G reaches a maximum when x¼1, i.e. when the ion and elec-tron velocities are similar. At lower velocities, xo0.2, the influence of the averagefield of the targets atom cannot be neglected any-more, and Eq.(8)does notfit the data[35].

The effective charge Zptakes into account the interplay of the

projectile ionization and capture processes. It must be considered, especially at low velocities, and can be described by the empirical relation[36]:

Zp¼ Zp 1expð125

β

Zp 2=3Þ

h i

ð10Þ where Zpis the particle charge and

β

¼v/c is the relativistic

velo-city factor.

The success of the method lies in its simplicity of imple-mentation (simple calculations), in its wide generality and the fact that it gives, at least at high velocities, the same results as other models like Plane Wave Born Approximation (PWBA) or perturbed stationary state theory with energy loss, Coulomb correction and relativistic effects (ECPSSR).

Fig. 5 shows the differences between the calculated constant and the CR39 measured during the last 8 years, for various beams and energies. It is remarkable that despite the many approxima-tions made, this simple model nevertheless correctly estimates the X production rate to less than 15% errors on average.

3.2.2. Dose distribution

As mentioned above, part of the dose distribution uncertainty stems directly from the statistical dose deposition process itself. Although theflux monitoring by X-rays does not allow to obtain geometric information on the homogeneity of the projectile dis-tribution, it is nevertheless possible to analyze“a posteriori” the CR39films used for the dosimetry, in a restricted range of fluence. In localized areas of thefilm, taking into account a collection of small surfaces of the order of fewmm2, an excellent agreement

with a Poisson distribution is observed, as illustrated inFig. 6. On the basis of the results shown inFig. 6, assuming a Poisson distribution, it is then possible to evaluate the probability that a cell's nucleus is effectively hit by an ion, or not hit at all–which is even more interesting in the statistical process of the experiment, as the bias induced by a non irradiated cell is bigger. These cal-culations are summarized in Table 2 for different nucleus dia-meters. It can be observed that in standard conditions offluence at 5.107ions/cm2(of the order of 1 to 2 Gy for LET typical of high

energy C beams), one can consider with a quasi certainty that all cells are affected, whatever the supposed size of the nuclei.

It is also interesting to observe that this local impact distribu-tion is fully confirmed at larger scale over the whole surface of the CR39film. As shown infig. 7for a13C beam, a mono-modality and

normal distribution are very well fitted to the data, their para-meters being consistent with the local Poisson distribution.

We can also seek to extract a possible deterministic behavior overlaid on the supposed random distribution. To this purpose, a set of longitudinal cross-sections of CR39 films has been made, with a picture taken in steps of 0.5 mm. We thus obtain a random signal over the entire length of the CR39film.

The results of auto correlation and its Fourier transform, the power spectral density can then be compared to a Gaussian white noise equivalent (GWNE), generated by the Scilab software[37], of the same energy as the signal. As presented inFig. 8, with a13C

Table 1

Typical uncertainties on the mean value of a set of 10 shots. The randon variable X is the number of impacts counted in a picture. Standard deviationσ, Mean value E and confidence interval C.I

r.v. X sample: Average of 10 shots fluence: 3  106ions/cm²

σ(X)sample Ε(X)sample C.I. (69%) C.I. (95%) C.I. (99%) Δ(X)/X (2σ) Δ(X)/X (4σ) Δ(X)/X (6σ)

36Ar (95 A.MeV) 7.39 114.6 9.66 12.69 5.91 0.052 0.084 0.111

58Ni (75 A.MeV) 7.68 131.75 10.04 13.18 6.14 0.047 0.076 0.100

13

(7)

beam, both signal and GWNE are very similar. The amplitude of the frequency peaks are of the same order of magnitude and no parti-cular peak, signature of a deterministic signal, can be isolated in the spectrum. If there is any additional signal, it is not of sufficient energy to be extracted from our Gaussian white noise signal.

4. Conclusion

While waiting for the construction of new treatment and research centers in carbon hadron-therapy, the GANIL accelerator and the CIMAP and LARIA laboratories offer the possibility for the radio biology community to perform experiments. The facility has been presented: beams, irradiation procedures and available experimental

1E-16 1E-15 1E-14 1E-13

1E-16 1E-15 1E-14 1E-13

13C O Ne Ar Ni Pb 12C Ccr39 Cxtheo

Fig. 5. CR39 calibration constant as function of theoretical constant.

Fig. 6. Local distribution for a representative set of 154 samples of 33.2mm2 . Comparison to the corresponding Poisson distribution. Beam:13

C at 75 MeV/A, fluence: 3 106ions/cm2.

Table 2

Impact probability P(N) for different nuclei sizes (dim) andfluences. εo1015 mean N is the mean value of a Poisson distribution.

Fluence (ions/cm2) Dim (lm) Mean N P(N¼0) P(N¼1) P(N41) 106 5 0.25 0.779 0.195 0.026 10 1 0.368 0.368 0.264 15 2.25 0.105 0.237 0.657 20 4 0.018 0.073 0.908 3.106 5 0.75 0.472 0.354 0.173 10 3 0.05 0.149 0.801 15 6.75 0.001 0.008 0.991 20 12 6.14 106 7.37 105 0.99992 107 5 2.5 0.082 0.205 0.713 10 10 4.54 105 4.54 104 1ε 15 22.5 1.69 1010 3.80 109 1ε 20 40 o1015 o1015 1ε 5.107 5 12.5 3.76 106 4.65 105 0.9999 10 50 o1015 o1015 1ε 15 112.5 o1015 o1015 1ε 20 200 o1015 o1015 1ε

Fig. 7. Large scale distribution for a representative set of 127 samples of 60 80 mm2

. Beam:13

C at 75 MeV/A,fluence: 3 106ions/cm². Comparison to the corresponding Normal distribution: Pearson's khi-square test (with a degree of freedom of 5) shows a very good adjustment at any significant level α up to 0.95.

Fig. 8. Longitudinal CR39 signal and the corresponding Gaussian White Noise equivalent. 13C at 75 MeV/A,fluence:3 106

ions/cm2 .

(8)

Annex 1

Ion beams used on the biology platform the last 20 years, and citations. Ions Energy

(MeV/n)

Beam LET (keV/ lm)

Dose rate (Gy/min)

Doses (Gy) Corresponding targetfluence (water equivalent) (106ions/cm²)

Models Endpoints Citations

12C 95 Native 25.4 1–2 0.5–8 12.3–197 2D human cells (primary &

tumor)

Survival Proliferation Proteomics Oxydative stress Histology

n/a 3D human cells

(primary & tumor)

12 C 95 PMMA (6.9 mm)* 34.23** 1–2 0.5–8 9.13–146 12 C 95 PMMA (13.9 mm)* 50.51** 1–2 1–8 12.4–99

2D human cells (immortalized & tumor)

Colony Forming Efficiency Oxydative stress Viability n/a

12 C 95 PMMA (16.9 mm)* 77.26** 1–2 1–8 8.09–64.7 n/a 12 C 95 PMMA (17.9 mm)* 108.55** 1–2 1–8 5.76–46.1 n/a 12

C 75 Native 33.21 1–2 0.5–6 9.41–113 2D human cells (primary &

tumor)

Survival Proliferation Proteomics Oxydative stress Histology

[38]

3D human cells (primary & tumor)

13

C 75 Native 33.34 1–2 0.5–20 9.37–375 2D human cells (primary &

tumor)

Survival Proliferation Apoptosis Proteomics Oxydative stress Histology DNA repair Chromosomes breaks Genomics

[38–55]

2D human cells (immortalized)

3D human cells (primary & tumor)

13

C 75 PMMA

(6.9 mm)

50.51 1–2 0.5–6 6.19–74.2 2D human cells (primary & tumor)

Survival Proliferation Proteomics Oxydative stress Histology

n/a 3D human cells (primary &

tumor)

18

O 50 Native 85.1 1–2 1–6 7.34–44.1 2D human cells (immortalized

& tumor)

Colony Forming Efficiency Viability n/a

20Ne 95 Native 77.7 1–2 1–6 8.04–48.3 [49]

22

Ne 75 Native 95.5 1–2 1–20 6.54–131 2D human cells (primary &

tumor)

Survival Proliferation Proteomics Oxydative stress Histology

[39]

2D human cells (immortalized)

3D human cells (primary & tumor)

22Ne 80 Native 91.2 1 1–20 6.85–137 2D human cells

(immortalized)

Survival Cell cycle Histology [39,52] 36 Ar 95 Native 271.5 1 1–20 2.3–46 [39,49,56] 58 Ni 75 Native 905.9 1 1–20 0.69–13.8 [39,52] 206 Pb 29 Native 9674.0 1 1–20 0.06–1.29 [39] *

France-Hadron. Data from LPC Caen.

**LET measurements courtesy of Guillaume Boissonnat, LPC Caen.

F. Dur antel et al. / Nuclear Instruments and Methods in Physics Resear ch A 8 1 6 (20 1 6 ) 7 0– 77

(9)

devices and set up. The method of lowflux beam monitoring based on X-ray measurements, and its calibration by track etched CR39 detectors has been described. Total typical errors and uncertainties are given to be less than 8% at 2

σ

. A description of the theoreticalflux calculation has been given. Finally, a CR39 analysis shows that in standard irradiation conditions, the scanned beam behaves like an excellent Gaussian white noise.

Annex 1 SeeTable A1

References

[1]D. Schardt, T. Elsässer, D. Schulz-Ertner, Reviews of Modern Physics 82 (1) (2010) 383.

[2]R.R. Wilson, Radiology 47 (5) (1946) 487.

[3] NuPECC, Nuclear Physics in Medicine– Hadron-therapy, NuPECC Report, ESF. NuPECC Report, ESF, 2013.

[4]H. Tsujii, T. Kamada, Japanese Journal of Clinical Oncology 42 (8) (2012) 670. [5]H. Eickhoff, U. Linz, Reviews of Accelerator Science and Technology 01 (01)

(2008) 143.

[6]A. Domaracka, C. Grygiel, A. Méry, S. Bouffard, A. Cassimi, Journal of Physics: Conference Series 629 (2015) 011001.

[7]C. Le Deroff, M. Cherel, A. Guertin, F. Haddad, C. Koumeir, V. Métivier, N. Michel, F. Poirier, N. Servagent, L. Schwob, N. Varmenot, Radiation Protec-tion Dosimetry 161 (1–4) (2014) 428.

[8]M. Martišíková, B. Ackermann, S. Klemm, O. Jäkel, Nuclear Instruments and Methods in Physics Research Section A: Accelerators, Spectrometers, Detectors and Associated Equipment 591 (1) (2008) 171.

[9]V. Casanova Borca, M. Pasquino, G. Russo, P. Grosso, D. Cante, P. Sciacero, G. Girelli, M.R. La Porta, S. Tofani, Journal of Applied Clinical Medical Physics 14 (2) (2013) 4111.

[10]S. Bouffard, J. Dural, F. Levesque, J.M. Ramillon, Annales de Physique (1989) 395.

[11]R. Hofstadter, Physical Review 75 (5) (1949) 796.

[12]G.F. Knoll, Radiation Detection and Measurement, John Wiley & Sons, 2010. [13]T. Kamada, H. Tsujii, E.A. Blakely, J. Debus, W. De Neve, M. Durante, O. Jäkel,

R. Mayer, R. Orecchia, R. Pötter, S. Vatnitsky, W.T. Chu, The Lancet Oncology 16 (2) (2015) e93.

[14] P.D.J. Kiefer, Deposition of Radiation Energy, in: Biological Radiation Effects, Springer, Berlin Heidelberg, 1990, pp. 55–87.

[15] J. Ziegler, ‘SRIM : http://www.srim.org’, 2008. [Online]. Available: 〈http:// www.srim.org/〉. (accessed: 17.09.15).

[16]B.G. Cartwright, E.K. Shirk, P.B. Price, Nuclear Instruments and Methods 153 (2–3) (1978) 457.

[17]R.M. Cassou, E.V. Benton, Nuclear Track Detection 2 (3) (1978) 173. [18]I. Bailly, C. Champion, P. Massiot, P. Savarin, J.L. Poncy, S. Crespin, G. Alloy,

V. Jacob, E. Petibon, Nuclear Instruments and Methods in Physics Research Section B: Beam Interactions with Materials and Atoms 187 (1) (2002) 137. [19]R.L. Fleischer, P.B. Price, R.M. Walker, Nuclear Tracks in Solids: Principles and

Applications, University of California Press, 1975.

[20]S. Kodaira, N. Yasuda, H. Kawashima, M. Kurano, S. Naka, S. Ota, Y. Ideguchi, N. Hasebe, K. Ogura, Radiation Measurements 46 (12) (2011) 1782. [21]D. Zhou, CR-39 Plastic Nuclear Track Detectors in Physics Research, Nova

Science Publishers, Hauppauge, N.Y, 2012.

[22]M. Yamamoto, N. Yasuda, M. Kurano, T. Kanai, A. Furukawa, N. Ishigure, K. Ogura, Nucl. Instrum. Methods Phys. Res. Sect. B Beam Interact. Mater. At 152 (2–3) (1999) 349.

[23] H. Kozima, Characteristics of Solid-State Nuclear Track Detectors for Heavy Charged Particles– A Review, Proceedings of JCF13, Nagoya, Japan, 08-Dec-2013.

[24] A.N. Golovchenko, J. Skvarc, R. Ilić, L. Sihver, V.P. Bamblevski, S.P. Tretyakova, D. Schardt, R.K. Tripathi, J.W. Wilson, R. Bimbot, Nuclear Instruments and Methods in Physics Research Section B: Beam Interactions with Materials and Atoms, 159, (1999) 233.

[25] S. Cecchini, T. Chiarusi, G. Giacomelli, M. Giorgini, A. Kumar, G. Mandrioli, S. Manzoor, A.R. Margiotta, E. Medinaceli, L. Patrizii, V. Popa, I.E. Qureshi, G. Sirri, M. Spurio, V. Togo, Nuclear Physics A 807 (3–4) (2008) 206. [26] M. Giorgini, Nuclear Physics B 197 (1) (2009) 66.

[27] C.P. Karger, O. Jäkel, H. Palmans, T. Kanai, Phys. Med. Biol. 55 (21) (2010) R193. [28] A. Fukumura, T. Hiraoka, K. Omata, M. Takeshita, K. Kawachi, T. Kanai, N. Matsufuji, H. Tomura, Y. Futami, Y. Kaizuka, G.H. Hartmann, Phys. Med. Biol. 43 (12) (1998) 3459.

[29] V.O. Kostroun, M.H. Chen, B. Crasemann, Physical Review A 3 (2) (1971) 533. [30] P. Sigmund, Particle penetration and radiation effects general aspects and

stopping of swift point charges, Springer, Berlin; New York, 2008. [31]E. Gerjuoy, Physical Review 148 (1) (1966) 54.

[32] J.D. Garcia, Physical Review A 1 (2) (1970) 280.

[33] J.H. McGuire, P. Richard, Physical Review A 8 (3) (1973) 1374. [34] M. Gryziński, Physical Review 138 (2A) (1965) A336.

[35] I.D. Kaganovich, E. Startsev, R.C. Davidson, New Journal of Physics 8 (11) (2006) 278.

[36] W.H. Barkas, Nuclear Research Emulsions, Academic Press, New York, 1963. [37] scilab,‘Scilab : http://www.scilab.org/’, 2013. [Online]. Available:〈http://www.

scilab.org/en〉. (accessed: 17.09.15).

[38] C.E. Hellweg, C. Baumstark-Khan, C. Schmitz, P. Lau, M.M. Meier, I. Testard, T. Berger, G. Reitz, Radiation Research 175 (4) (2011) 424.

[39] C.E. Hellweg, C. Baumstark-Khan, C. Schmitz, P. Lau, M.M. Meier, I. Testard, T. Berger, G. Reitz, International Journal of Radiation Biology 87 (9) (2011) 954. [40] C. Laurent, A. Leduc, I. Pottier, V. Prévost, F. Sichel, J.-L. Lefaix, PLoS ONE 8 (12)

(2013) e85158.

[41]M. Hanot, A. Boivin, C. Malésys, M. Beuve, A. Colliaux, N. Foray, T. Douki, D. Ardail, C. Rodriguez-Lafrasse, PLoS ONE 7 (11) (2012) e44367.

[42] M. Maalouf, G. Alphonse, A. Colliaux, M. Beuve, S. Trajkovic-Bodennec, P. Battiston-Montagne, I. Testard, O. Chapet, M. Bajard, G. Taucher-Scholz, C. Fournier, C. Rodriguez-Lafrasse, International Journal of Radiation Oncology 74 (1) (2009) 200.

[43] M. Beuve, G. Alphonse, M. Maalouf, A. Colliaux, P. Battiston-Montagne, P. Jalade, E. Balanzat, A. Demeyer, M. Bajard, C. Rodriguez-Lafrasse, Interna-tional Journal of Radiation Oncology 71 (2) (2008) 635.

[44]D. Boucher, I. Testard, D. Averbeck, Radiation and Environmental Biophysics 45 (4) (2006) 267.

[45] I. Testard, B. Dutrillaux, L. Sabatier, International Journal of Radiation Biology 72 (4) (1997) 423.

[46] I. Testard, M. Ricoul, F. Hoffschir, A. Flury-Herard, B. Dutrillaux, B. Fedorenko, V. Gerasimenko, L. Sabatier, International Journal of Radiation Biology 70 (4) (1996) 403.

[47]I. Testard, L. Sabatier, Mutation Research 430 (2) (1999) 315.

[48] J.-P. Pouget, S. Frelon, J.-L. Ravanat, I. Testard, F. Odin, J. Cadet, Radiation Research 157 (5) (2002) 589.

[49] T. Douki, J.-L. Ravanat, J.-P. Pouget, I. Testard, J. Cadet, International Journal of Radiation Biology 82 (2) (2006) 119.

[50] G. Bertrand, M. Maalouf, A. Boivin, P. Battiston-Montagne, M. Beuve, A. Levy, P. Jalade, C. Fournier, D. Ardail, N. Magné, G. Alphonse, C. Rodriguez-Lafrasse, Stem Cell Reviews and Reports 10 (1) (2014) 114.

[51]A. Suetens, M. Moreels, R. Quintens, S. Chiriotti, K. Tabury, A. Michaux, V. Grégoire, S. Baatout, International Journal of Oncology 44 (4) (2014) 1056. [52] A.A. Chishti, C.E. Hellweg, T. Berger, C. Baumstark-Khan, S. Feles, T. Kätzel,

G. Reitz, Life Sciences in Space Research 4 (2015) 35.

[53] A. Calipel, A. Lux, S. Guérin, J.-L. Lefaix, C. Laurent, M. Bernaudin, F. Mouriaux, Investigative Ophthalmology & Visual Science 56 (5) (2015) 3085.

[54] A. Suetens, M. Moreels, R. Quintens, E. Soors, J. Buset, S. Chiriotti, K. Tabury, V. Gregoire, S. Baatout, Journal of Radiation Research 56 (1) (2015) 11. [55] C. Giustranti, S. Rousset, E. Balanzat, E. Sage, Biochimie 82 (1) (2000) 79. [56] C. Baumstark-Khan, C.E. Hellweg, A. Arenz, M.M. Meier, Radiation Research

164 (4 Pt 2) (2005) 527.

Figure

Fig. 4. X detector signal processing. The coincidence circuit allows adjusting the SCA window in order to limit the noise of X-ray signal.
Fig. 5 shows the differences between the calculated constant and the CR39 measured during the last 8 years, for various beams and energies
Fig. 8. Longitudinal CR39 signal and the corresponding Gaussian White Noise equivalent

Références

Documents relatifs

L’archive ouverte pluridisciplinaire HAL, est destinée au dépôt et à la diffusion de documents scientifiques de niveau recherche, publiés ou non, émanant des

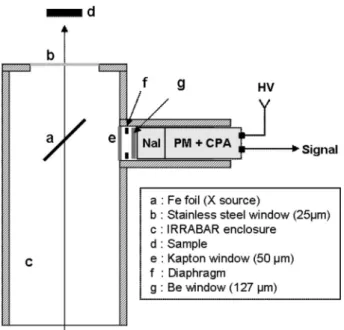
The operators can use these beam diagnostics : - either one by one by selecting what they want with a touch-panel, then by using buttons and shaft encoders to control it and

Boissonnat’s PhD thesis on the behalf of AR- CHADE, France Hadron for dedicating beam time at GANIL to test DOSION prior to radiobiology experiment; CIMAP’s teams for giving

In particular, these include: the extraction of tumor stem cell populations and their radiobiological comparison with the differentiated tumor cells; the studies in hypoxic

We measured the lateral fluence of the beam with the CMOS sensor 26 compared to Geant4 and PSD function calculation, demonstrating an excellent homogeneity and flatness, however,

As we will see, the physical parameters describing the pressure dynamics extracted in this way, allow the reduction of the dead time in cold atom experiments by combining a fast

Those that argue for the use of control lines do so on the following grounds: (i) inferences about response to selection or heritability can be more efficient if facilities are

Abstract - Undeformed oxidized and reduced samples are compared with respect to their pinning behaviour after electron-irradiation, to the existence of Bordoni peaks and to