HAL Id: cea-02498423
https://hal-cea.archives-ouvertes.fr/cea-02498423
Submitted on 4 Mar 2020
HAL is a multi-disciplinary open access
archive for the deposit and dissemination of
sci-entific research documents, whether they are
pub-lished or not. The documents may come from
teaching and research institutions in France or
abroad, or from public or private research centers.
L’archive ouverte pluridisciplinaire HAL, est
destinée au dépôt et à la diffusion de documents
scientifiques de niveau recherche, publiés ou non,
émanant des établissements d’enseignement et de
recherche français ou étrangers, des laboratoires
publics ou privés.
First determination of dissolution rates of oriented UO2
single crystals.
Solène Bertolotto, Stephanie Szenknect, Sophie Lalleman, Renaud Podor,
Laurent Claparede, Alastair Magnaldo, Philippe Raison, Benedicte
Arab-Chapelet, Nicolas Dacheux
To cite this version:
Solène Bertolotto, Stephanie Szenknect, Sophie Lalleman, Renaud Podor, Laurent Claparede, et al..
First determination of dissolution rates of oriented UO2 single crystals.. MRS Fall Meeting, Oct 2019,
Vienne, Austria. https://doi.org/10.1557/adv.2020.41, �10.1557/adv.2020.41�. �cea-02498423�
1
First determination of dissolution rates of oriented
UO
2single crystals.
S. BERTOLOTTO1,2, S. SZENKNECT2, S. LALLEMAN1, R. PODOR2, L. CLAPAREDE2,
A. MAGNALDO1, P. RAISON3, B. ARAB-CHAPELET1 and N. DACHEUX2.
1
CEA, DEN, DMRC, Univ Montpellier, Marcoule , France
2
ICSM, CEA, CNRS, ENSCM, Univ Montpellier, Site de Marcoule, BP 17171, 30207 Bagnols-Sur-Cèze cedex, France
3
JRC Karlsruhe, 76344 Eggenstein-Leopoldshafen, Germany
Abstract Text:
Millimetre oriented UO2 single crystals were cut and oriented at JRC Karlsruhe, with the
Laue diffraction. Single crystals have a form of a slab which each side is oriented, therefor one sample owns several surface orientations ((111), (100), (110)…). The area ratios for all oriented surfaces were determined. Then structural characterization was performed on the main surface in order to confirm the surface orientation after their mechanical polishing. The dissolution of the three samples in nitric acid media was realised under dynamic conditions, at room temperature. During dissolution, two steps were observed for all samples. The first step is the same for all samples, so during this step the oriented surface has no impact on dissolution. However concerning the second step, surface’s orientation influenced the normalised dissolution rate. The (110) surface was found to dissolve faster than the (100) surface. One explanation could involve the atomic composition of the plans of which each oriented surface is made.
INTRODUCTION
After its stay for several years in a nuclear reactor, French spent nuclear fuel (SNF) is reprocessed in order to recover the uranium and plutonium it still contained. The head-end step of the processes is the dissolution of UO2 in concentrated and hot
2
nitric acid. SNF is heterogeneous in terms of microstructure, elementary composition and distribution which could significantly influence the dissolution rates. At the present time, dissolution mechanisms are usually described using a simplified solid/liquid interface, and a succession of two steps. The first one was defined by Hermann et al1., according to equation (1): UO2 + 8 3 HNO3 → UO2(NO3)2 + 2 3 NO + 4 3 H2O (1)
NO(g) + HNO3(aq) → NO2(g) + HNO2(aq) (2)
While the second one can be described as:
UO 2 + 2 HNO2 + 2 H + → UO 2 2+ + 2 NO + 2 H 2O (3)
The first step is associated to a slow rate of reaction but forms powerful oxidising species like dissolved NOx gases or nitrous acid which is suspected to react again on the surface of UO2 and induce a catalytic effect on the dissolution
2
.
Dissolution rate is also influenced by the evolution of the solid surface during the dissolution caused by the heterogeneous attack of the solid3,4. In order to estimate the impact of the microstructure of the solid on the dissolution rate, samples free from any microstructure like grains boundaries and pores have to be considered. For this reason, single crystals of UO2 were used. Samples have a slab form and so they have different
oriented surfaces, this fact allows access to dissolution rates of UO2 for several
crystallographic orientations.
EXPERIMENT Materials
Millimetre-sized single crystals of UO2 were prepared from a bigger single
crystal produced by melting and very slow cooling of a depleted UO2 solution in South
Africa a long time ago. The samples were cut then oriented at the JRC Karlsruhe thanks to the Laue diffraction method. In this study, three slabs with orientated faces were considered (fig. 1). These orientations were investigated because they were characteristic of the fluorite-type structure.
3
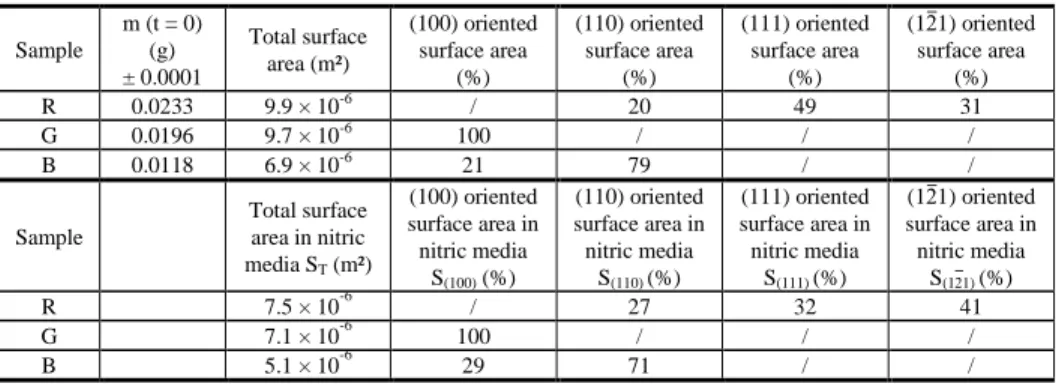
The first step of the samples characterization was to control their weight and dimensions with an optical microscope in order to determine the area ratios for all oriented surfaces (Table 1). During dissolution tests samples were pasted on a support, therefor total surface area in nitric acid media and then the oriented surface ratios are slightly different.
Table 1. Characteristics of UO2 single crystals in terms of global surface area and relative surface areas for each
orientation (bulk material and during dissolution experiments).
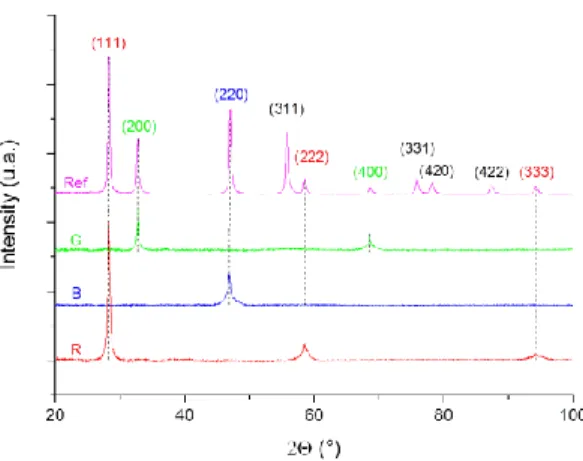
Afterwards, the structural characterization was performed by XRD on the main face of each sample after mechanical polishing. Mirror polished surfaces were obtained with the use of colloidal silica. XRD data were collected using a Bruker D8-Advance Diffractometer (LynxEye detector) in the reflexion geometry with Cu-Kα1.2 radiation (λ
= 1.5418 Å). The analyses were carried out at room temperature in an angular range of 10° < 2ϴ < 100°, with a step of 0.0257 and a total counting time of about 2h. XRD pattern of the three samples is presented in figure 2.
Figure 1. Description of UO2 samples in terms of size, faces orientations and surfaces crystallographic structures.
Sample m (t = 0) (g) ± 0.0001 Total surface area (m²) (100) oriented surface area (%) (110) oriented surface area (%) (111) oriented surface area (%) (12̅1) oriented surface area (%) R 0.0233 9.9 × 10⁻⁶ / 20 49 31 G 0.0196 9.7 × 10⁻⁶ 100 / / / B 0.0118 6.9 × 10⁻⁶ 21 79 / / Sample Total surface area in nitric media ST (m²) (100) oriented surface area in nitric media S(100) (%) (110) oriented surface area in nitric media S(110) (%) (111) oriented surface area in nitric media S(111) (%) (12̅1) oriented surface area in nitric media S(12̅1) (%) R 7.5 × 10⁻⁶ / 27 32 41 G 7.1 × 10⁻⁶ 100 / / / B 5.1 × 10⁻⁶ 29 71 / /
4
The XRD diagrams shows that each sample presents only XRD peaks of UO2,
excluding the presence of any additional phase. Unit cell parameter was evaluated to 5.469 ± 0.004 Å, which is in good agreement with that reported by Leinders et al.5 for UO2 (i.e. a = 5.47127 ± 0.00008 Å). Moreover each surface is well oriented according to
each pattern which showed only peaks corresponding to the main face orientation. Finally, the wide form of the peaks was due to the fact that XRD analysis was realised on bulk samples and not on powders, which is known as the flat plate phenomenon.
Methods
Dissolution tests
Dissolution tests were performed at room temperature under dynamic conditions and mechanical stirring, using 25 mL PTFE reactors continuously fed with nitric acid at room temperature. To limit waste production and to minimise the ratio between the mass of solid and the volume of the solution, nitric acid was recycled upstream the dissolution reactor and the total volume of solution in the closed circuit reached about 250 mL. The volumetric flow rate was 30 mL.h-1 in order to reduce perturbations at the solid / solution interface. Single crystals were put in 2 mol.L-1 HNO3
for one month. At regular times, liquid samples of 5 mL were taken from the dissolution solution and replaced by the same volume of fresh nitric acid to maintain a constant volume of solution. After dilution of the liquid samples with 0.2 mol.L-1 HNO3, the total
uranium concentration was analysed using inductively-coupled plasma mass spectrometry (ICP-MS, Thermo Fisher). The intensity of the signal was recorded at the mass of 238. ICP-MS analyses were calibrated using several uranium standard solutions prepared by dilution of a certified standard solution of 1000 ppm in uranium. The uranium concentrations in the solution were determined by using 193Ir as an internal standard and with three replicates. In these conditions, the detector limit for uranium reached 0.1ppb (i.e. 4.2 × 10 -10 mol.L-1).
Figure 2. XRD pattern of the three UO2 single crystals for their major oriented surface after polishing, (100) surface for G
5
Definitions and normalisation
Thanks to ICP-MS analyses, the elementary concentration, C(t) (g.L-1), was determined for each given time t. The mass fraction of UO2 dissolved at time t, Δm(t) (in
%) was then calculated according to equation (4) :
Δm(t) = f m(t)
u × m(t=0) × 100 =
C(t) × V
fu × m(t=0) × 100 (4)
where m(t) (expressed in g) corresponds to the total amount of the uranium released in solution at the given time t determined from C(t) and the volume of solution in contact with the solid, V (L); fu(expressed in g.g
-1
) is the mass ratio of the uranium in the solid and m(t=0) is the initial mass of the single crystal (g). The normalised weight loss for each sample, NL(U) (g.m
-2
), was calculated according to equation (5) :
NL(U,t) =
m(t)
fi × ST (5)
where ST (m²) is the surface area of the solid in contact with the solution. As
several oriented surfaces composed each sample, it was possible to determine the normalised weight loss for each oriented surface of one sample NL
(hkl)
(U) (g.m-2), considering the following equation:
NL(U,t) = ∑( S(hkl) ST × NL (hkl (U, t)) = ∑(S(hkl) ST × mi(hkl)(t) fu × S(hkl)) (6)
where S(hkl) is the surface area of the oriented surface (hkl).
Dissolution rate can be also described using the dissolved thickness Th(t) (µm) as a function of the time t, according to equation (7):
Th(t) = NL(U,t) ρ (7)
where ρ is the density of the solid (g.cm-3), which is 10.96 g.cm-3 for UO2.
The normalised dissolution rates of each oriented surface, RL (hkl)
(U,t) (expressed in g.m-2.d-1) were derived from the normalised weight losses by time-derivation, i.e. :
RL (hkl)
(U) = dNL
(hkl)(U,t)
dt (8)
RESULTS AND DISCUSSION
In order to determine the dissolution rate of UO2 single crystals and then to
highlight the impact of the crystallographic orientation on the evolution of the normalised weight loss NL
(hkl)
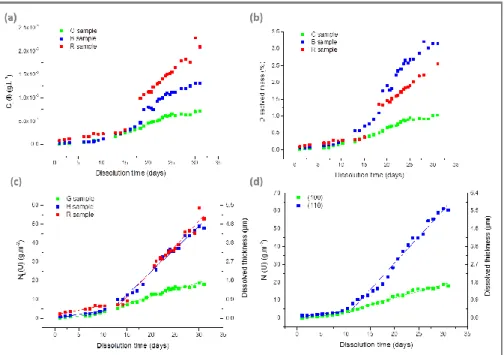
(U) (g.m-2), dissolution tests were performed on the three oriented UO2 single crystals. The evolution of the elemental uranium concentration, of
6
the dissolved mass and of dissolved thickness of the material during the dissolution of the three oriented UO2 single crystals is reported in figure 3.
For all the samples, the uranium release is almost the same until 11 days of dissolution then became different, depending on the oriented sample, for longer dissolution times. The first stage occurs for Δm(t)/m0 ≤ 0.5 wt.% and corresponded to the
establishment of a steady state. This period is called “induction time” in the literature 6. During this step, the normalized weight losses NL(U) and the associated dissolved masses
increases linearly with time, which allows the accurate determination of the normalized dissolution rates RL,0(g.m
-1
.d-1). This phenomenon is observed for all samples investigated, which showed that the crystal orientation of the surface did not play any important role on this first step of dissolution. The normalised dissolution rates determined during this first step for the three samples are reported in Table 2.
After about 11 days of dissolution (i.e. for Δm(t)/m0 > 0.5 wt.%), a second
dissolution step is observed. Uranium is released faster in solution with some differences depending on the nature of the UO2 single crystal (Table 2). Two hypotheses could
explain this increase. First, the reactive surface area may increase at the solid/liquid interface due to the progress of the dissolution reaction (appearance of roughness, pores, corrosion pits …). Secondly, the dissolution reaction (1) may lead to the production of catalytic species in quantities high enough to induce the development of the autocatalytic reaction, already mentioned for powdered and sintered samples of UO2 dissolution in
nitric acid media.
Figure 3. Evolution of uranium elementary concentration (a), of the dissolved mass (b), of the dissolved thickness and the normalised weight loss for entire samples (c) and of the dissolved thickness and the normalised weight loss for (hkl)
7
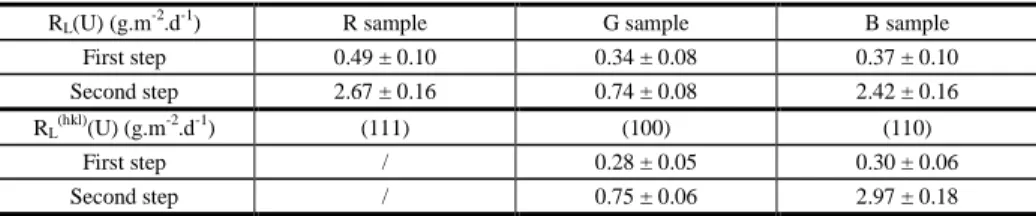
Table 2. Normalised dissolution rates RL(U) (g.m-2.d-1) determined during the two steps of dissolution for each
sample and normalised dissolution rates RL(hkl)(U) (g.m-2.d-1) for each (hkl) orientation surface.
RL(U) (g.m-2.d-1) R sample G sample B sample First step 0.49 ± 0.10 0.34 ± 0.08 0.37 ± 0.10 Second step 2.67 ± 0.16 0.74 ± 0.08 2.42 ± 0.16
RL(hkl)(U) (g.m-2.d-1) (111) (100) (110)
First step / 0.28 ± 0.05 0.30 ± 0.06 Second step / 0.75 ± 0.06 2.97 ± 0.18
The normalised weight losses obtained during the second step of the dissolution for the single crystals called R and B is found to be more important than that obtained for single crystal G. This difference is correlated to the percentage of each oriented surfaces in the different samples. Indeed, while the orientation of the surface has no significant impact on the normalized dissolution rates during the first step, it is found to affect the normalized dissolution rate during the second step.
In order to evaluate such a difference, the normalised weight losses of the oriented surfaces (100) and (110), NL
(hkl)
(U) (g.m-2) were evaluated considering Eq. (3), leading to the determination of RL
(100)
(U) and RL (110)
(U). Values are reported in Table 2. The (100) surface dissolves slower than (110) orientation. One potential explanation can be the nature of the successive planes present at the surface. Indeed, from the crystallographic representation of each oriented surfaces (fig. 1), the atomic planes of (110) oriented surface are composed of both uranium and oxygen atoms. Godinho et al7 already showed during the dissolution of CaF2 (fluorite) that such planes (containing
either Ca and F) were preferentially dissolved, which could be explained by the polarity character of this surface8. On the contrary, the (100) surface is made of an alternation of planes containing uranium atoms only or oxygen atoms only. This surface containing terminal oxygen atoms leads to a non-polarise surface, preventing uranium oxidation. Eventually, the NL
(111)
(U) cannot be calculated yet, because of a lack of data concerning the (12̅1) surface dissolution.
CONCLUSION
Dissolution study of oriented UO2 single crystals in nitric acid medium and at
room temperature showed two successive steps for of the three oriented single crystals studied/investigated. The first step occurred for a weight loss under 0.5%. This step corresponds to the establishment of a steady state during which the dissolution rate is not controlled by the surface orientation and could be considered as a constant. The dissolution rate of this first step, called “induction period” in the literature, is about 0.34-0.49 g.m-2.d-1.
The second step is characterized by a strong increase of the normalised dissolution rate with dissolution time leading to a second linear evolution of the normalised weight loss NL(U). This increase could be explained by an increase in the
reactive surface area at the solid/liquid interface due to the progress of the dissolution reaction (appearance of roughness, pores, corrosion pits …) or by the formation of catalytic species in quantities high enough to induce the development of the autocatalytic reaction. During this state, the orientation of the surface had significant impact on the
8
normalized dissolution rates. Then the individual normalised weight losses of the oriented surfaces (100) and (110), NL
(hkl)
(U) (g.m-2) were evaluated and revealed that the (100) surface dissolved slower than (110) orientation. Surfaces which are composed of both uranium and oxygen atoms, such as the (110) face, were preferentially dissolved, which could be explained by the polarity character of this surface.
References
(1) Herrmann, B. Dissolution de pastilles d’UO2 non irradiées dans l’acide nitrique. Projet
de retraitement et de traitement des déchets 1984, Ref. KfK 3673.
(2) Nishimura, K. Chikazawa, T. Hasegawa, S. Tanaka, H. Ikeda, Y. Yasuike, Y.
Takashima, Y. Effect of nitrous acid on dissolution of UO2 powders in nitric acid optimal
conditions for dissolving UO2. Journal of Nuclear Science and Technology 1995, 32 (2),
157–159
(3) Fukasawa, T. Relationship between dissolution rate of uranium-dioxide pellets in
nitric-acid solutions and their porosity. Journal of Radioanalytical and Nuclear 1986, 106, 345–356.
(4) Taylor, R. F. Sharratt, E. W. Chazal, L. E. M. Logsdail, D. H. Dissolution rates of
uranium dioxide sintered pellets in nitric acid systems. Journal of Applied Chemistry
1963, 13, 32–40.
(5) Leinders, G. Cardinaels, T. Binnemans, K. Verwerft, M. Accurate lattice parameter
measurements of stoichiometric uranium dioxide. Journal of Nuclear Materials 2015,
(6) Cordara, T. Szenknect, S. Claparede, L. Podor, R. Mesbah, A. Lavalette, C. Dacheux, N.
Kinetics of dissolution of UO2 in nitric acid solutions: a multiparametric study of the
non-catalysed reaction. Journal of Nuclear Materials 2017, 496, 251–264.
(7) Godinho, J. R. A. Piazolo, S. Evins, L. Z. Effect of surface orientation on dissolution
rates and topography of CaF2. Geochimica et Cosmochimica Acta 2012, 86, 392–403.
(8) Rennie, S. Bright, E. L. Sutcliffe, J. E. Darnbrough, J. E. Rawle, J. Nicklin, C. Lander, G.
H. Springell, R. The role of crystal orientation in the dissolution of UO2 thin films.