HAL Id: cea-01926890
https://hal-cea.archives-ouvertes.fr/cea-01926890
Submitted on 4 Mar 2019HAL is a multi-disciplinary open access
archive for the deposit and dissemination of sci-entific research documents, whether they are pub-lished or not. The documents may come from teaching and research institutions in France or abroad, or from public or private research centers.
L’archive ouverte pluridisciplinaire HAL, est destinée au dépôt et à la diffusion de documents scientifiques de niveau recherche, publiés ou non, émanant des établissements d’enseignement et de recherche français ou étrangers, des laboratoires publics ou privés.
Guanosine tetraphosphate modulates salicylic acid
signalling and the resistance of Arabidopsis thaliana to
Turnip mosaic virus
Hela Abdelkefi, Matteo Sugliani, Hang Ke, Seddik Harchouni, Ludivine
Soubigou-Taconnat, Sylvie Citerne, Gregory Mouille, Hatem Fakhfakh,
Christophe Robaglia, Ben Field
To cite this version:
Hela Abdelkefi, Matteo Sugliani, Hang Ke, Seddik Harchouni, Ludivine Soubigou-Taconnat, et al.. Guanosine tetraphosphate modulates salicylic acid signalling and the resistance of Arabidopsis thaliana to Turnip mosaic virus. Molecular Plant Pathology, Wiley, 2017, 19 (3), pp.634 - 646. �10.1111/mpp.12548�. �cea-01926890�
Guanosine tetraphosphate modulates salicylic acid signaling and the resistance of
Arabidopsis thaliana to Turnip Mosaic Virus.
Hela Abdelkefi1,2, Matteo Sugliani2, Hang Ke2, Seddik Harchouni2, Ludivine Soubigou-Taconnat3,4, Sylvie Citerne5, Gregory Mouille5, Hatem Fakhfakh1, Christophe Robaglia2, Ben Field2
1
University of Tunis El Manar, Faculté des Sciences de Tunis, Laboratory of Molecular Genetics, Immunology, and Biotechnology, 2092 Elmanar Tunis, Tunisia.
2
Aix Marseille Université, CEA, CNRS, Laboratoire de Génétique et Biophysique des Plantes, UMR 7265 Biologie Végétal et Microbiologie Environnemental, Bioscience and Biotechnology Institute of Aix-Marseille, Marseille, 13009, France.
3
Institute of Plant Sciences Paris Saclay IPS2, CNRS, INRA, Université Paris-Sud, Université Evry, Université Paris-Saclay, Bâtiment 630, 91405 Orsay, France.
4
Institute of Plant Sciences Paris-Saclay IPS2, Paris Diderot, Sorbonne Paris-Cité, Bâtiment 630, 91405, Orsay, France.
5
Institut Jean-Pierre Bourgin, INRA, AgroParisTech, CNRS, Université Paris-Saclay, 78000 Versailles, France.
Author for correspondence: Ben Field
Tel: +33491829562 Email: ben.field@univ-amu.fr
Keywords: guanosine tetraphosphate, (p)ppGpp, chloroplast, turnip mosaic virus, TuMV,
salicylic acid, pathogen
Total word count 6808 No. of figures: 5 (all in color)
Summary: 195 No. of Tables: 1
Introduction: 752 No of Supporting Information files: 12 (Supp Tables 1-8, Supp Fig 1-4) Results 2706 Discussion: 958 Experimental procedures: 1282 Acknowledgements and Contributions 142 Legends 773
This article has been accepted for publication and undergone full peer review but has not been through the copyediting, typesetting, pagination and proofreading process which may lead to differences between this version and the Version of Record. Please cite this article as an
Summary
Chloroplasts can act as key players in the perception and acclimation of plants to incoming environmental signals. A growing body of evidence indicates that chloroplasts play a critical role in plant immunity. Chloroplast function can be regulated by the nucleotides guanosine tetraphosphate and pentaphosphate ((p)ppGpp). In plants (p)ppGpp levels increase in response to abiotic stress and to plant hormones that are involved in abiotic and biotic stress signaling. Here we analyzed the transcriptome of Arabidopsis plants that over accumulate (p)ppGpp and unexpectedly found a decrease in the levels of a broad range of transcripts for plant defense and immunity. To determine whether (p)ppGpp is involved in modulating plant immunity we analysed the susceptibility of plants with different levels of (p)ppGpp to Turnip Mosaic Virus (TuMV) carrying a Green Fluorescent Protein (GFP) reporter. We found that (p)ppGpp accumulation is associated with increased susceptibility to TuMV and reduced levels of the defense hormone salicylic acid (SA). In contrast, plants with lower (p)ppGpp levels showed reduced susceptibility to TuMV, and this was associated with the precocious upregulation of defense-related genes and increased SA content. We therefore demonstrate a new link between (p)ppGpp metabolism and plant immunity in Arabidopsis.
Introduction
The chloroplasts of plants and algae are the result of the endosymbiosis between a eukaryotic cell and a photosynthetic bacterium that occurred more than a billion years ago. Since the initial symbiosis the majority of bacterial genes have either been lost or transferred to the nucleus. In parallel, while retaining photosynthesis, the chloroplast also became the host for critical cellular functions including the assimilation of nitrogen and sulphur; the biosynthesis of fatty acids, amino acids and nucleotides; and the production of many phytohormones. The chloroplast has also emerged as a key player in the acclimation of plants to their changing environment (Fernandez & Strand, 2008, Muhlenbock et al., 2008, Brautigam et al., 2009). However, despite recent progress our understanding of how chloroplasts are able to sense and orchestrate responses to incoming environmental information is still incomplete.
The chloroplast has retained elements of bacterial stress signaling pathways that may be involved in mediating acclimation of plants to environmental perturbation (Puthiyaveetil et al., 2008, Masuda, 2012). One of these is mediated by the nucleotides guanosine
controlled by the antagonistic action of RelA-SpoT homologues (RSH) (Sugliani et al., 2016). Plants possess several conserved families of nucleus encoded RSH enzymes that possess functional (p)ppGpp hydrolase and/or synthase domains (Atkinson et al., 2011). The model plant Arabidopsis thaliana possesses four chloroplast localized RSH enzymes: RSH1 that appears to function as the major (p)ppGpp hydrolase (Sugliani et al., 2016), the closely related RSH2 and RSH3 that appear to act as the major (p)ppGpp synthases (Sugliani et al., 2016, Maekawa et al., 2015, Mizusawa et al., 2008), and a calcium activated RSH (CRSH) that possesses an C-terminal EF-hand domain implicated in calcium binding, and has calcium-dependent (p)ppGpp synthesis activity in vitro (Masuda et al., 2008). (p)ppGpp can act as a potent controller of chloroplast gene expression that appeats to act principally via the inhibition of chloroplast transcription (Yamburenko et al., 2015, Maekawa et al., 2015, Sugliani et al., 2016). While (p)ppGpp appears to contribute to normal plant growth and development (Masuda et al., 2008, Maekawa et al., 2015, Sugliani et al., 2016) it may also have stress related functions. Levels of (p)ppGpp have been shown to increase in response to abiotic stress and to stress-related plant hormones such as abscisic acid (ABA), ethylene and jasmonic acid (JA)(Takahashi et al., 2004, Kim et al., 2009, Ihara et al., 2015). In
Arabidopsis the expression of RSH2 and RSH1 is also regulated by application of the jasmonate precursor 2-oxo-phytodienoic acid, ABA and during abiotic stresses such as wounding and salt treatment (Yamburenko et al., 2015, Chen et al., 2014, Mizusawa et al., 2008).
Plant RSH enzymes were first discovered in Arabidopsis when RSH1 was identified in a yeast two hybrid (Y2H) screen for proteins that interact with the nucleotide binding (NB) leucine rich repeat (LRR) resistance protein RPP5 (van der Biezen et al., 2000). RPP5 permits activation of a defense response to downy mildew strains carrying the cognate Avr gene (Parker et al., 1993). The Y2H interaction between RSH1 and RPP5 suggested that there was a possible link between biotic stress resistance and (p)ppGpp signaling. Subsequently it was reported that the accumulation of Nicotiana tabacum RSH2 (Nt-RSH2) is induced following inoculation of leaves with the bacterial pathogen E. carotovora carotovora (Givens et al., 2004), and that fungal pathogen elicitors and the defense-related phytohormone salicylic acid both induce the expression of the pepper (Capsicum annum) PepRSH (Kim et al., 2009). Nt-RSH2 and PepRSH are closely related to Arabidopsis Nt-RSH2 and RSH3, and heterologous expression of both proteins was able to complement (p)ppGpp deficient strains of E. coli. Several lines of evidence therefore point towards a possible role for RSH enzymes and
(p)ppGpp during plant pathogen interactions, however there are so far no reports of changes in plant pathogen resistance in response to alterations in ppGpp content.
Here we find that Arabidopsis plants that over accumulate (p)ppGpp due to the
overexpression of RSH3 (OX:RSH3.1) show the broad downregulation of defense-related genes. We then show that OX:RSH3 plants are more susceptible to Turnip Mosaic Virus (TuMV) and that this is associated with defects in defense gene expression and SA
accumulation. In contrast, we found that plants with lower (p)ppGpp levels than the wild-type were more resistant to TuMV, and that this was associated with increased defense gene expression and increased salicylic acid levels. Our findings show that (p)ppGpp plays a significant signaling role in plants that can affect the outcome of plant pathogen interactions.
Results
Up-regulation of transcripts related to chloroplast function in OX:RSH3.1
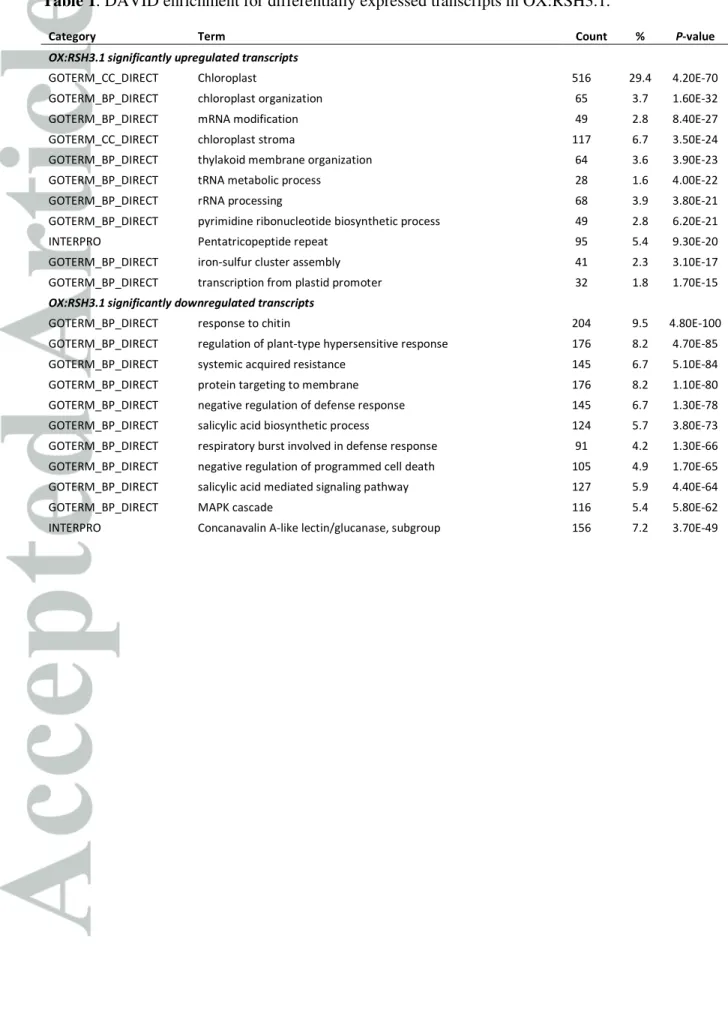
OX:RSH3.1 plants over accumulate (p)ppGpp, and show defects in chloroplast biogenesis and function in a (p)ppGpp dependent manner (Sugliani et al., 2016). We quantified transcript levels in 12 day old wild-type and OX:RSH3.1 seedlings by DNA microarray analysis. The transcripts of more than 4000 genes showed significantly altered levels, of which 1844 were upregulated (Table S1) and 2357 downregulated (Table S2). Functional enrichment and functional enrichment clusters were determined using DAVID (Huang da et al., 2009b, Huang da et al., 2009a). The upregulated transcripts showed a clear enrichment for genes involved in chloroplast function (Table 1, Table S3) that cluster to form a chloroplast-function related group containing 577 distinct genes (Table S4). At first glance an increase in the abundance for the transcripts of genes involved in chloroplast function appears counterintuitive for plants that have reduced chloroplast function. However, we consider it likely that the increased abundance of these transcripts represents a compensatory response mounted to counteract the repression of chloroplast transcription by the accumulation of (p)ppGpp in OX:RSH3.1 (Sugliani et al., 2016). Although chloroplast transcripts are not polyadenylated in the same way as nuclear transcripts they can often be detected in microarray experiments, and here we detected a number of chloroplast transcripts as significantly downregulated, including transcripts from the rRNA / tRNA genes and PsbA that encodes a core subunit of the photosystem two supercomplex. These transcripts were previously shown to be
downregulated in OX:RSH3.1 by quantitative reverse transcription PCR (RT-qPCR)(Sugliani et al., 2016). Transcripts from nuclear-encoded genes involved in RNA processing (mRNA, tRNA and rRNA) also feature prominently in the enriched gene list. Notably, given the role of (p)ppGpp in repressing chloroplast transcription, the transcripts of 32 genes encoding proteins involved in transcription from plastid promoters were significantly upregulated in OX:RSH3.1 (P=1.7E-15; Table 1 and Table S3). The plastid encoded polymerase (PEP) lies at the core of the transcriptionally active chromosome (TAC) complex within chloroplast nucleoids (Pfalz & Pfannschmidt, 2013). Strikingly, transcripts for 11 out of the 12 nuclear genes that encode subunits of the TAC transcriptional subdomain that surrounds PEP are up-regulated in OX:RSH3.1 plants. Also notable is the significant enrichment for the transcripts of genes encoding pentatricopeptide repeat (PPR) proteins in OX:RSH3.1 (95 PPR genes, Table 1, S3, S4). PPRs play important roles in RNA processing, stability and translation in the chloroplast and mitochondria. Interestingly, only 36 of these PPRs possess chloroplast transit
peptides, and many are either targeted to or known to function within the mitochondria, such as SLOW GROWTH 2 (Zhu et al., 2012). This suggests that the altered chloroplast status of OX:RSH3.1 plants can affect the regulation of other organelles. While less prominent, other non-chloroplastic processes are also upregulated including the transcripts for several genes involved in cytosolic rRNA processing and genes encoding nuclear-localised proteins involved in the response to jasmonic acid (Table S3).
An unexpected down-regulation of defense-related transcripts in OX:RSH3.1
Unexpectedly, analysis of the down-regulated transcripts showed enrichment for multiple plant immunity-related processes (Table 1, Table S5) that group together into a single defense-related cluster containing 383 distinct genes (Table S6, Annotation Cluster 1). Transcripts for genes encoding LRR domain proteins are enriched among the downregulated genes (75 genes, P=1.3E-12). These include well known LRR receptor-kinases that are involved in the recognition of bacteria, fungus and virus associated molecular patterns such as FLG22-INDUCED RECEPTOR-LIKE KINASE 1 (FRK1) which is the most strongly
downregulated transcript in OX:RSH3.1, and also CHITIN ELICITOR RECEPTOR KINASE 1 (CERK1), NSP INTERACTING KINASE 2 (NIK2) and SUPPRESSOR OF BIR1-1 (SOBIR1). There is also evidence of the general downregulation of the defense related mitogen-activated protein kinase (MPK) cascade with the downregulation of MPK1, MPK2, MPK3, MPK5, MPK11, MPK15, MPK kinase 1 (MKK1), MKK2, MKK5 and MKK9.
Surprisingly we found no evidence for the enrichment of transcripts for chloroplast-related genes amongst the downregulated transcripts. However, we did observe enrichment for genes implicated in the biosynthesis of the plant defense hormone SA (Table 1, Table S5). The main pathway for SA biosynthesis occurs within the chloroplast, and so could potentially represent the point at which (p)ppGpp accumulation can affect defense signaling. Biosynthesis of salicylic acid is regulated principally by the expression of ISOCHORISMATE SYNTHASE 1 (ICS1) whose gene-product converts the shikimate pathway intermediate chorismate to isochorismate (Wildermuth et al., 2001). ICS1 expression, as well as the expression of many plant immunity genes, is positively regulated by CALMODULIN BINDING PROTEIN 60g (CBP60g) and SAR DEFICIENT 1 (SARD1) (Wang et al., 2011, Truman & Glazebrook, 2012, Sun et al., 2015). In OX:RSH3.1 plants ICS1, CBP60g and SARD1 are all
downregulated. Furthermore, the majority of transcripts for genes that are induced by SA including the central regulator of the SA response NON-EXPRESSOR OF PR GENES 1
(NPR1), are also downregulated in OX:RSH3.1 plants (Table S7)(Blanco et al., 2009). SA signaling is antagonistic to JA signaling, and this relationship also appears to hold in OX:RSH3.1 plants where JA marker transcripts are upregulated including JASMONATE RESPONSIVE 1 (JR1), VEGETATIVE STORAGE PROTEIN 1 (VSP1), CHLOROPHYLLASE 1 (CLH1), PLANT DEFENSIN 1.2 (PDF1.2) and LIPOXYGENASE 2 (LOX2)(Lorenzo & Solano, 2005).
OX:RSH3 plants show increased susceptibility to a viral pathogen
SA signaling is the principal defensive pathway against viruses (Singh et al., 2004, Alazem & Lin, 2015). Virus infection of Arabidopsis is known to provoke SA accumulation, the
expression of pathogenesis-related genes, and to activate the hypersensitive response (HR) locally and systemic acquired resistance (SAR) in more distant parts of the host plant (Singh et al., 2004, Alazem & Lin, 2015). Therefore, to determine whether (p)ppGpp
over-accumulation and the transcriptional downregulation of defense related genes affects
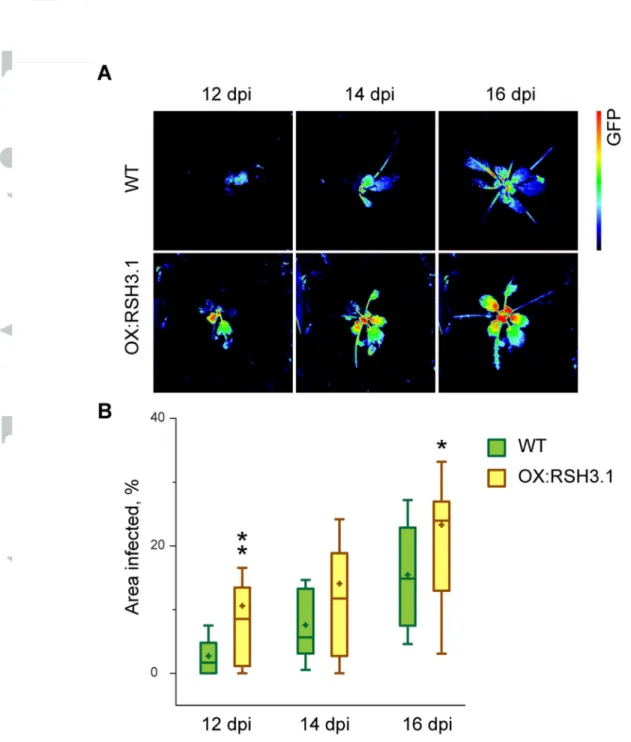
interaction with a plant pathogen we challenged OX:RSH3.1 plants with Turnip Mosaic Virus (TuMV). TuMV is a potyvirus that naturally infects Arabidopsis and other Brassicaceae, and which causes SA accumulation and PR1 expression in host plants (Kim et al., 2008, Peng et al., 2013). We inoculated plants with TuMV-GFP, a TuMV strain that contains a GREEN FLUORESCENT PROTEIN (GFP) reporter gene and which is able to spread systemically in the Arabidopsis Col-0 ecotype (Beauchemin et al., 2005). GFP fluorescence was then used to monitor and quantify the systemic spread of TuMV-GFP by fluorescence imaging. We monitored the spread of TuMV-GFP at the early stages of infection from when the systemic GFP signal first appears in some wild-type plants at 12 days post inoculation (dpi) to 16 dpi when the GFP signal could be detected in all inoculated plants. Visible symptoms of infection appear later and include a reduced growth rate from about 14 dpi, and the appearance of leaves with crinkled borders from about 16 dpi. We found that TuMV-GFP infected OX:RSH3.1 plants consistently showed an earlier appearance of GFP fluorescence, a more intense GFP fluorescence signal and significantly larger infected zones (Fig. 1). Similar results were also obtained for an independent RSH3 overexpression line, OX:RSH3.2, indicating that these results are due to the overexpression of RSH3 and not an unrelated mutation caused during T-DNA integration (Fig. S1). To confirm the increased viral accumulation that was detected by GFP fluorescence and to investigate the role of defense genes in the virus plant interaction we next quantified the expression of viral and plant genes by RT-qPCR (Fig. 2A). RT-qPCR was performed on cDNA derived from the systemic tissue
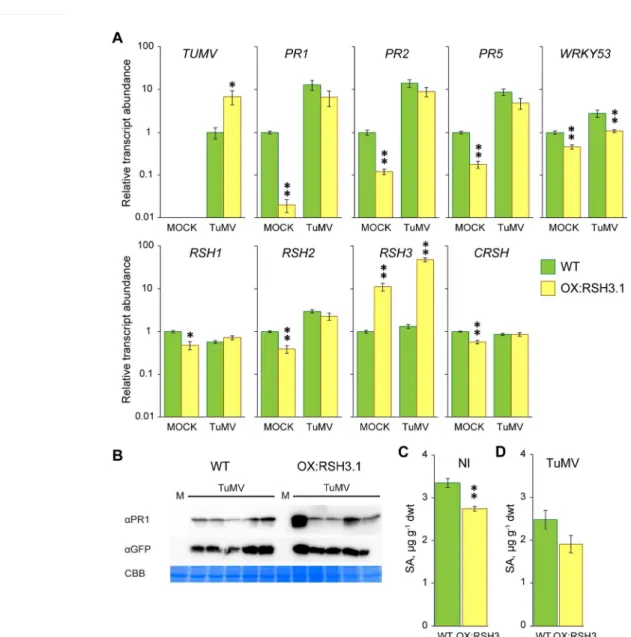
of mock and TuMV inoculated plants sixteen days post inoculation when the systemic infection was established in most inoculated plants. We measured the accumulation of viral RNA, and the defense-related PR1, PR2, PR5 and WRKY53 transcripts. In non-inoculated OX:RSH3.1 plants there were significantly lower levels of PR1, PR2, PR5 and WRKY53 transcripts compared to the non-inoculated wild-type. A change in PR1 expression was not detected in the microarray data, but this may be due to the considerable differences in the plant material tested- 12 day old in vitro grown seedlings for the microarrays and 58 day old plants grown in soil for the RT-qPCR expression analysis. Viral RNA was clearly detectable in the systemic tissues of inoculated plants after 16 days, and in OX:RSH3.1 plants this accumulated to eight-fold higher levels than in the wild-type control. However, because we extracted the RNA for the RT-qPCR analysis from total systemic tissue (non-infected and infected tissue) we cannot determine from these results whether the increased TuMV RNA levels in OX:RSH3.1 is due to increased viral accumulation per cell or to increased viral spreading. The quantification of TuMV-derived GFP fluorescence suggests that both of these mechanisms may be responsible because we observe a significantly larger extent of TuMV infection in OX:RSH3.1 plants, along with a higher GFP intensity (Fig. 1). Viral infection induced the expression of PR1, PR2 and PR5 to similar levels in both wild-type and OX:RSH3.1 plants. The accumulation of PR1 protein and the virally-encoded GFP was also tested by immunoblotting in mock and TuMV inoculated plants (Fig. 2B). No PR1 or virally-encoded GFP could be detected in either the mock inoculated OX:RSH3.1 or the wild-type control. TuMV inoculation resulted in the accumulation of PR1 and TuMV-derived GFP to similar levels in both lines. The absence of a clear difference in viral GFP accumulation between wild-type and OX:RSH3.1 plants may reflect the lower sensitivity of
immunoblotting compared to either RT-qPCR or the GFP fluorescence analysis that was performed here on more than 20 plants per genotype. Another explanation may be that there is greater viral spread in OX:RSH3.1 plants that is not reflected in the immunoblots. Due to the potential links to SA metabolism identified in the gene expression analysis we also measured free SA levels in non-inoculated plants (Fig. 2C) and in TuMV inoculated plants (Fig. 2D). In agreement with the microarray data and RT-qPCR analysis SA levels were significantly lower in non-inoculated OX:RSH3.1 plants than in wild-type plants. SA levels were also lower in inoculated OX:RSH3.1 plants, although this difference was not statistically significant
(P=0.09) . Surprisingly, despite the activation of PR gene expression, SA levels were lower in the TuMV-inoculated plants than in non-inoculated plants. This may suggest that, as others have observed, the increase in SA following TuMV infection is transient (Peng et al., 2013),
or that free SA is converted into derivatives such as SA glucoside as the infection progresses (Fujiwara et al., 2016). Interestingly, auxin levels were also significantly lower in non-infected OX:RSH3.1 plants, a phenomenon that may be connected to the smaller size of these plants and which suggests that high (p)ppGpp levels may be able to perturb SA/auxin
antagonism (Fig. S2A). Indeed, we also found that following infection auxin levels dropped in wild-type plants, but did not change in OX:RSH3.1 plants (Fig. S2B). Taken together these results confirm that there are lower SA levels and a lower expression of SA inducible genes in un-challenged OX:RSH3.1 plants, and show that OX:RSH3.1 plants are still able to induce the expression of defense marker genes in response to TuMV. Thus, the increased
susceptibility of OX:RSH3.1 plants to TuMV may be due to a reduced readiness of the plant defense response under normal growth conditions.
RSH mutants with low (p)ppGpp levels show reduced susceptibility to TuMV
If (p)ppGpp over-accumulation promotes viral infection then we reasoned that reduced (p)ppGpp levels might protect against TuMV. Therefore we tested the susceptibility of two quadruple RSH mutants (QM1 and QM2) that we previously showed to have lower (p)ppGpp levels than the wild-type, and which are defective in processes that require (p)ppGpp
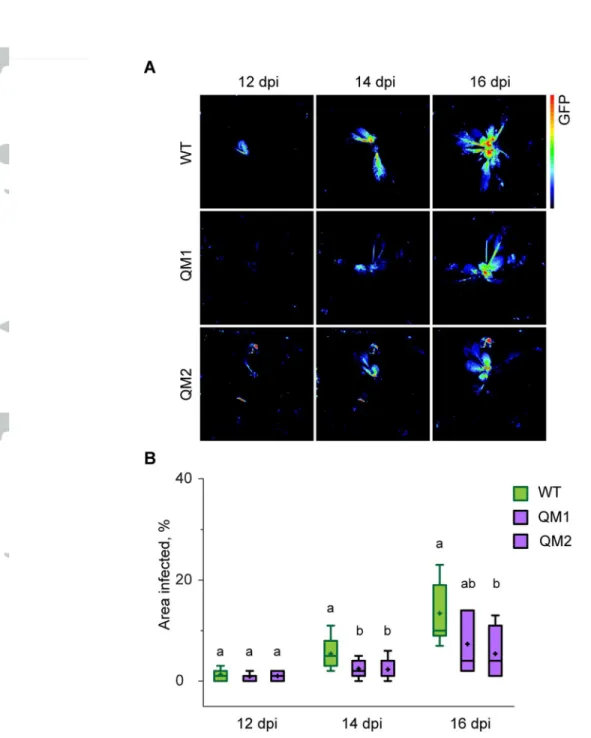
synthesis (Sugliani et al., 2016). QM1 and QM2 both carry identical mutations in genes encoding the ppGpp hydrolase RSH1, the ppGpp synthases RSH2 and RSH3, and independent artificial micro-RNA silencing insertions that knock-down expression of the gene encoding the ppGpp synthase CRSH. Wild-type, QM1 and QM2 plants were inoculated with TuMV-GFP and infection progression was monitored by GFP fluorescence. TuMV-GFP infected QM1 and QM2 plants consistently showed a later appearance of the systemic GFP signal and a significantly reduced infection area (Fig. 3). RT-qPCR was carried out to quantify the accumulation of viral RNA and the expression of SA marker genes in infected and non-infected QM2 plants (Fig. 4A). In agreement with the GFP fluorescence
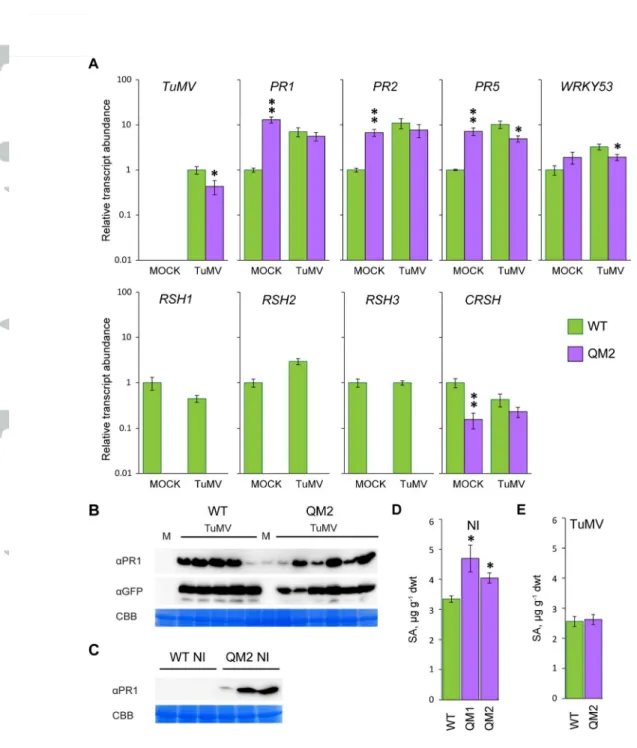
quantification TuMV-GFP accumulation was 2-fold lower in inoculated QM2 plants. Unexpectedly we also found that the expression of SA marker genes in un-challenged QM2 plants was significantly higher than in the wild-type control, and in some cases was as high as in TuMV-GFP inoculated plants. The accumulation of PR1 protein and virally-encoded GFP was also tested by immunoblotting in mock and TuMV inoculated plants (Fig. 4B). In line with the RT-qPCR results we could indeed detect the accumulation of PR1 in mock inoculated QM2 plants but not in mock inoculated wild-type plants. Precocious PR1 expression was also observed in uninoculated QM2 plants (Fig. 4C), although levels were
variable and in other experiments it was not always detectable. Precocious PR1 protein accumulation was not observed in mock or non-inoculated wild-type and OX:RSH3.1 plants. TuMV inoculation resulted in the accumulation of PR1 in the wild-type, and the accumulation of higher levels of PR1 in QM2 (Fig. 4B). The accumulation of virally-encoded GFP was also observed in wild-type and QM2 after TuMV inoculation. Free SA levels in uninoculated QM1 and QM2 plants were significantly higher than in the wild-type (Fig. 4D) but no difference could be observed between wild-type and QM2 plants after inoculation with TuMV (Fig. 4E). Interestingly, while auxin levels were not different in uninoculated plants, auxin levels
dropped less in QM2 plants than wildtype plants during TuMV infection (Fig S2). All together these data suggest that QM plants are more likely than wild-type plants to be pre-primed for a defense response under normal growth conditions. This priming is likely to explain the increased resistance of QM1 and QM2 to TuMV infection.
As in our analysis of wild-type and OX:RSH3.1 plants (Fig. 2A) we observed that TuMV infection resulted in reduced RSH1 transcript levels and increased RSH2 transcript levels in wild-type plants (P<0.001 for each gene across the two experiments, multiple-factor
ANOVA)(Fig. 4A). The reciprocal regulation of RSH1 and RSH2 suggests that virus infection may promote (p)ppGpp biosynthesis because RSH1 encodes the major (p)ppGpp hydrolase and RSH2 encodes a major (p)ppGpp synthetase (Sugliani et al., 2016). These results indicate that (p)ppGpp metabolism may be actively regulated in wild-type plants in response to virus infection.
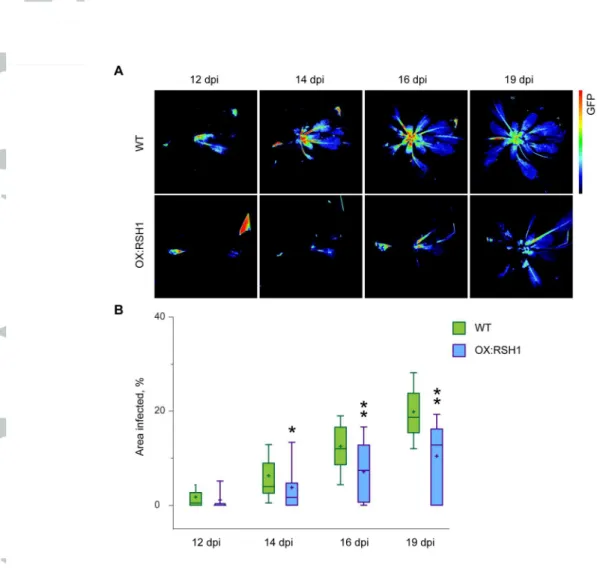
To further confirm that the increased resistance of QM plants was directly related to (p)ppGpp levels we also tested the resistance of OX:RSH1 plants to TuMV. RSH1 acts as the major hydrolase of (p)ppGpp in Arabidopsis, and overexpression of RSH1 also results in reduced (p)ppGpp levels and defects in processes that require (p)ppGpp (Sugliani et al., 2016). Strikingly, TuMV-GFP infected OX:RSH1 plants showed a similar phenotype to QM1 and QM2 plants with the later appearance of a systemic GFP signal, and a significantly reduced infection zone area (Fig. 5). OX:RSH1 have lower (p)ppGpp levels than QM2 plants (Sugliani et al., 2016), and also showed a slightly stronger resistance than QM plants, indicating that TuMV-GFP resistance is correlated to (p)ppGpp levels. To eliminate the possibility that (p)ppGpp depletion interferes with the agroinoculation of TuMV we also infected OX:RSH1 and wild-type plants by rubbing with a preparation of virus particles. An almost identical
resistance response was observed for OX:RSH1, indicating that reduced (p)ppGpp levels directly reduce TuMV progression (Fig. S3).
Interestingly, OX:RSH1 plants also showed an additional resistance phenotype where a small proportion of plants appeared to slowly recover from TuMV-GFP infection 30 days after inoculation (Fig. S4). Recovery from infection was associated with the clearance of GFP from the center of the rosette, the appearance of healthy leaves, and also the appearance of leaves that were mostly healthy but had sectors that did not develop properly. These plants were also able to flower, unlike wild-type plants that died before flowering. These phenotypes suggest that OX:RSH1 plants are sometimes able to clear TuMV-GFP from the meristem. Although we consider it likely, this phenotype cannot currently be unambiguously assigned to altered (p)ppGpp levels in OX:RSH1 plants because we cannot exclude the possibility that other mutations in the OX:RSH1 background are involved. Up to now we have only been able to isolate a single line that stably over-expresses RSH1 over multiple generations, and no second line is currently available for verifying the cause of the OX:RSH1 TuMV-GFP escape
phenotype.
Discussion
Chloroplasts can act as key players in the perception and adaptation of plants to incoming environmental signals. A growing body of evidence indicates that chloroplasts play a critical role during plant pathogen interactions (Serrano et al., 2016). Chloroplasts are an important source of reactive oxygen species for the hypersensitive response, they are the site of synthesis for the defense-related hormones SA and JA, and they are involved in integrating immunity related signals. For example, the extracellular perception of pathogen-associated molecular patterns (PAMPS) leads to calcium transients within the chloroplast that require the chloroplastic calcium-sensing receptor (CAS)(Nomura et al., 2012). CAS mutants fail to activate SA biosynthesis and PR expression in response to PAMP treatment, and are more susceptible to bacterial pathogens. Here we show that (p)ppGpp, a regulator of chloroplast gene expression, is also involved in regulating plant immunity. High (p)ppGpp levels were associated with the downregulation of many defense related genes, reduced levels of SA, and reduced resistance to TuMV-GFP (Table 1, Fig. 1-2, Fig. S1). Conversely low (p)ppGpp levels were associated with the precocious upregulation of defense genes, higher levels of SA and increased resistance to TuMV-GFP (Fig. 2-5, Fig. S3). Interestingly, for both OX:RSH3.1
and QM2 the difference in the expression of defense related genes was most obvious in uninfected plants, and in infected plants these differences were no longer significant. This suggests that (p)ppGpp may only be able to affect virus progression at an early stage after inoculation. Further studies will be required to refine our understanding of this process.
ppGpp affects virus progression by modulating SA signaling
Plants with low (p)ppGpp levels have increased SA content and display a precocious expression of PR genes (Fig. 4). This phenotype does not appear to be constitutive as in the SA overaccumulating siz1 mutant (Lee et al., 2007) because we could sometimes identify QM2 plants with lower or no PR1 protein accumulation. Instead we suggest that the threshold for triggering SA accumulation and signaling in QM2 plants may be lower than for wild-type plants, and that this may result in the background levels of microorganisms becoming
sufficient for the activation of SA-accumulation. More in depth studies than we present here will be required to understand this phenomenon. Whatever the mechanism (Sugliani et al., 2016), the precocious accumulation of SA and the activation of PR gene expression in plants with low (p)ppGpp may be sufficient to explain the increased resistance of these plants to TuMV-GFP. SA signaling is strongly associated with defense against viruses (Malamy et al., 1990, Alazem & Lin, 2015). Reducing SA levels compromises resistance to many viruses, and increasing SA levels either within the plant or by exogenous application prior to infection augments viral resistance (Alazem & Lin, 2015). Increased SA levels can protect against a wide range of biotrophic pathogens. Therefore, the upregulation of SA signaling in plants with low (p)ppGpp levels is likely to provide a broad increase in resistance that is not specific to viruses. SA signaling is antagonistic to auxin signaling during defense interactions(Kazan & Manners, 2009). Interestingly, we observed potential effects of ppGpp on SA-auxin crosstalk in TuMV-GFP inoculated QM2 plants which had significantly higher auxin levels than wild-type plants (Fig. S2D). SA signaling is also antagonistic to JA-ethylene (ET) signaling, which plays an important role in the defense against necrotrophic pathogens and herbivores (Dodds & Rathjen, 2010). The alterations in SA signaling in plants with low (p)ppGpp levels could therefore interfere with JA-ET signaling, and result in compromised resistance to necrotrophic pathogens.
ppGpp metabolism is a potential target of pathogen effector molecules
Recent work has clearly shown that the chloroplast is a major target of pathogen effector molecules (Serrano et al., 2016). In particular, it has been shown that the virulent pathogen
Pseudomonas syringae directly targets the chloroplast and downregulates the expression of nuclear encoded chloroplastic proteins to cause a rapid drop in the efficiency of photosystem II and an inhibition of HR (de Torres Zabala et al., 2015). NB LRR proteins have been proposed to act as guards that protect host guardee proteins from interference by pathogen-encoded avirulence proteins (Van der Biezen & Jones, 1998). RSH1 has been shown to interact with the NB LRR resistance protein RPP5 using Y2H (van der Biezen et al., 2000). It is therefore plausible that RPP5 is involved in guarding RSH1 from the cognate avirulence protein ATR5 which is carried by the downy mildew pathogen Hyaloperonospora
arabidopsidis isolate Emoy2 (Bailey et al., 2011). In the absence of RPP5 ATR5-mediated degradation or retention of RSH1 in the cytoplasm would then allow unchecked (p)ppGpp accumulation in the chloroplast. This could aid the pathogen because the accumulation of (p)ppGpp reduces photosystem II efficiency (Sugliani et al., 2016, Maekawa et al., 2015) and, as we show here, reduces the defensive capabilities of the plant (Table 1, Fig. 1-2). In the future focused studies using specific pathosystems and effector molecules will be required to establish whether (p)ppGpp metabolism is indeed directly targeted by plant pathogens.
ppGpp metabolism is upregulated in response to TuMV-GFP
We observed a statistically significant downregulation of RSH1 and upregulation of RSH2 expression during the viral infection of wild-type plants (Fig. 2,4). The upregulation of RSH2 is reminiscent of the induction of N. tabacum RSH2 and C. annum PepRSH in response to PAMPs (Givens et al., 2004, Kim et al., 2009). Because RSH1 is the major (p)ppGpp hydrolase and RSH2 a major (p)ppGpp synthase their reciprocal regulation could result in a significant increase in (p)ppGpp biosynthetic capacity within the chloroplast. These results show that (p)ppGpp metabolism is likely to be actively regulated during pathogen-plant interactions. However, because Arabidopsis is susceptible to TuMV it is not possible at this point to determine whether this response is driven by the pathogen or by the host plant.
Experimental Procedures
Plant materials
Arabidopsis ecotype Col-0 was used as the wild-type in this study. OX:RSH3.1(OX:RSH3-GFP.1), OX:RSH3.2 (OXRSH3-GFP.2), OX:RSH1 (OX:RSH1-GFP.10), QM1 (rsh1-1 (SAIL_391_E11), rsh2-1 (SAIL_305_B12), rsh3-1 (SAIL_99_G05), crsh1-1
(SAIL_1295_C04), crsh-ami), and QM2 (as for QM1 with an independent crsh-ami insertion) were described in Sugliani et al. (2016).
Transcriptome Studies
Microarray analysis was carried out at the Institute of Plant Sciences Paris-Saclay (IPS2, Evry, France) (Evry, France), using the CATMAv6.2 array based on Roche-NimbleGen technology. A single high density CATMAv6.2 microarray slide contains twelve chambers, each containing 219 684 primers representing all the Arabidopsis thaliana genes: 30834 probes corresponding to CDS TAIRv8 annotation (including 476 probes of mitochondrial and chloroplast genes) + 1289 probes corresponding to EUGENE software predictions. Moreover, it included 5352 probes corresponding to repeat elements, 658 probes for miRNA/MIR, 342 probes for other RNAs (rRNA, tRNA, snRNA, soRNA) and finally 36 controls. Each long primer is triplicated in each chamber for robust analysis and for both strands. Three independent biological replicates were produced for each line (wild-type Col-0 and
OX:RSH3.1) and for each biological replicate RNA samples were obtained by pooling RNAs from more than 36 plants. The aerial parts of 12-day old seedlings at developmental growth stage 1.04 (Boyes et al., 2001) were collected. The plants were grown on MS/2 medium (0.5X MS salts (Sigma-Aldrich, Saint-Quentin-Fallavier, France), 1% sucrose, 0.5 g/l MES, 0.4 % phytagel (Sigma-Aldrich), pH 5.7 KOH), under 80 µmol m-2 s-1 photosynthetically active radiation (PAR) fluorescent lighting in long-day conditions (16 hours of light, 8 hours of dark). Total RNA was extracted using an RNeasy mini kit (Qiagen) according to the supplier’s instructions. For each comparison, one technical replicate with fluorochrome reversal was performed for each biological replicate (i.e. four hybridizations per comparison). cRNA was synthesised using olido dT primers and labelled with Cy3-dUTP or Cy5-dUTP (Perkin-Elmer-NEN Life Science Products) as described in Lurin et al. (2004).The
hybridization and washing were performed according to NimbleGen Arrays User’s Guide v5.1 instructions. Two micron scanning was performed with InnoScan900 scanner
(InnopsysR, Carbonne, France) and raw data were extracted using MapixR software (InnopsysR, Carbonne, France).
Statistical Analysis of Microarray Data
Experiments were designed with the statistics group of the Unité de Recherche en Génomique Végétale. For each array, the raw data comprised the logarithm of median feature pixel intensity at wavelengths 635 nm (red) and 532 nm (green). For each array, a global intensity-dependent normalization using the loess procedure (Yang et al., 2002) was performed to correct the dye bias. The differential analysis is based on the log-ratios averaging over the duplicate probes and over the technical replicates. Hence the numbers of available data for each gene equals the number of biological replicates and are used to calculate the moderated t-test (Smyth, 2004). Under the null hypothesis, no evidence that the specific variances vary between probes is highlighted by Limma and consequently the moderated t-statistic is
assumed to follow a standard normal distribution. To control the false discovery rate, adjusted p-values found using the optimized FDR approach of Storey and Tibshirani (2003) are
calculated. We considered as being differentially expressed the probes with an adjusted p-value ≤ 0.05. Analysis was done with the R package (R Development Core Team, 2005). The function SqueezeVar of the library limma was used to smooth the specific variances by computing empirical Bayes posterior means. The library kerfdr was used to calculate the adjusted p-values.
Data Deposition
Microarray data from this article were deposited at Gene Expression Omnibus (http://www.ncbi.nlm.nih.gov/geo/; accession no. GSE62656) and at CATdb
(http://urgv.evry.inra.fr/CATdb/; Project:CEA-CATMA2012-02) according to the “Minimum Information About a Microarray Experiment” standards.
Virus inoculation by agroinfiltration or rubbing
Plants were grown on soil under an 8 hour light/ 16 hour dark photoperiod at 18/22°C with 115 µmol m-2 s-1 PAR lighting and a weekly application of Coïc-Lesaint fertilizer solution. After 42 days growth the first and second true leaves were either infiltrated with a solution of Agrobacterium tumefaciens containing the plasmid P35tunos/nGFP that carries TuMV-GFP (Beauchemin et al., 2005) or lightly rubbed with TuMV-GFP particles prepared from turnip leaves. The Agrobacterium solution was prepared by growing the bacteria in Luria Bertani
medium with 50 ug ml-1 kanamycin and 50 ug ml-1 rifampicin for 48 hrs and then resuspending in 10 mM MgCl2 to an optical density of 1, before the addition of 200 µM
acetosyringone and incubation at 20°C for 3 hours. TuMV-GFP particles were prepared by grinding fresh infected turnip leaves in phosphate buffer (50 mM, pH 7.0) containing active carbon and then adding the abrasive agent carborundum.
GFP imaging and quantification
GFP fluorescence was measured in an imaging fluorimeter Fluorcam FC 800-O (Photon System Instruments, Drasov, Czech Republic). Total chlorophyll fluorescence was used to obtain the total visible leaf area, and this was used to calculate the percentage of visible plant area with GFP fluorescence (area infected). RSH1 and RSH3 are fused to GFP in OX:RSH1 and OX:RSH3 plants, however expression levels are low and no GFP fluorescence could be detected in mock inoculated plants either with the imaging fluorimeter or by fluorescence microscopy.
RNA extraction and qRT PCR analysis
RNA was extracted from plant tissue using TriReagent (Sigma-Aldrich), quality was confirmed by gel electrophoresis, and genomic DNA removed by treatment with DNAse. cDNA was then synthesized from 500 ng of RNA using Primescript RT Reagent Kit (Takara) with random hexamer primers. RT-qPCR was performed on 1 µl of 1 in 40 diluted cDNA in 15 µl reactions using SYBR Premix Ex-Taq II reagent (Takara Bio, Japan) in a BioRad CFX96 Real Time System. Gene specific primers were designed using Primer-BLAST (Ye et al., 2012) which uses Primer 3 (Koressaar & Remm, 2007, Untergasser et al., 2012)(see Table S8 for primer pairs). Relative quantification of gene expression adjusted for efficiency was performed using PCR Miner (Zhao & Fernald, 2005). For each experiment multiple validated reference genes were tested (Czechowski et al., 2005). Reference genes were only used if their stability values were within advised limits (M < 0.5 and Cv < 0.25) (Vandesompele et al., 2002).
Hormone quantification
For free SA and auxin analysis the aerial parts or the systemic aerial parts of TuMV-GFP inoculated whole plants were snap frozen in liquid nitrogen, ground to a fine powder,
lyophilized, weighed (2 mg) and extracted with 1.6 mL of acetone:water:acetic acid (80:19:1 v/v/v) containing 2 ng of stable isotope-labelled internal standards:[4-2H] SA (Olchemlm)
and 1ng 13C6IAA (Cambridge Isotope Laboratory Inc.). Extraction, identification and quantification were performed as described previously (Aznar et al., 2014). The transitions used for quantification by multiple reaction monitoring quantification were 176.1>130.06 for endogenous IAA and 182.1>136.05 for 13C6IAA; and 137>93 for endogenous SA and 141.1>96.9 for [4-2H] SA.
Protein separation and immunobloting
Proteins were extracted in 2X SDS sample buffer (100 mM Tris-HCl pH 6.8, 25 mM EDTA, 4% SDS, 20% glycerol) by heating at 85oC for 5 minutes. Protein concentration was
measured using the BCA assay (Sigma-Aldrich). Proteins were then reduced with 5% betamercaptoethanol and equal quantities separated by SDS-PAGE and either stained with Coomassie Brilliant Blue or transferred onto nitrocellulose membranes according to the manufacturer’s instructions (Bio-Rad, Marnes-La-Coquette, France). After incubation with 5% nonfat milk in TBST (10 mM Tris, pH 8.0, 150 mM NaCl, 0.1% Tween 20) for 60 min, the membrane was incubated in the same buffer with antibodies against PR1 (Agrisera, polyclonal) or GFP (Roche, Boulogne Billancourt, France; clones 7.1 and 13.1). The membrane was washed three times for 5 min in TBST and then incubated with horseradish peroxidase conjugated anti-mouse or anti-rabbit antibodies for 1 hr at room temperature. The membrane was then washed a further three times in TBST, developed using Immobilon ECL substrate (Millipore, Molsheim, France), and imaged with a Fusion FX7 imager (Vilber Lourmat, Collegien, France).
Acknowledgements
We thank M. Reissolet and J-C. Ferrandi for assistance, J-L. Gallois for the gift of turnip seeds and advice on TuMV inoculations, J-F Laliberté for providing the TuMV-GFP clone, and R. Grangeon for information about the clone. The project was supported by the Agence National de la Recherche 10-JCJC-120) and LabEx Saclay Plant Sciences-SPS (ANR-10-LABX-0040-SPS). H.A. received mobility grants from the Tunisian Ministry of Higher Education, H.K. is supported by a PhD studentship from the China Scholarship Council and S.H. by a CEA PhD studentship.
Author Contributions
H.A., M.S., H.F. C.R. and B.F. planned and designed experiments. L.S. performed the transcriptomic experiments, S.C. and G.M. measured hormone levels and H.A., M.S., H.K., S.H. and B.F performed the remaining experiments. H.A., M.S., L.S., S.C., G.M. and B.F. analyzed the data. B.F. and H.A. wrote the paper with assistance from the other authors.
References
Alazem, M. and Lin, N.-S. (2015) Roles of plant hormones in the regulation of host–virus interactions.
Mol. Plant Pathol. 16, 529-540.
Atkinson, G. C., Tenson, T. and Hauryliuk, V. (2011) The RelA/SpoT homolog (RSH) superfamily: distribution and functional evolution of ppGpp synthetases and hydrolases across the tree of life. PloS one, 6, e23479.
Aznar, A., Chen, N. W., Rigault, M., Riache, N., Joseph, D., Desmaele, D., et al. (2014) Scavenging iron: a novel mechanism of plant immunity activation by microbial siderophores. Plant Physiol., 164, 2167-2183.
Bailey, K., Cevik, V., Holton, N., Byrne-Richardson, J., Sohn, K. H., Coates, M., et al. (2011) Molecular cloning of ATR5(Emoy2) from Hyaloperonospora arabidopsidis, an avirulence determinant that triggers RPP5-mediated defense in Arabidopsis. Mol. Plant Microbe Interact., 24, 827-838.
Beauchemin, C., Bougie, V. and Laliberte, J. F. (2005) Simultaneous production of two foreign proteins from a polyvirus-based vector. Virus Res., 112, 1-8.
Blanco, F., Salinas, P., Cecchini, N. M., Jordana, X., Van Hummelen, P., Alvarez, M. E., et al. (2009) Early genomic responses to salicylic acid in Arabidopsis. Plant Mol. Biol., 70, 79-102. Boyes, D. C., Zayed, A. M., Ascenzi, R., McCaskill, A. J., Hoffman, N. E., Davis, K. R., et al. (2001)
Growth stage-based phenotypic analysis of Arabidopsis: a model for high throughput functional genomics in plants. Plant Cell, 13, 1499-1510.
Brautigam, K., Dietzel, L., Kleine, T., Stroher, E., Wormuth, D., Dietz, K. J., et al. (2009) Dynamic plastid redox signals integrate gene expression and metabolism to induce distinct metabolic states in photosynthetic acclimation in Arabidopsis. Plant Cell, 21, 2715-2732.
Chen, J., Bang, W. Y., Lee, Y., Kim, S., Lee, K. W., Kim, S. W., et al. (2014) AtObgC-AtRSH1 interaction may play a vital role in stress response signal transduction in Arabidopsis. Plant Physiol.
Biochem., 74, 176-184.
Czechowski, T., Stitt, M., Altmann, T., Udvardi, M. K. and Scheible, W. R. (2005) Genome-wide identification and testing of superior reference genes for transcript normalization in Arabidopsis. Plant Physiol., 139, 5-17.
de Torres Zabala, M., Littlejohn, G., Jayaraman, S., Studholme, D., Bailey, T., Lawson, T., et al. (2015) Chloroplasts play a central role in plant defence and are targeted by pathogen effectors. Nat
Plants, 1, 15074.
Dodds, P. N. and Rathjen, J. P. (2010) Plant immunity: towards an integrated view of plant-pathogen interactions. Nature Rev. Genet., 11, 539-548.
Fernandez, A. P. and Strand, A. (2008) Retrograde signaling and plant stress: plastid signals initiate cellular stress responses. Curr. Opin. Plant Biol., 11, 509-513.
Fujiwara, A., Togawa, S., Hikawa, T., Matsuura, H., Masuta, C. and Inukai, T. (2016) Ascorbic acid accumulates as a defense response to Turnip mosaic virus in resistant Brassica rapa cultivars.
J. Exp. Bot., 67, 4391-4402.
Givens, R. M., Lin, M. H., Taylor, D. J., Mechold, U., Berry, J. O. and Hernandez, V. J. (2004) Inducible expression, enzymatic activity, and origin of higher plant homologues of bacterial RelA/SpoT stress proteins in Nicotiana tabacum. J. Biol. Chem., 279, 7495-7504.
Huang da, W., Sherman, B. T. and Lempicki, R. A. (2009a) Bioinformatics enrichment tools: paths toward the comprehensive functional analysis of large gene lists. Nucleic Acids Res., 37, 1-13. Huang da, W., Sherman, B. T. and Lempicki, R. A. (2009b) Systematic and integrative analysis of large
gene lists using DAVID bioinformatics resources. Nat. Protoc., 4, 44-57.
Ihara, Y., Ohta, H. and Masuda, S. (2015) A highly sensitive quantification method for the
accumulation of alarmone ppGpp in Arabidopsis thaliana using UPLC-ESI-qMS/MS. J. Plant
Kazan, K. and Manners, J. M. (2009) Linking development to defense: auxin in plant-pathogen interactions. Trends Plant Sci., 14, 373-382.
Kim, B., Masuta, C., Matsuura, H., Takahashi, H. and Inukai, T. (2008) Veinal Necrosis Induced by Turnip mosaic virus Infection in Arabidopsis Is a Form of Defense Response Accompanying HR-Like Cell Death. Trends Plant Sci, 21, 260-268.
Kim, T.-H., Ok, S. H., Kim, D., Suh, S.-C., Byun, M. O. and Shin, J. S. (2009) Molecular characterization of a biotic and abiotic stress resistance-related gene RelA/SpoT homologue (PepRSH) from pepper. Plant Science, 176, 635-642.
Koressaar, T. and Remm, M. (2007) Enhancements and modifications of primer design program Primer3. Bioinformatics, 23, 1289-1291.
Lee, J., Nam, J., Park, H. C., Na, G., Miura, K., Jin, J. B., et al. (2007) Salicylic acid-mediated innate immunity in Arabidopsis is regulated by SIZ1 SUMO E3 ligase. Plant J., 49, 79-90.
Lorenzo, O. and Solano, R. (2005) Molecular players regulating the jasmonate signalling network.
Curr. Opin. Plant Biol., 8, 532-540.
Lurin, C., Andres, C., Aubourg, S., Bellaoui, M., Bitton, F., Bruyere, C., et al. (2004) Genome-wide analysis of Arabidopsis pentatricopeptide repeat proteins reveals their essential role in organelle biogenesis. Plant Cell, 16, 2089-2103.
Maekawa, M., Honoki, R., Ihara, Y., Sato, R., Oikawa, A., Kanno, Y., et al. (2015) Impact of the plastidial stringent response in plant growth and stress responses. Nat. Plants, 1, 15167. Malamy, J., Carr, J. P., Klessig, D. F. and Raskin, I. (1990) Salicylic Acid: a likely endogenous signal in
the resistance response of tobacco to viral infection. Science, 250, 1002-1004. Masuda, S. (2012) The Stringent Response in Phototrophs. In: Advances in Photosynthesis -
Fundamental Aspects. (Najafpour, M., ed.). InTech.
Masuda, S., Mizusawa, K., Narisawa, T., Tozawa, Y., Ohta, H. and Takamiya, K. (2008) The bacterial stringent response, conserved in chloroplasts, controls plant fertilization. Plant Cell Physiol., 49, 135-141.
Mizusawa, K., Masuda, S. and Ohta, H. (2008) Expression profiling of four RelA/SpoT-like proteins, homologues of bacterial stringent factors, in Arabidopsis thaliana. Planta, 228, 553-562. Muhlenbock, P., Szechynska-Hebda, M., Plaszczyca, M., Baudo, M., Mateo, A., Mullineaux, P. M., et
al. (2008) Chloroplast signaling and LESION SIMULATING DISEASE1 regulate crosstalk
between light acclimation and immunity in Arabidopsis. Plant Cell, 20, 2339-2356. Nomura, H., Komori, T., Uemura, S., Kanda, Y., Shimotani, K., Nakai, K., et al. (2012)
Chloroplast-mediated activation of plant immune signalling in Arabidopsis. Nat. Comm., 3, 926. Parker, J. E., Szabó, V., Staskawicz, B. J., Lister, C., Dean, C., Daniels, M. J., et al. (1993) Phenotypic
characterization and molecular mapping of the Arabidopsis thaliana locus RPP5, determining disease resistance to Peronospora parasitica. Plant J., 4, 821-831.
Peng, H., Li, S., Wang, L., Li, Y., Li, Y., Zhang, C., et al. (2013) Turnip mosaic virus induces expression of the LRR II subfamily genes and regulates the salicylic acid signaling pathway in non-heading Chinese cabbage. Physiol. Mol. Plant Path., 82, 64-72.
Pfalz, J. and Pfannschmidt, T. (2013) Essential nucleoid proteins in early chloroplast development.
Trends Plant Sci., 18, 186-194.
Puthiyaveetil, S., Kavanagh, T. A., Cain, P., Sullivan, J. A., Newell, C. A., Gray, J. C., et al. (2008) The ancestral symbiont sensor kinase CSK links photosynthesis with gene expression in chloroplasts. Proc. Natl. Acad. Sci. U.S.A., 105, 10061-10066.
R Development Core Team (2005) R: A language and environment for statistical computing, reference index version 2.2.1. Vienna, Austria: . R Foundation for Statistical Computing.
Serrano, I., Audran, C. and Rivas, S. (2016) Chloroplasts at work during plant innate immunity. J. Exp.
Bot., 67, 3845-3854.
Singh, D. P., Moore, C. A., Gilliland, A. and Carr, J. P. (2004) Activation of multiple antiviral defence mechanisms by salicylic acid. Mol. Plant Pathol., 5, 57-63.
Smyth, G. K. (2004) Linear models and empirical bayes methods for assessing differential expression in microarray experiments. Stat. Appl. Genet. Mol., 3, Article 3.
Storey, J. D. and Tibshirani, R. (2003) Statistical significance for genomewide studies. Proc. Natl. Acad.
Sci. U.S.A., 100, 9440-9445.
Sugliani, M., Abdelkefi, H., Ke, H., Bouveret, E., Robaglia, C., Caffarri, S., et al. (2016) An Ancient Bacterial Signaling Pathway Regulates Chloroplast Function to Influence Growth and Development in Arabidopsis. Plant Cell, 28, 661-679.
Sun, T., Zhang, Y., Li, Y., Zhang, Q., Ding, Y. and Zhang, Y. (2015) ChIP-seq reveals broad roles of SARD1 and CBP60g in regulating plant immunity. Nat. Comm., 6, 10159.
Takahashi, K., Kasai, K. and Ochi, K. (2004) Identification of the bacterial alarmone guanosine 5'-diphosphate 3'-5'-diphosphate (ppGpp) in plants. Proc. Natl. Acad. Sci. U.S.A.,, 101, 4320-4324. Truman, W. and Glazebrook, J. (2012) Co-expression analysis identifies putative targets for CBP60g
and SARD1 regulation. BMC Plant Biol., 12, 216.
Untergasser, A., Cutcutache, I., Koressaar, T., Ye, J., Faircloth, B. C., Remm, M., et al. (2012) Primer3--new capabilities and interfaces. Nucleic Acids Res., 40, e115.
Van der Biezen, E. A. and Jones, J. D. (1998) Plant disease-resistance proteins and the gene-for-gene concept. Trends Biochem. Sci., 23, 454-456.
van der Biezen, E. A., Sun, J., Coleman, M. J., Bibb, M. J. and Jones, J. D. (2000) Arabidopsis RelA/SpoT homologs implicate (p)ppGpp in plant signaling. Proc. Natl. Acad. Sci. U.S.A., 97, 3747-3752. Vandesompele, J., De Preter, K., Pattyn, F., Poppe, B., Van Roy, N., De Paepe, A., et al. (2002)
Accurate normalization of real-time quantitative RT-PCR data by geometric averaging of multiple internal control genes. Genome Biol., 3, RESEARCH0034.
Wang, L., Tsuda, K., Truman, W., Sato, M., Nguyen le, V., Katagiri, F., et al. (2011) CBP60g and SARD1 play partially redundant critical roles in salicylic acid signaling. Plant J., 67, 1029-1041. Wildermuth, M. C., Dewdney, J., Wu, G. and Ausubel, F. M. (2001) Isochorismate synthase is required
to synthesize salicylic acid for plant defence. Nature, 414, 562-565.
Yamburenko, M. V., Zubo, Y. O. and Borner, T. (2015) Abscisic acid affects transcription of chloroplast genes via protein phosphatase 2C-dependent activation of nuclear genes: repression by guanosine-3'-5'-bisdiphosphate and activation by sigma factor 5. Plant J., 82, 1030-1041. Yang, Y. H., Dudoit, S., Luu, P., Lin, D. M., Peng, V., Ngai, J., et al. (2002) Normalization for cDNA
microarray data: a robust composite method addressing single and multiple slide systematic variation. Nucleic Acids Res., 30, e15.
Ye, J., Coulouris, G., Zaretskaya, I., Cutcutache, I., Rozen, S. and Madden, T. L. (2012) Primer-BLAST: a tool to design target-specific primers for polymerase chain reaction. BMC Bioinformatics, 13, 134.
Zhao, S. and Fernald, R. D. (2005) Comprehensive algorithm for quantitative real-time polymerase chain reaction. J. Comput. Biol., 12, 1047-1064.
Zhu, Q., Dugardeyn, J., Zhang, C., Takenaka, M., Kuhn, K., Craddock, C., et al. (2012) SLO2, a mitochondrial pentatricopeptide repeat protein affecting several RNA editing sites, is required for energy metabolism. Plant J., 71, 836-849.
Supporting information legends
Figure S1. OX:RSH3.2 plants show higher susceptibility to TuMV-GFP. 42 day old
wild-type (WT) and OX:RSH3.2 plants were agroinoculated on the first and second leaf with TuMV-GFP. TuMV-GFP multiplication was quantified in by calculating the area infected for each plant (area of GFP signal / area of plant), and data are presented as a box plot. The boxes show the interquartile range and median, the mean is indicated by a cross, and the whiskers delimit the 10th and 90th percentiles. **P<0.001 for WT versus OX:RSH3.2, Kruskal-Wallis test, n=21 plants for WT and 24 plants for OX:RSH3.2.
Figure S2. Free auxin levels in healthy and infected OX:RSH3.1 and QM2 plants. Auxin
levels were determined in the aerial parts of plants that were (a,c) not inoculated (NI) and grown under the same conditions as for TuMV-GFP inoculation or (b,d) two weeks after TuMV-GFP inoculation (TuMV). The averages of three biological replicates are shown for the NI plants, and six biological replicates for inoculated plants. * P<0.05, versus WT, Student t-test. Error bars, SEM.
Figure S3. OX:RSH1 resistance to TuMV-GFP is independent of inoculation method. 42
day old WT and OX:RSH1.10 plants were inoculated by rubbing the first and second leaves with a solution containing carborandum and TuMV-GFP virus particles. TuMV-GFP
multiplication was quantified in 23 inoculated plants of each genotype by calculating the area infected for each plant (area of GFP signal / area of plant), and data are presented as a box plot. The boxes show the interquartile range and median, the mean is indicated by a cross, and the whiskers delimit the 10th and 90th percentiles. Statistical significance was tested by the Kruskal-Wallis test and significantly different groups are indicated by letters for each time point **P<0.01, n=23 plants.
Figure S4. OX:RSH1 plants can escape from TuMV-GFP infection. A small proportion of
OX:RSH1 plants that showed TuMV-GFP accumulation at 19 days post inoculation had recovered at 35 days post inoculation. Recovery was visible as the loss of a GFP signal in the centre of the rosette, and the appearance of new non-chlorotic leaves without crinkled borders in the centre of the rosette.
Table S2. Downregulated genes in OX:RSH3.1 versus wildtype. Table S3. DAVID enrichment for upregulated genes in OX:RSH3.1. Table S4. DAVID clusters for OX:RSH3.1 upregulated genes.
Table S5. DAVID enrichment for downregulated genes in OX:RSH3.1. Table S6. DAVID clusters for OX:RSH3.1 downregulated genes. Table S7. SA responsive genes downregulated in OX:RSH3.1 plants. Table S8. Primers for gene expression analysis.
Table 1. DAVID enrichment for differentially expressed transcripts in OX:RSH3.1.
Category Term Count % P-value
OX:RSH3.1 significantly upregulated transcripts
GOTERM_CC_DIRECT Chloroplast 516 29.4 4.20E-70
GOTERM_BP_DIRECT chloroplast organization 65 3.7 1.60E-32
GOTERM_BP_DIRECT mRNA modification 49 2.8 8.40E-27
GOTERM_CC_DIRECT chloroplast stroma 117 6.7 3.50E-24
GOTERM_BP_DIRECT thylakoid membrane organization 64 3.6 3.90E-23
GOTERM_BP_DIRECT tRNA metabolic process 28 1.6 4.00E-22
GOTERM_BP_DIRECT rRNA processing 68 3.9 3.80E-21
GOTERM_BP_DIRECT pyrimidine ribonucleotide biosynthetic process 49 2.8 6.20E-21
INTERPRO Pentatricopeptide repeat 95 5.4 9.30E-20
GOTERM_BP_DIRECT iron-sulfur cluster assembly 41 2.3 3.10E-17
GOTERM_BP_DIRECT transcription from plastid promoter 32 1.8 1.70E-15
OX:RSH3.1 significantly downregulated transcripts
GOTERM_BP_DIRECT response to chitin 204 9.5 4.80E-100
GOTERM_BP_DIRECT regulation of plant-type hypersensitive response 176 8.2 4.70E-85
GOTERM_BP_DIRECT systemic acquired resistance 145 6.7 5.10E-84
GOTERM_BP_DIRECT protein targeting to membrane 176 8.2 1.10E-80
GOTERM_BP_DIRECT negative regulation of defense response 145 6.7 1.30E-78
GOTERM_BP_DIRECT salicylic acid biosynthetic process 124 5.7 3.80E-73
GOTERM_BP_DIRECT respiratory burst involved in defense response 91 4.2 1.30E-66
GOTERM_BP_DIRECT negative regulation of programmed cell death 105 4.9 1.70E-65
GOTERM_BP_DIRECT salicylic acid mediated signaling pathway 127 5.9 4.40E-64
GOTERM_BP_DIRECT MAPK cascade 116 5.4 5.80E-62
Figure Legends
Figure 1. OX:RSH3.1 plants are more susceptible to TuMV-GFP infection. 42 day old
wild-type (WT) and OX:RSH3.1 plants were agroinoculated on the first and second leaf with TuMV-GFP. (a) Systemic TuMV-GFP multiplication was visualized using fluorescence imaging at 12, 14 and 16 days post inoculation (dpi). Representative images are shown from one experiment. Fluorescence intensity is shown in false color. (b) TuMV-GFP multiplication was quantified in twenty inoculated plants of each genotype by calculating the area infected for each plant (area of GFP signal / area of plant), and data are presented as a box plot. The boxes show the interquartile range and median, the mean is indicated by a cross, and the whiskers delimit the 10th and 90th percentiles. * P<0.05, **P<0.01 for WT versus
OX:RSH3.1, Kruskal-Wallis test, n=20. Similar results were obtained in three independent repeats of the experiment.
Figure 2. Pathogen responses in TuMV-GFP infected wild-type and OX:RSH3.1 plants.
(a) qRT PCR for the indicated transcripts was performed on cDNA derived from the systemic leaves of mock inoculated (MOCK) or TuMV-GFP inoculated plants (TuMV) 16 days after inoculation. Four biological replicates were used for MOCK and six for TuMV. Transcript abundance was normalized to APT1 and PP2A reference transcripts. (b) Immunoblots on equal quantities of total protein from plants two weeks after mock or TuMV inoculation using the indicated antibodies. The loading control is the RuBISCO large subunit stained with Coomassie Brilliant Blue (CBB). Free SA levels were determined in the aerial parts of (c) healthy non-inoculated plants (NI) grown under the same conditions as for TuMV-GFP inoculation (n= 3 independent plants) or (d) TuMV-GFP inoculated plants two weeks after inoculation (n= 6 independent plants. * P<0.05, **P<0.01 for WT versus OX:RSH3.1, ANOVA. Error bars, SEM.
Figure 3. RSH mutants are more resistant to TuMV-GFP infection. 42 day old WT, QM1
and QM2 plants were agroinoculated on the first and second leaf with TuMV-GFP. (a) Systemic TuMV-GFP multiplication was visualized using fluorescence imaging at 12, 14 and 16 days post inoculation (dpi). Representative images are shown from one experiment. Fluorescence intensity is shown in false color. (b) TuMV-GFP multiplication was quantified in fourteen inoculated plants of each genotype by calculating the area infected for each plant (area of GFP signal / area of plant), and data are presented as a box plot. The boxes show the
interquartile range and median, the mean is indicated by a cross, and the whiskers delimit the 10th and 90th percentiles. Statistical significance was tested by the Kruskal-Wallis test and significantly different groups are indicated by letters for each time point (P<0.05, n=14). Similar results were obtained in three independent repeats of the experiment.
Figure 4. Pathogen responses in TuMV-GFP infected wild-type and QM2 plants. (a) qRT
PCR for the indicated transcripts was performed on cDNA derived from the systemic leaves of mock inoculated (MOCK) or TuMV-GFP inoculated plants (TuMV) 16 days after
inoculation. Four biological replicates were used for MOCK and six for TuMV. Note that no RSH1, RSH2 or RSH3 amplicons accumulated in QM2 due to the presence of T-DNA insertions in these genes. Transcript abundance was normalized to APT1 and PP2A reference transcripts. Immunoblots on equal quantities of total protein from (b) plants two weeks after mock or TuMV inoculation using the indicated antibodies, or (c) from non-inoculated plants of the same age. The loading control is the RuBISCO large subunit stained with Coomassie Brilliant Blue (CBB). Free SA levels were determined in the aerial parts of (d) healthy non-inoculated plants (NI) grown under the same conditions as for TuMV-GFP inoculation (n= 3 independent plants) or (e) TuMV-GFP inoculated plants two weeks after inoculation (n= 6 independent plants). * P<0.05, **P<0.01 versus WT, ANOVA. Error bars, SEM.
Figure 5. OX:RSH1 plants are more resistant to TuMV-GFP infection. 42 day old WT
and OX:RSH1 plants were agroinoculated on the first and second leaf with TuMV-GFP. (a) Systemic TuMV-GFP multiplication was visualized using fluorescence imaging at 12, 14, 16 and 19 days post inoculation (dpi). Representative images are shown from one experiment. Fluorescence intensity is shown in false color. (b) TuMV-GFP multiplication was quantified in 24 inoculated plants of each genotype by calculating the area infected for each plant (area of GFP signal / area of plant), and data are presented as a box plot. The boxes show the interquartile range and median, the mean is indicated by a cross, and the whiskers delimit the 10th and 90th percentiles. Statistical significance was tested by the Kruskal-Wallis test and significantly different groups are indicated by letters for each time point (*P<0.05, **P<0.01, n=24 plants). Similar results were obtained in three independent repeats of the experiment.
Figure 1. OX:RSH3.1 plants are more susceptible to TuMV-GFP infection. 42 day old wild-type (WT) and OX:RSH3.1 plants were agroinoculated on the first and second leaf with TuMV-GFP. (a) Systemic TuMV-GFP
multiplication was visualized using fluorescence imaging at 12, 14 and 16 days post inoculation (dpi). Representative images are shown from one experiment. Fluorescence intensity is shown in false color. (b) TuMV-GFP multiplication was quantified in twenty inoculated plants of each genotype by calculating the area
infected for each plant (area of GFP signal / area of plant), and data are presented as a box plot. The boxes show the interquartile range and median, the mean is indicated by a cross, and the whiskers delimit the
10th and 90th percentiles. * P<0.05, **P<0.01 for WT versus OX:RSH3.1, Kruskal-Wallis test, n=20. Similar results were obtained in three independent repeats of the experiment.
Fig. 1
80x102mm (300 x 300 DPI)
Figure 2. Pathogen responses in TuMV-GFP infected wild-type and OX:RSH3.1 plants. (a) qRT PCR for the indicated transcripts was performed on cDNA derived from the systemic leaves of mock inoculated (MOCK)
or TuMV-GFP inoculated plants (TuMV) 16 days after inoculation. Four biological replicates were used for MOCK and six for TuMV. Transcript abundance was normalized to APT1 and PP2A reference transcripts. (b)
Immunoblots on equal quantities of total protein from plants two weeks after mock or TuMV inoculation using the indicated antibodies. The loading control is the RuBISCO large subunit stained with Coomassie Brilliant Blue (CBB). Free SA levels were determined in the aerial parts of (c) healthy non-inoculated plants (NI) grown under the same conditions as for GFP inoculation (n= 3 independent plants) or (d)
TuMV-GFP inoculated plants two weeks after inoculation (n= 6 independent plants. * P<0.05, **P<0.01 for WT versus OX:RSH3.1, ANOVA. Error bars, SEM.
Fig. 2
159x178mm (300 x 300 DPI)
Figure 3. RSH mutants are more resistant to TuMV-GFP infection. 42 day old WT, QM1 and QM2 plants were agroinoculated on the first and second leaf with TuMV-GFP. (a) Systemic TuMV-GFP multiplication was visualized using fluorescence imaging at 12, 14 and 16 days post inoculation (dpi). Representative images are shown from one experiment. Fluorescence intensity is shown in false color. (b) TuMV-GFP multiplication was quantified in fourteen inoculated plants of each genotype by calculating the area infected for each plant (area of GFP signal / area of plant), and data are presented as a box plot. The boxes show the interquartile range and median, the mean is indicated by a cross, and the whiskers delimit the 10th and 90th percentiles.
Statistical significance was tested by the Kruskal-Wallis test and significantly different groups are indicated by letters for each time point (P<0.05, n=14). Similar results were obtained in three independent repeats of
the experiment. Fig. 3
80x126mm (300 x 300 DPI)
Figure 4. Pathogen responses in TuMV-GFP infected wild-type and QM2 plants. (a) qRT PCR for the indicated transcripts was performed on cDNA derived from the systemic leaves of mock inoculated (MOCK) or TuMV-GFP inoculated plants (TuMV) 16 days after inoculation. Four biological replicates were used for MOCK and six for TuMV. Note that no RSH1, RSH2 or RSH3 amplicons accumulated in QM2 due to the presence of
T-DNA insertions in these genes. Transcript abundance was normalized to APT1 and PP2A reference transcripts. Immunoblots on equal quantities of total protein from (b) plants two weeks after mock or TuMV
inoculation using the indicated antibodies, or (c) from non-inoculated plants of the same age. The loading control is the RuBISCO large subunit stained with Coomassie Brilliant Blue (CBB). Free SA levels were determined in the aerial parts of (d) healthy non-inoculated plants (NI) grown under the same conditions as
for TuMV-GFP inoculation (n= 3 independent plants) or (e) TuMV-GFP inoculated plants two weeks after inoculation (n= 6 independent plants). * P<0.05, **P<0.01 versus WT, ANOVA. Error bars, SEM.
Fig. 4
150x186mm (300 x 300 DPI)
Figure 5. OX:RSH1 plants are more resistant to TuMV-GFP infection. 42 day old WT and OX:RSH1 plants were agroinoculated on the first and second leaf with TuMV-GFP. (a) Systemic TuMV-GFP multiplication was
visualized using fluorescence imaging at 12, 14, 16 and 19 days post inoculation (dpi). Representative images are shown from one experiment. Fluorescence intensity is shown in false color. (b) TuMV-GFP multiplication was quantified in 24 inoculated plants of each genotype by calculating the area infected for each plant (area of GFP signal / area of plant), and data are presented as a box plot. The boxes show the interquartile range and median, the mean is indicated by a cross, and the whiskers delimit the 10th and
90th percentiles. Statistical significance was tested by the Kruskal-Wallis test and significantly different groups are indicated by letters for each time point (*P<0.05, **P<0.01, n=24 plants). Similar results were
obtained in three independent repeats of the experiment. Fig. 5
159x222mm (300 x 300 DPI)