HAL Id: tel-02430956
https://tel.archives-ouvertes.fr/tel-02430956v2
Submitted on 9 Jun 2020HAL is a multi-disciplinary open access archive for the deposit and dissemination of sci-entific research documents, whether they are pub-lished or not. The documents may come from teaching and research institutions in France or abroad, or from public or private research centers.
L’archive ouverte pluridisciplinaire HAL, est destinée au dépôt et à la diffusion de documents scientifiques de niveau recherche, publiés ou non, émanant des établissements d’enseignement et de recherche français ou étrangers, des laboratoires publics ou privés.
Study of the cost of measuring virtualized networks
Karyna Gogunska
To cite this version:
Karyna Gogunska. Study of the cost of measuring virtualized networks. Networking and Inter-net Architecture [cs.NI]. COMUE Université Côte d’Azur (2015 - 2019), 2019. English. �NNT : 2019AZUR4077�. �tel-02430956v2�
Etude du coût de mesure des réseaux
virtualisés
Karyna GOGUNSKA
Inria Sophia Antipolis
Présentée en vue de l’obtention
du grade de docteur en INFORMATIQUE d’Université Côte d’Azur
Dirigée par : Chadi Barakat / Guillaume Urvoy-Keller Soutenue le : 18/12/2019
Devant le jury, composé de :
Hossam AFIFI, Professeur, Télécom SudParis
André-Luc BEYLOT, Professeur, IRIT/ENSEEIHT Pietro Michiardi, Professeur, Eurecom
Chadi Barakat, Directeur de Recherche (DR), Inria Guillaume Urvoy-Keller, Professeur, I3S/CNRS
Etude du coût de mesure des réseaux
virtualisés
Jury :
Rapporteurs
Hossam AFIFI, Professeur, Télécom SudParis
André-Luc BEYLOT, Professeur, IRIT/ENSEEIHT
Examinateur
Pietro Michiardi, Professeur, Eurecom
Directeur
Chadi Barakat, Directeur de Recherche, Inria
Co-directeur
Resume
La tendance actuelle dans le développement et le déploiement d’applications consiste à les embarquer dans des machines virtuelles ou des conteneurs. Il en résulte une combinaison de configurations de réseaux physiques et virtuels combinant des commutateurs virtuels et physiques avec des protocoles spécifiques pour créer des réseaux virtuels s’étendant sur plusieurs serveurs. Ce nouvel environnement constitue un défi lorsqu’il s’agit de mesurer et de debuguer les problèmes liés aux performances.
Dans cette thèse, nous examinons le problème de la mesure du trafic dans un environ-nement virtuel et nous nous concentrons sur un scénario typique : des machines virtuelles interconnectées par un commutateur virtuel. Nous avons étudié le coût de la mesure en continu du trafic réseau des machines. Plus précisément, nous avons évalué le cout du partage du substrat physique entre la tâche de mesure et l’application. Nous avons dans un premier confirmé l’existence d’une corrélation négative entre la mesure et le trafic applicatif.
Dans une seconde partie de la thèse, nous avons orienté notre travail vers une minimisa-tion de l’impact des mesures en utilisant des techniques d’apprentissage automatiques en temps réel. Nous avons proposé une solution basée sur les données, capable de fournir des paramètres de surveillance optimaux pour les mesures de réseau virtuel avec un minimum d’interférence pour le trafic applicatif.
Mot-clé: Réseau virtualisé, Mesure, Surveillance, Open vSwitch, Centre de Don-nées, Apprentissage Machine, sFlow, IPFIX
Abstract
The current trend in application development and deployment is to package applications within containers or virtual machines. This results in a blend of virtual and physical resources with complex network setups mixing virtual and physical switches along with specific protocols to build virtual networks spanning over several servers. While this complexity is often hidden by cloud management solutions, such new environment constitutes a challenge when it comes to monitor and debug performance-related issues. In this thesis, we consider the problem of measuring traffic in a virtualized environment and focus on one typical scenario: virtual machines interconnected with a virtual switch. We assess the cost of continuously measuring the network traffic of the machines. Specifically, we seek to estimate the competition that exists to access the resources (e.g., CPU) of the physical substrate between the measurement task and the application. We confirm the negative correlation of measurement within such setup and propose actions towards its minimization. Concluding on the measurement interference with virtual network, we then turn our work towards minimizing its presence in the network. We assess the capability of machine learning techniques to predict the measurement impact on the ongoing traffic between virtual machines. We propose a data-driven solution that is able to provide optimal monitoring parameters for virtual network measurements with minimum traffic interference.
Keywords: Virtual Network, Measurement, Monitoring, Open vSwitch, Data Cen-ter, Machine Learning, sFlow, IPFIX
Acknowledgements
This thesis summarizes my research results during my PhD study at the research team DIANA, Inria, France from 2016 to 2019.
First of all, I express my gratitude to my advisors Prof. Guillaume Urvoy-Keller and Dr. Chadi Barakat, who walked me through these three years and contributed to my development as a young scientist. Thank you for putting your effort, time and patience in me, so that I end up at this point.
I sincerely thank all my colleagues and friends in SigNet and DIANA team. Being a part of Inria and I3S let me meet great people from all over the world, who brightened up my days in France, especially Dr. Dimitra Politaki, Dr. Osama Arouk, Dr. Mathijs Wintraeken, Lyes Khacef, Dimitra Tsigkari, Dr. Tingting Yuan, Dr. Zeineb Guizani, Dr. Olexandra Kulankhina, Thierry Spetebroot, Dr. Naoufal Mahfoudi, Dr. Hardik Soni.
I thank Christine Foggia for her great competence and immense help in a variety of subjects.
I thank Prof. Deep Medhi for showing his interest and questioning my research. It is amazing, how meeting him once per year was enough to boost my interest in science.
Special thank goes to Dr. Damien Saucez. Thank you for your timely support and help, conversations, lunches, hikings, experiences and knowledge.
Finally, I dedicate this thesis to Dr. Vitalii Poliakov, my favorite person in the world, my inspiration and my role model. Thank you for believing in me, for lifting up my morale level for so many times, for rising up my confidence to pursue the objective of becoming a PhD and for being at my side since 2012.
Table of contents
List of figures xiii
List of tables xv
1 Overview 1
1.1 Network softwarization . . . 1
1.2 Software network monitoring . . . 3
1.3 Problem statement . . . 5
1.3.1 Contributions . . . 7
1.4 Thesis Outline . . . 8
1.5 List of Publications . . . 9
1.6 Awards and distinctions . . . 9
2 Monitoring Virtualized Networks: State-of-the-art 11 2.1 Generalities on network virtualization and monitoring . . . 11
2.1.1 System virtualization . . . 11
2.1.2 Network virtualization . . . 14
2.1.3 Monitoring the virtual network . . . 18
2.2 Monitoring in the cloud-based environment . . . 20
2.2.1 Cloud infrastructure monitoring . . . 21
2.2.2 Network monitoring in cloud . . . 22
2.3 Monitoring in SDN-based environment . . . 25
2.3.1 SDN control plane monitoring . . . 25
2.3.2 SDN data plane monitoring . . . 26
2.4 SFlow and IPFIX overview . . . 30
x Table of contents
2.6 Machine learning in network measurement . . . 40
2.6.1 Introduction to machine learning . . . 40
2.6.2 Machine learning and networking . . . 43
3 Influence of Measurement on Virtual Network Performance 47 3.1 Introduction . . . 47
3.2 Test environment . . . 49
3.2.1 Testbed . . . 49
3.2.2 Traffic workload . . . 50
3.3 Measuring with sFlow . . . 52
3.3.1 Initial experiment: measurement plane vs. data plane . . . 52
3.3.2 Resources consumption and competition . . . 53
3.3.3 High sampling rate anomaly . . . 54
3.3.4 Varying sFlow parameters . . . 57
3.4 Measuring with IPFIX . . . 60
3.4.1 Running IPFIX without flow aggregation . . . 60
3.4.2 Introducing cache and flow aggregation . . . 62
3.5 Conclusion and discussion . . . 63
4 Tuning Optimal Traffic Measurement Parameters in Virtual Networks with Machine Learning 65 4.1 Introduction . . . 65
4.2 Dataset construction and methodology . . . 67
4.2.1 Methodology . . . 67
4.2.2 Dataset . . . 68
4.3 Offline analysis . . . 71
4.3.1 Detecting the impact of monitoring . . . 71
4.3.2 Quantifying the impact . . . 75
4.4 Online analysis . . . 76
4.4.1 Predicting the drop in throughput . . . 78
4.4.2 Finding optimal monitoring parameters . . . 79
4.5 Conclusion and Discussion . . . 79
5 Conclusions and Future work 81 5.1 Conclusions . . . 81
Table of contents xi
5.2 Future work . . . 83
List of figures
2.1 Virtual network: physical and virtual view. . . 15
2.2 OvS data path . . . 17
2.3 sFlow architecture1 . . . 31
2.4 sFlow agent embedded in hardware switch3 . . . 32
2.5 sFlow measurement process in virtual switch . . . 32
3.1 Testbed for experimentation . . . 50
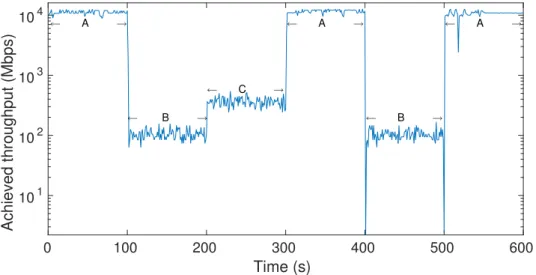
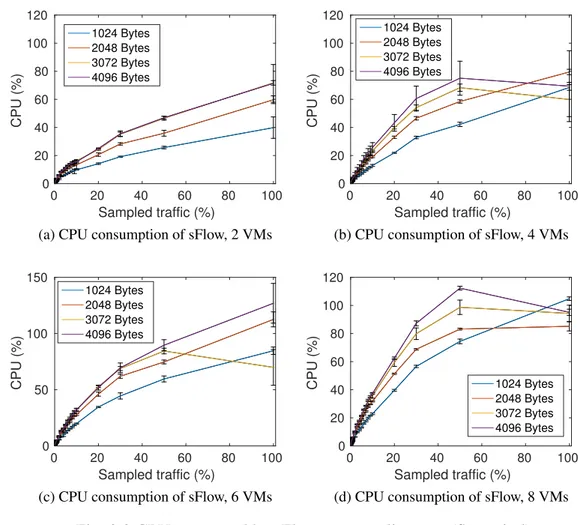
3.2 iPerf3 throughput at different sampling rates of sFlow: no sampling (A), 100% sampling (B), 50% sampling (C). . . 53
3.3 CPU consumed by sFlow vs. sampling rate (flowgrind) . . . 54
3.4 Nb. of packets generated vs. sampling rate (flowgrind) . . . 55
3.5 CPU load with/without pinning OvS to specific core . . . 57
3.6 OvS architecture with sFlow measurement process . . . 58
3.7 CPU consumed by sFlow for different header lengths and different sampling rates . . . 59
3.8 CPU consumed by sFlow for different polling intervals . . . 60
3.9 IPFIX vs. sFlow resource consumption . . . 61
3.10 iPerf3 throughput at different sampling rates of IPFIX: no sampling (A), 100% sampling (B), 50% sampling (C). . . 62
4.1 Traffic throughput at different sampling rates of sFlow: no sampling (A), 100% sampling (B), 50% sampling (C). . . 67
4.2 Sampling impact vs. sampling rate and number of VMs . . . 70
4.3 Unbalanced dataset: classes distribution vs threshold . . . 71
4.4 Accuracy of different classifiers vs impact threshold for unbalanced (4.4a) and balanced (4.4b) datasets. . . 72
xiv List of figures
4.5 Precision/recall for each class with respect to threshold (YES - impact is
present, NO - impact is absent) and classifier: balanced dataset. . . 73
4.6 Feature importance Decision Tree 4.6a Random Forest 4.6b . . . 75
4.7 Accuracy delta with VM feature eliminated from dataset . . . 76
4.8 MAE of regression for online global & local & offline . . . 78
4.9 Throughput drop at estimated optimal sampling rate: global workload (4.9a) and local workload (4.9b). . . 80
List of tables
2.1 Monitoring tools . . . 33 3.1 Flowgrind parameters used for traffic generation . . . 51 3.2 iPerf3 parameters used for traffic generation . . . 52
Chapter 1
Overview
1.1
Network softwarization
The evolution of the Internet and its ubiquitous adoption in nearly every level of our society have opened a whole new domain for communication providers. Their interest in profit motivates the invention of new technologies and services for individual users just as well as for the enterprises. Internet by its very definition is a large-scale, global network. While it was arguably easier to organize such a network in its early days, when the subscribers were not-so-numerous and rather predictable in their behaviour, the newly-arrived Internet Service Providers (ISPs) started to struggle scaling up their facilities for huge crowds of users when the Internet stepped into its late stages of adoption. At a certain point, such networks became subject to scalability constraints and problematic maintenance of numerous protocols within purpose-built networking devices, that have to be configured one by one, requiring physical presence at the site. Enterprises networks started organizing into logically separated networks within their facilities given by the Infrastructure Provider (InPs). Meanwhile, Service Providers (SPs) were aggregating resources from multiple InPs and offering end-to-end services. For the rapidly developing IT-market, there appeared a need to share physical resources in an efficient manner while ensuring isolation. This was the reasoning invention of virtualization, hypervisors and containerization systems. Additionally, the aforementioned issues with legacy networks lead in a part to the appearance of network softwarization and virtualization, which aimed at breaking the chains of fixed-role network architectures and allow more flexibility in network design.
2 Overview
In general, virtualization is used to transform available hardware into a software envi-ronment. It first appeared to serve the purpose of shared computer resources among a large group of users and brought multiple advantages since then to the computer science domain. Virtualization has an important role in cloud computing technologies. Virtualization is a kind of abstraction to make software object or resource to behave and look like a hardware-implemented one, but with significant advantages in flexibility, cost, efficiency, scalability and wide range of applications and general capabilities. With the advent of virtualization technologies and subsequent discovery of their advantages, Internet research and industries have ventured to study and experiment with virtualizing every component of a computing system – from the computers as a whole (Virtual Machine, VM) to its individual subsystems (storage, networking, and so on).
A virtual machine is a software imitation of a computer system with its imitated hardware (processor memory, hard disk, etc.), which is based on another operating system built upon a hardware entity. One could think of it as a kind of a software duplicate of a real machine [1]. Virtual machines are not aware of the underlying system where they are deployed, and they can only use as much physical resources as dedicated by the underlying host operating system, which ensures isolation of resources and prevents any interference of co-hosted VMs and native system. The functionality of VMs is equal to the functionality of its operating system. It can implement certain applications, functions or services, and act as a programming emulator or simulator. Cloud providers are direct beneficiaries of virtualization, as they deliver hosted applications and services over the Internet. Such applications and services can be accessed from across the globe thanks to the cooperation of virtualization and networking. Virtualization also helps cloud service providers in achieving isolation and resource multiplexing.
Network virtualization combines resources of physical servers and networks into software networks between virtual machines. These software networks share the same underlying physical infrastructure and become an efficient tool for new application deployment, accessi-bility, and scalability of resources and services deployed in such virtual environments, as well as automation and energy saving. Networking functions and networking equipment can be softwarized as well. Network function virtualization (NFV) and software switches took the functionality of physical devices and now enable Internet traffic processing by software programs in order to accelerate deployment of network services and cope with demanding and rapidly changing needs from network users and administrators. Network under
virtual-1.2 Software network monitoring 3
ization becomes a sophisticated system where high-level applications are deployed inside virtualized operating systems (VMs), which can be organized into a virtual network with software switches and software network functions. All these virtual components are based on a host operating system (hypervisors and cloud management systems like OpenStack [2]), that handles this virtual domain plus the whole operation of a hardware server, which is only a single node in a typically large network alongside with other servers and network equipment. This is what a typical data center would look like nowadays.
In the quest of searching for simple and flexible network administration, the concept of Software-Defined Networking attracted the attention of the Internet and cloud actors. Software-Defined Networking (SDN) is a paradigm of decoupling network control and management from traffic forwarding. In a network that is implemented using the SDN paradigm, an administrator can now issue network administration and configuration from a centralized controller, which has access to all network devices. Compared to the traditional, individual administration approach, the required device configurations are applied, necessary policies are set, the forwarding rules are issued in a more transparent, efficient and less time-consuming manner. In such a way, administration operations are communicated to the devices not directly but using an application programming interface (API), such as OpenFlow [3] and Cisco OpFlex [4], which provides better visibility, efficiency, and flexibility to the network management.
Virtualization, SDN, and clouds are uniting towards the goal of IT softwarization, which relies on software programs to satisfy the demands of network services. The interoperation of such solutions inevitably leads to increasing the overall complexity of the entire system. On the other hand, the complexity of such a system is justified by the level of technological progress achieved and the profit obtained.
This thesis will present our findings as to how to ensure proper monitoring of one of the crucial components of this united system: the network subsystem.
1.2
Software network monitoring
Almost any kind of a sizeable business nowadays makes an extensive use of networking technologies. Running such a business is often associated with ensuring the integrity and security of the commercial data, as well as guaranteeing timely delivery of the product. If
4 Overview
we apply this observation to an Internet services-related business, the product becomes the service itself. In such a case it becomes crucial to have extended visibility into the operation of the internal network, as this is what defines the client agreement compliance (Service Level Agreement, SLA) and other important business goals.
Depending on the size and complexity of the network, achieving such visibility can be-come difficult already due to the amount of incoming information. When we start considering softwarization and virtualization in the networks, management, and monitoring gain a whole new dimension of complexity. As a brief example, let us consider a virtual network client and the way its network traffic can make before reaching the destination: after being issued from its network socket, traffic will have to traverse software network equipment (e.g., a software switch on the host operating system), then exit virtual networking interface, entering physical equipment and interfaces, isolated by means of VXLAN (virtual extensible local access network) tunneling, leaving the local network and travel throughout the physical network – which can make use of NFV and, therefore, involve other virtualized segments. Our virtual client’s traffic monitoring now includes monitoring of virtual network (equipment and traffic) and virtual hosts, plus the monitoring of the aforementioned software and hardware parts of the virtualization platform, which will include monitoring of the underlying network as well. With the increasing use of virtualization, the number of measurement endpoints can grow quickly.
Monitoring the virtualization platform is vital for providers to assure a decent level of services, yet it is complex and challenging, as now it includes both monitoring the software component (that enables virtualization), and physical component where it is deployed. Two-fold amount of problems has to be detected and handled: software faults may be results of improper configurations just as well as hardware issues, or an insufficient amount of system resources can lead to obscured failures of virtualization (and not only) applications. Great effort has to be devoted to monitoring, observing all aspects of the virtual environment, preventing, detecting, localizing and resolving problems. Aiming to propose the best moni-toring tools, the state-of-the-art solutions for network monimoni-toring often contain investigations of the amount of resources they consume (network- and/or systems-wise) [5], [6], [7], [8], [9]. Even though it seems difficult to monitor an infrastructure seamlessly and without a trace, modern research continues to excel at minimizing monitoring overheads. Researches consider different kinds of the effect of their monitoring frameworks within an evaluation setup (delay-. report-, bandwidth-, memory-wise, etc.). Yet, the evaluation phase may not
1.3 Problem statement 5
reveal all pitfalls of such effects. To obtain a full picture, the monitoring tool would have to be checked in operation with all its possible configurations within all possible setups. It is problematic to anticipate under which setup (number of VMs, amount of traffic, the criticality of application SLAs) the tool will be used. Also, it may be quite challenging to perform tests within all the configuration scenarios. Nonetheless, it would be beneficial for end-user, DevOps and network/system administrators to obtain a general idea of monitoring tool behaviour in the setup with respect to its parameters, its application, virtual network components operation (VMs, their application performance, software switch), and hardware components (server and network performance). Throughout the state-of-the-art multiple proposals of monitoring techniques and methods exist, that we have reviewed in Chapter 2. Yet, there was no explicit exploration of the scope of the footprint of monitoring tool parameters at work in the virtual network setup.
1.3
Problem statement
Driven by the aforementioned two-fold kind of problems and shortage of its study, we have ventured to shed more light on the monitoring processes in virtual networks and their effect onto operation of the virtual network themselves, as well as their physical hardware – in terms of system resource consumption. More specifically, the main question is whether and to which extent certain monitoring solutions, that run over a virtual network, affect the performance in terms of system and, in its turn, network resources.
Unfortunately, so far there exists no universal all-purpose monitoring framework, that could be applied to all virtualization platforms (or, at least, a broad range of them), while comprising traditional and virtual networks, devices and applications, and covering all kinds of needs for users and operators at the same time. That is why numerous monitoring solutions are developed for specific needs of certain platforms, often poorly applicable in different setups: some works are developed for use with the most popular platforms, however, their claim to be cross-platform compatible and deployable is rarely performed and verified, e.g., [10]. Such a shortage of cross-platform monitoring tools makes it difficult for cloud providers and users to efficiently manage their monitoring tasks for virtualized networks. Having a better insight on the effect of monitoring onto physical resources of the hosting hardware has
6 Overview
the potential to help them better estimate and adapt the existing monitoring tools for their specific needs.
Understanding the monitoring footprint in this scenario helps to achieve more efficient resource management, thus improving reliability and decreasing operational costs of the system. By knowing the nature and extent of the correlation between monitoring and the monitored system in a virtualized environment, one could gain an opportunity to better control the monitoring effects and overhead and take measures towards its minimization. We aim to achieve this goal in the presented thesis.
Studying the effects and overhead of monitoring benefits all the network actors. Operators, providers, and administrators could understand better the monitoring tool capabilities, and thus be able to better profit from the advantages the tool is able to provide – while also being aware of its weak sides. Possessing such information can help to anticipate resource consumption, advancing capacity planning, obtaining facilitated network management, and delivering better service for the end-user. From a user/tenant point of view, being aware of monitoring footprint can help to maintain their applications, machines, and networks, analyzing the nature of problems, whether they appear due to their action or to those inherent to the service itself.
On the way to revealing how system resources are shared among monitoring and virtual network, both implemented within the same hardware, we follow an experimental approach. We install an experimental testbed representing the study object: the virtual network exposed to the traffic monitoring, all deployed on top of the hardware server.
For the purpose of our study we chose monitoring tools widely used in both virtual networks and traditional networks, supported in virtualized and hardware networking envi-ronments:
• sFlow [11] – a packet-level monitoring tool for high-speed switched networks. It is implemented in Open vSwitch and provides monitoring by sampling the ongoing traffic and composing the statistics at remote node. More details in Section 2.3.2; • IPFIX [12] – a monitoring framework for flow-level information collection. In virtual
environment is implemented in Open vSwitch as well. More details in Section 2.3.2. Depending on the monitoring needs and network setup, these tools are able to provide monitoring for traffic between virtual nodes as well as physical nodes. These monitoring
1.3 Problem statement 7
tools were initially developed for hardware switches and routers to monitor traffic at the packet and flow level. They enable monitoring for high speed switched networks and fulfill well the required monitoring objectives (network performance, billing, troubleshooting, and others). With the appearance of a software switch, such tools and their functionalities started to be used in virtual networking equipment.
Additionally, the functionality of sFlow and IPFIX, namely sampling, allows to control the amount of measurements to be performed. Sampling can greatly reduce the cost of measurement in terms of secondary produced data, networking resources for its transporting and datacenter facilities for its storage. It is useful especially depending on the size of the datacenter network and number of cloud tenants and their traffic. As an example, Facebook continuously monitors its data centers servers at a rate of 1 out of 30,000 packets with a tool akin to sFlow [13]. Such rates of monitoring may not be suitable for smaller networking player. Thus the necessity to calibrate the measurement arises and brings additional challenges to network monitoring.
The ability of these tools to serve numerous monitoring objectives and to perform multiple monitoring functions, as well as their integration in the mostly used virtual switch, motivated the research work in this thesis.
1.3.1
Contributions
This thesis tackles the issue of system resource consumption of virtual network monitoring and proposes a solution to tune monitoring parameters so as to control its interference with application traffic. Our contributions are listed below:
• We provide an overview of virtual networking and describe the state-of-the-art solutions for monitoring of various aspects of virtual networks: from infrastructure-level to network performance monitoring in clouds and SDN-based environments;
• We explore the system resources consumption of typical monitoring processes run in virtual switches in terms of network-related and server-related resources;
• We demonstrate the existence of a negative correlation between the monitoring tasks and the operational traffic in the network under flow- and packet-level monitoring;
8 Overview
• We analyze this effect with regard to system resource usage and show that such an effect is not caused by a lack of server resources;
• We provide an overview of scientific works, proposing to leverage machine learning algorithms for benefits in the area of networking and its monitoring;
• In order to minimize the overhead of virtual network monitoring, we propose a solution based on Machine Learning to (i) identify a potential drop in throughput due to traffic measurement and (ii) automatically tune monitoring parameters so as to limit the measurement and traffic interference in the virtual environment.
1.4
Thesis Outline
In this Chapter 1 we described the notion of network softwarization and the need for its monitoring. We revealed the rationale behind our work in this domain and explained how important and challenging monitoring becomes in the scope of virtual networks, especially with relation to resource management. We briefly summarized the issues that we consider in this thesis and listed our main contributions. The rest of this manuscript is structured as follows:
In Chapter 2 we explore network measurements performed in a virtualized environment and what virtual network represents by itself. We briefly present different virtualization solutions and platforms. We explore the peculiarities of network measurement in virtual networks, clouds, and SDN. We provide a categorized list of the existing contributions of the research community in these areas. Furthermore, we discuss how machine learning techniques rush into virtual networking and networking measurement.
In Chapter 3 we first describe our experimental testbed, next we present the results of our experimentation with two measurement tools deployed into virtual network and the effect of virtual network measurement process on system resources.
In Chapter 4 following our discovery of measurement interference with a virtual network, we head towards avoidance of such interference by means of machine learning. In this chapter, we first describe how we collect a dataset of measurements to use it further to build machine learning models and then obtain a solution that can propose such monitoring parameters to control the level of measurement footprint in the network.
1.5 List of Publications 9
1.5
List of Publications
• International conferences
– K.Gogunska, C.Barakat, G.Urvoy-Keller, and Dino Lopez-Pacheco, "On the cost of measuring traffic in a virtualized environment", in IEEE CloudNet, 2018.
– K.Gogunska, C.Barakat, G.Urvoy-Keller, "Tuning optimal traffic measurement pa-rameters in virtual networks with machine learning", in IEEE CloudNet, 2019.
• Poster
– K.Gogunska, C.Barakat, G.Urvoy-Keller, and Dino Lopez-Pacheco, "Empowering virtualized networks with measurement as a service", in RESCOM, 2017.
1.6
Awards and distinctions
Best Student Paper Award at IEEE CloudNet 2018 for the paper "On the cost of measuring traffic in a virtualized environment".
Chapter 2
Monitoring Virtualized Networks:
State-of-the-art
2.1
Generalities on network virtualization and monitoring
2.1.1
System virtualization
The idea of system virtualization (in its modern interpretation) is to share hardware resources of a computer (which is called ”a host“) among multiple securely isolated operating systems (called ”guests“), by so establishing a pool of independent ”virtual“ computers within just one physical computing system instance. The advantages are plentiful:
• expenditures reduced: virtualization allows to exploit resources of hardware server to the full in a dynamic and efficient manner. For datacenter it means purchasing fewer servers and reducing their energy costs;
• better resource utilization: virtualization provides a natural way of co-locating multiple processing services, which greatly improves utilization ”density“ of the computing resources while maintaining their isolation and scalability;
• thin provisioning: virtualized components can be deployed at will on the host sys-tems, in reasonably little time. Such a property improves the resource utilization efficiency of the host hardware, allowing to dynamically dimension the number of virtual components according to their current demand.
12 Monitoring Virtualized Networks: State-of-the-art
System virtualization can be achieved in different ways. Nowadays, two main families of virtualization technologies can be identified: hardware virtualization, and operating system (OS)-level virtualization.
Hardware virtualization is implemented in the form of hypervisors. The first mentioning of hypervisor was in [1]. It was called a virtual machine monitor (VMM) and was defined as a piece of software, having three main characteristics:
1. ”the VMM provides an environment for programs which is essentially identical with the original machine;
2. programs running in this environment show at worst only minor decreases in speed; 3. the VMM is in complete control of system resources“.
Nowadays different virtualization players propose their own definition of the hypervisor. The authors of [14] considered several definitions of hypervisors and propose to define a hypervisor as: ”a thin software layer that provides an abstraction of hardware to the operating system by allowing multiple operating systems or multiple instances of the same operating system, termed as guests, to run on a host computer“. A considerable number of successful hypervisors are available today, and their differences are significant enough so as keep them in quite different niches:
• KVM/QEMU [15]. KVM/QEMU stands for the kernel-based virtual machine – open-source virtualization platform, which allows Linux kernel to perform functions of a hypervisor.
• VMware (VMware vSphere) [16]. VMware is a commercial virtualization project, which offers bare-metal virtualization and hosted virtualization. Desktop hypervisor software runs over Microsoft Windows, Linux, and macOS, whereas hypervisors for servers do not require an underlying operating system.
• Xen Project [17]. Xen is an open-source hypervisor. Except for hardware virtualization (XenServer/XCP[18]), it is mostly known for its paravirtualization mode, meaning that multiple operating systems can be executed on the same hardware at the same time.
2.1 Generalities on network virtualization and monitoring 13
• Hyper-V [19]. Hyper-V is a Microsoft hypervisor. It runs over Windows-based operating systems and has different architectural principles than those which derive from Linux.
• PowerVM [20]. PowerVM is an IBM server virtualization product. Commercial solutions provide numerous virtualization features regarding resource management, aggregation, migration, real-time information about virtualized workloads and many more.
• Vx32 [21]. Vx32 is a user-level sandbox for code execution. Vx32 runs on several popular operating systems, does not require kernel extensions or special privileges.
OS-level virtualization is a paradigm that implies the deployment of multiple isolated processes that can perform various functions within an operating system. One of its examples is containerization.
Container-based virtualization can be considered as a lightweight version of hypervisor virtualization: it performs isolation of the processes inside the operating systems – as opposed to the isolation of the entire OS in the hardware virtualization. A container in its simple form is a mere process with a restricted filesystem exposure, running in the host OS user space. The implementation of the mentioned filesystem exposure restriction is important, as it, in fact, implements the basic isolation. For instance, by presenting an ordinary directory as a root point to the container, programs that run within it would falsely consider having access to the entire filesystem. In comparison to usual filesystem permission, such a mechanism gives an opportunity to implement more extensive isolation of a process, while giving the contained programs full freedom to access their fictitious filesystem with no impact outside of it. While modern containers rely on more advanced mechanisms than the one presented above, root directory changing has been used quite extensively for smaller tasks (often within applications themselves) in UNIX-like systems since almost the inception of the UNIX, under the names of “chroot” and “jails”.
Being a process in the host user space, the container’s internal activity is competing for resources in the same way as other non-container processes. Being a process also gives containers the access level to the specific host hardware as for the host OS. These two properties free the containers from a need for a per-container guest operating system (and hence hypervisors), as well as from specific hardware pass-through mechanisms that often
14 Monitoring Virtualized Networks: State-of-the-art
pose a significant architectural challenge in hypervisors (for example, VirtualBox having limited support for graphical processing units). One of the main disadvantages of such an approach is that resource allocation and reservation becomes less trivial than for hypervisors, though technically possible to a certain extent. The lack of a guest OS environment to serve specific system calls to the containers also requires them to be compatible with the host OS: it is, therefore, not normally possible to host, for example, Linux-based containers in Windows host environment.
Nowadays, containerization is represented largely by the following utilities and softwares: Docker [22], LXC [23] , OpenVZ [24], chroot, FreeBSD Jails [25].
The goal of hypervisors and containerization remains the same, however, the underlying implementation differs, thus affecting different features from performance to the overhead of the platform. The comparison of hypervisors, their strength and weaknesses are explored in several works, e.g.:
• performance comparison of container-based and hypervisor virtualization: KVM, LXC, Docker and OSv [26];
• performance analysis of four virtualization platforms: Hyper-V, KVM, vSphere and XEN with regard to CPU, memory, disk and network resources [27].
Many cloud computing software solutions are developed on the basis of hypervisors -Apache CloudStack [28] (for creating, managing and deploying cloud infrastructure services), OpenStack [2] (for virtualization of servers and other resources for customer use), RHV [29] and oVirt [30] virtualization management platform.
2.1.2
Network virtualization
Network virtualization works as an abstraction that hides complex underlying network re-sources, enables resource isolation and encourages resource sharing for multiple network and application services [31]. This is usually achieved by virtualizing active network equipment so that their resources could be shared between multiple isolated overlays. This way of operating the network provides many benefits, such as portability, flexibility, and scalability – when compared to traditional, physical network environments. A typical virtual network
2.1 Generalities on network virtualization and monitoring 15
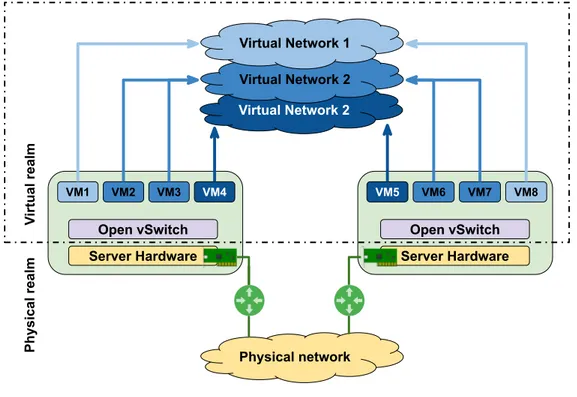
architecture is presented in Fig. 2.1. As presented in Fig. 2.1, physical servers intercon-nected by means of traditional networking devices organize a traditional network. Each of those servers by means of virtualization can be virtualized into several virtual machines interconnected by the virtual switch, uniting into virtual networks among available hardware servers. Virtual Network 2 Virtual Network 2 Virtual Network 1 Open vSwitch Server Hardware VM1 VM2 VM3 VM4 Open vSwitch Server Hardware VM8 VM6 VM7 VM5 Physical network Vi rtu al real m P hysi cal real m
Fig. 2.1 Virtual network: physical and virtual view.
One of the most prominent examples of such performance optimization is the issue of network throughput in virtualized network devices. Traditionally, virtualization and sharing of extension host devices (such as ones attached via PCI) between different VMs had to be implemented by means of the hypervisors themselves. This entailed compatibility and support difficulties, as well as (often) a decrease in the performance of those devices when accessed from a VM. Such an issue was especially problematic for virtualized network devices because their cornerstone component – Network Interface Cards (NICs) – are typically implemented as PCI/PCIe extension cards, and hypervisors were not always capable of providing their VMs with a line-rate NIC performance at high data rates. A substantial improvement in
16 Monitoring Virtualized Networks: State-of-the-art
this regard has been achieved by the introduction of Single-Root Input/Output Virtualization (SR-IOV).
Within SR-IOV specification, a PCIe device itself supports isolation of its resources for direct VM access, in a form of physical and virtual functions. A physical function (PF) presents itself as a full-featured PCIe device, supporting input/output as well as device configuration. Within a physical function, virtual functions (VF) can be defined, which provide virtualized devices supporting input/output only within their parent physical function configuration. When VMs perform I/O operations within these functions (that appear as PCIe devices), hypervisors move the data to and from the physical PCIe hardware directly, bypassing their own internal network abstractions (whenever such functionality is supported, of course). Such a standard specification with a resource sharing and isolation in mind has greatly promoted high-bandwidth I/O for network virtualization.
An important example of network virtualization (which is also heavily used in this thesis) is a software switch - an application to perform packet forwarding and other switch capabilities between virtual NICs (vNIC, that can be attached to VMs) and physical NICs of physical equipment. The most famous player in the domain is Open vSwitch [32], nevertheless, there are other non-hardware implementations of switches, e.g., snabb [33], BESS [34], PISCES [35], FastClick [36], Fr.io VPP [37], netmap VALE [38].
Open vSwitch was created as a simple flow based switch with a central controller and was released in 2009. It is a multilayer virtual switch implemented in software. It operates like a physical switch, e.g., OvS handles information about connected devices with MAC addresses, instances tap interfaces are connected to OvS bridge ports. It uses overlay (GRE/VXLAN) networking providing multi-tenancy in cloud environments.
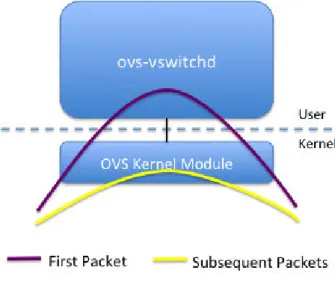
Due to OvS architectural principles, switching is performed in the kernel module, the equivalent of the fast-path of physical switches/routers. Indeed, the kernel can directly copy frames from one interface to another without any context switching, which is the fastest option in an off-the-shelf computer1. However, such an operation is not possible for every packet but only for those for which an entry exists in the associate array used by the kernel mode [39]. Other packets, typically the first packet of any new connection must be handled by ovs-switchd, which is executed in user space (hence slower, as some context switching will occur while processing this packet). Ovs-switchd will perform a set of hash lookups in
2.1 Generalities on network virtualization and monitoring 17
its rule tables to find the rule matching the packet. The rule will next be installed in the kernel module path to speed up the processing of the next packets form the connection. Fig.2.2 vividly demonstrates the packet handling in OvS in kernel and user spaces.
With virtualization, a VM (or a container) has its own TCP/IP stack and virtual interface that is connected to a physical interface of the server. This complexity affects performance, especially for servers with high bandwidth requirements. This is typically the case of NVF [40] in the data centers of the telco ISPs, which are in general close to the mobile base stations. While telcos want to benefit from the flexibility of virtualization, by virtualizing some of their network operations into so-called VNFs, they do not want to sacrifice performance. For these cases, hypervisor bypass solutions like DPDK have been invented [41, 42]. In such cases, a direct link is established between the user space in the VM and controller of the physical interface. This enables to achieve high performance, at the expense of a loss in terms of flexibility as these DPDK-enabled VNFs cannot be easily migrated from one server to another.
This type of solution is also offered in public/private clouds for users/applications with specific network requirements. In this thesis, we do not consider these niche cases but focus on the mainline case where the network traffic of the VM will be handled by the hypervisor.
Fig. 2.2 OvS data path2
18 Monitoring Virtualized Networks: State-of-the-art
The comparison and evaluation of 6 state-of-the-art software switches were conducted in [43]. The authors proposed a benchmarking methodology for understanding the switches’ performance baseline. A methodology implies 4 test scenarios to evaluate the performance of software switches. In this work OvS-DPDK, snabb, BESS, FastClick VPP and netmap VALE switches were compared and evaluated. The results of such comparison did not bring striking insights: no single switch prevails others. The performance depends on the switch implementation and investigated scenario, e.g., BESS prevails over others in the scenario where packets are forwarded from physical NIC to VNF, whereas snabb wins in the scenario of VNF to VNF. Performance characteristics of virtual switching were also described in [44] and performance modeling in [45].
2.1.3
Monitoring the virtual network
The complexity and blend of software and hardware in data centers raise the difficulty to monitor and debug performance issues in a virtualized environment. A computer network is a complex system, and a failure of a single component can impact the system as a whole and network users’ experience: from incorrect network configurations or virtual machine settings to underlying servers and network devices problems. Monitoring the network health can help to identify such issues, and so to troubleshoot network appropriately in case of failures.
Generally, monitoring can be defined as a process of data collection and processing. More specifically, monitoring in the domain of networking implies several subprocesses [46]:
1. Data collection: there exist two ways of data collection: passive and active. The active measurement simulates users behaviour by injecting test traffic into the network for monitoring purposes (e.g., SDN rule checking [47]), whereas passive measurement implies observation of ongoing users traffic (e.g., sampling techniques) and its analysis over some period of time. Data collection does not exclude a combination of both. Detailed analysis of the pros and cons of these two methods is presented in section 2.5. 2. Data preprocessing: previously collected data is prepared for further stages (itemizing,
labeling, packaging, etc.)
2.1 Generalities on network virtualization and monitoring 19
4. Data analysis: analysis phase, when received data is investigated and all kinds of statistics are built.
5. Data presentation: the results of data analysis are presented or visualized for further perception, providing a view on the network.
Apart from trivial assistance in network debugging, monitoring becomes a crucial process for service providers. In such a case, it serves several more complex objectives:
1. Quality of service delivery: there exists a certain level of services, that are delivered to a customer by the provider, which is specified in the Service Level Agreement (SLA). SLA obliges the provider to monitor and keep services parameters to a required level and assure proper operation of the services, that customers pay for.
2. Billing and accounting: network monitoring allows to collect necessary statistics of computer resources and services usage, as in the cloud computing paradigm pay-for-use, when a customer pays to a provider in accordance with the amount of utilized system resources.
3. Efficient resource usage: monitoring of system resources (memory, CPU cycles, I/O, etc.) helps to anticipate failures due to resource limitations.
4. Performance monitoring: monitoring of network performance implies collecting network-related metrics, such as bandwidth, throughput, latency, jitter, etc.
5. Security/privacy assurance: constant monitoring helps to detect numerous kinds of security attacks (intrusion, DDoS).
6. Fault management/troubleshooting: it is important to keep track of network state during its operation. Constant network monitoring helps to detect, diagnose, and prevent network faults/frauds, which in turn assures decent service delivery to customers.
The monitoring of a virtual network implies the same stages, however considering the architectural principles of clouds, SDN and virtual networks, it includes monitoring of underlying physical components (hardware servers and network) and the platform that enables virtualization, and monitoring of virtual components themselves (virtual hosts, virtual network, applications health).
20 Monitoring Virtualized Networks: State-of-the-art
2.2
Monitoring in the cloud-based environment
Being the basis for the virtual infrastructure, the underlying physical network is, perhaps, the most important component in a virtual network. It is not uncommon to “overbook” the physical resources for virtual overlays, so a single physical failure (such as network connectivity issue, lack of server resources) may quickly translate into a massive outage in a virtual domain. To overcome such issues multiple resource allocation algorithms and VM migration techniques were proposed [48], [49], [50], [51], [52]. It is also worth noting that virtual networks are supposed to be isolated from their physical substrate by means of hypervisors. This gives one an opportunity to create such a monitoring scheme that would help to identify the exact failure domain and, by so narrow down the problem scope for faster issue resolution.
However, as it has been noted in the previous section, modern networks are not only composed of physical devices but also of a wide range of virtual network functions deployed on top of computing platforms – for instance, virtual switches, load balancers, firewalls, application gateways and so on.
Literature specifies at least three classes of performance problems of these virtual platform elements [53]: (i) miss-allocation of resources for element placement and functioning, (ii) contention for resources between elements, and (iii) implementation bugs. PerfSight aims at diagnosing such problems [53]. PerfSight tries to identify the location and reveal the nature of performance degradation in the virtual domain. PerfSight relies on a controller, that manages agents and diagnostic applications, analyzing collected data on the way to retrieve the root cause of the observed problem. A collecting agent running at each server collects the necessary data (packet counter, byte counter, I/O time) of a certain network component (all VMs placed on the server, only VMs of a single tenant). The obtained statistic is enough to pinpoint the problematic element according to authors. The diagnosis is based on a rule book, which is constructed offline and aids to map the symptom to a resource contention or bottleneck problem, i.e., packet drop location (tunnel between virtual switch and vNIC, server NIC driver, etc.) has a match to a certain resource in shortage (CPU, memory space, incoming bandwidth, VM CPU, etc.). The overhead of such metric collection and analysis is studied.
It is evident that virtualized network functions neighboring in the same physical server compete for its resources. Interestingly, different VNFs behave (in terms of resource
con-2.2 Monitoring in the cloud-based environment 21
sumption) in a different manner when placed together. In [54] the authors provided insights on how various types of VNFs, co-located in the same server, tolerate each other and what degree of server resource degradation can be expected from such neighbourship. The authors also give some recommendations on VNF placement for efficient resource usage.
NFV networks – networks that are composed of virtual network functions and physical devices, require different measurement solutions than traditional networks as state the authors of [55]. They also propose their solution for such networks: a measurement system, which enables passive and active measurements in Linux containers, called Virtual Network Measurement Function.
2.2.1
Cloud infrastructure monitoring
Even if the physical substrate health is assured, problems may appear from the virtualization enabler, such as hypervisors and cloud management stacks. Solutions offering cloud or virtualization deployment are complex systems with distributed architecture, that tend to incur faults related to operation or performance, provisioning compute and storage workloads, incorrect component configuration, third party dependencies, API latencies, etc. That is why some research work has focused on monitoring the health of the cloud infrastructure aspect, which refers to hardware and software components that support cloud services [56], [57, 58], [59]. As an example, OpenStack is a popular and convenient framework to develop cloud on-premises. It has modular architecture - different interrelated components support certain functions of the cloud: Nova - cloud computing controller, Neutron assures networking management, Cinder - storage system, Swift - object storage system, Horizon - provides a dashboard for platform administration, etc. Platform users can manage their cloud through graphical interface (dashboard), command-line or RESTful web-services. Hansel and Gretel [57, 58] focus on troubleshooting the infrastructure of OpenStack and leverage the REST calls exchanged between the OpenStack modules to reveal components failures. Hansel [57] focuses on fault detection, whereas Gretel [58] performs fault diagnosis by constructing a precise sequence of messages exchanged between system nodes corresponding to a task or operation (operational fingerprint). A data-driven approach is followed by these tools to pinpoint the origin of system errors. In terms of system overhead Hansel is using 100MB of memory and 4.5% CPU, and its enhanced version Gretel uses 123 MB memory and 4.26% CPU on typical modern servers, which can be considered fairly small footprint.
22 Monitoring Virtualized Networks: State-of-the-art
CloudSight [59] is a cloud infrastructure monitoring framework revealing the state of cloud resources to tenants to increase the visibility of tenants’ problems, caused by underlying cloud resource abstraction. The tool logs the states of cloud components, keeps the resources change history, generates resource graphs containing information regarding resources involved in tenant’s instances operation, which is available for interpretation for cloud tenant. CloudSight is supposed to run on top of any cloud platform and was prototyped and evaluated in OpenStack.
CloudHealth [60] offers a model-based monitoring approach for configuration, deploy-ment, and operation of monitoring infrastructure in the cloud. CloudHealth is designed for cloud operators. Monitoring objectives are translated into the necessary set of metrics in accordance with two ISO standards (ISO/IEC 25010:2011 and ISO/IEC TS 25011:2017), which provide specifications of quality models for IT services quality evaluation. As an example, responsiveness – a level at which the service promptly and timely responds to requests and provides the required functionality, – can be understood by paying attention to waiting time to accept requests and waiting time to receive a response.
2.2.2
Network monitoring in cloud
Network performance diagnostic in the cloud is a hot topic and over past years numerous solutions emerged: for cloud operators use or for tenants control, platform-specific or of general application, etc. Resource sharing in the cloud may lead to performance problems, which can be the result of either problem in providers’ infrastructure or the tenants’ VMs. RINC (Real-time Interference-based Network diagnosis in the Cloud) [9] is a framework for diagnosing the performance problems in the cloud for cloud operators. It provides monitoring of tenants’ connections within the cloud, leveraging the idea of multiple phase measurement. The main idea of multiple phase measurement implies collecting light-weight data to detect problematic connections and heavier-weight to discover root-causes of troubling connections, e.g., harvest simple statistics (e.g., throughput) to detect problematic connections, then on such connections enable deeper-level measurement (congestion window, maximum segment size, round-trip time, etc.) for the purpose of root-cause analysis. RINC measurement agent runs in the hypervisor and relies on TCP statistics (SYN, FIN, CWND, sstresh, sending rate, throughput, packet, and byte counters) by inspecting packets passing through the hypervisor (implementing active measurement approach and sampling for certain cases is
2.2 Monitoring in the cloud-based environment 23
also considered). The measurement agent communicates with a global coordinator module, which aggregates data received from the agents. The global coordinator module also provides an interface between the cloud operator and the monitoring framework. Using this module the cloud operator specifies the statistics needed to be collected. The cloud operator can employ the query interface provided by RINC to write diagnosis applications. Examples of diagnosis applications include detecting long-lived connections, heavy hitters and super spreaders, root cause analysis of slow connections. In terms of overheads, the worst case (querying all the connections) memory consumption is 3.5MB and 0.01% of networking overhead. The CPU overhead is considered with respect to the number of concurrent flows: 0-10000 flows lead to a CPU consumption in the range 0-27 %, and a network footprint (to convey measurement metrics) of 0-10 Mbps corresponding to 0-2% of the CPU consumed. Virtual network diagnosis as a service (VND) [61] is also a query-based virtual network diagnosis framework. However, in contrast to RINC, it provides network troubleshooting tool for cloud tenants and their virtual network. It is composed of a control server, which translates tenants’ queries into diagnosis policy, and several servers that collect network traces, perform data parsing and storing. It provides troubleshooting by collecting flow traces, mirroring the problematic flows and extracting traffic metrics (RTT, throughput, delays, etc.) to identify network related issues, such as packet loss, high delay, network congestion, heavy heaters, etc. Due to the trace collection method used, i.e., traffic mirroring, the overhead in terms of memory throughput is 59MB/s for every 1 Gbps of traffic, plus storage required to keep SQL-database. Even though VND can help to reveal certain networking problems using queries on data from packet headers, sender or receiver side problems remain undetected [9].
A platform-independent monitoring framework for cloud service instantiations is Cloud-View [8]. It allows cloud tenants to perform active and passive measurements between virtual nodes after their instantiation, utilizing arbitrary measurement tools according to their needs. Third-party measurement tools can be integrated into CloudView and provide tool-agnostic flexibility to pick a tool for a particular metric and particular measurement task. The authors also integrated CloudView in OpenStack and evaluated it on two different cloud infrastructures. Two main components are sensor pod (the framework which hosts measure-ment sensors, e.g., ping, pathChirp, tulip, etc.) and the information manager (application for user interaction with platform). They observed that sensor components play a major role in monitoring resource consumption: overhead of 0.5 % of CPU and memory beyond the raw invocation of the sensors.
24 Monitoring Virtualized Networks: State-of-the-art
Dapper [62] is a TCP-related performance diagnostic tool for the cloud implemented based on the P4 programming language for packet processing. It distinguishes performance problems according to their location: sender side, network side or receiver side. Slow application data generation due to resource constraints, and long application reaction time are sender-side problems; congestion, packet loss, and path latency are network-related problems; performance degradation can also occur due to receiver limitations regarding delayed ACKs or small receive buffer.
NetWatch [7] is another cloud performance monitoring tool suitable for both client users and cloud providers’ needs. It provides an API interface to query measurement tasks on demand. It has three components delivering measurement in the cloud: a controller, an agent, and a probe (as it exploits active measurement). The controller is a communication node between the service customer and the measurement framework. It issues control messages for agent and probe to realize specified measurement tasks. The agent is parsing controller instructions, executing them, managing probes creation, configuration, and deletion, and obtaining reports on measurement results. The probe module is the software component executing the actual network probing. NetWatch was prototyped in OpenStack. Measuring network performance depends on the number of measurement tasks to be performed. For example, NetWatch introduces reasonable overhead in terms of CPU - 0.7% per measurement task and negligible influence in terms of memory and 0.01% of the bandwidth of gigabit NIC is consumed by executing five tasks.
ConMon [5] is a network performance monitoring solution for container-based virtual networks. In ConMon a monitoring controller resides in every physical server and communi-cates with monitoring containers, which execute monitoring functions to monitor different network performance metrics (packet loss, delay, jitter, path capacity). During their evalua-tion of ConMon, the authors conducted network tests and reported accumulated CPU usage of 100-200 % in total. The latency between two application containers expressed in RTT is 4.5 microseconds and 130 microseconds correspondingly for cases when containers reside in the same and different servers. No packet loss or impact on background traffic was observed.
2.3 Monitoring in SDN-based environment 25
2.3
Monitoring in SDN-based environment
In traditional networks traffic is forwarded between independent and autonomous devices. These networking devices require individual configurations. Network operators experience difficulties maintaining, debugging and managing various networks built upon such network-ing equipment. Traditional networks havnetwork-ing static, decentralized and complex architecture do not offer the flexibility required for modern environments such as cloud networks with multiple tenants.
The SDN paradigm aims to resolve the challenges of network devices control and man-agement by separating the control plane (network manman-agement and configuration) from the data plane (network traffic) of software and hardware components of networking equipment. Decoupling the control and forwarding functions transforms the network into a programmable environment, where all the configuration of forwarding devices is (logically) centralized and these devices only follow the rules issued from the intelligent controller. Within such networks the traffic passing through network devices is considered in the form of flows - a set of packets with common properties (e.g., source, destination, protocol). Rules installed by the controller are used at each switch to determine the operation to perform on flows.
Due to their architectural differences, monitoring in traditional networks and SDN-based networks differs. Such a difference in monitoring legacy networks and SDN is considered in [46]. Briefly, SDN facilitates and accelerates monitoring phases. Data collection requests can be issued from a controller with the necessary frequency to be adjusted anytime from any device. Whereas, adjusting collection parameters in legacy network devices (equipped with collecting function) would require to manage the configuration of each device individually. Furthermore, the transmission via legacy networks is done with the help of transmission protocols, whereas SDN offers APIs and SDN protocols. With their help, the interactive interface for further measurement operations within SDN can be deployed. Moreover, they can offer functional measurement data representation and visualization.
2.3.1
SDN control plane monitoring
Before monitoring network anomalies in SDN, it is necessary to make sure that the system is working consistently: the controller properly manages networking nodes and networking nodes follow controller instructions. Different kinds of software faults (e.g., switch software
26 Monitoring Virtualized Networks: State-of-the-art
bugs, outdated versions of switch software and OpenFlow [63]) and hardware (e.g., bit flips, non-responding line cards) may trigger packet forwarding which does not match control plane instructions [6]. To assure that such networking problems do not happen due to imperfect communication between controller and network, VeriDP [6] follows a passive approach to track control-data planes consistency, meanwhile Monocle [47] follows the active approach for the same task. Some solutions to check SDN configuration correctness appeared earlier [64], [65], [66], [67].
VeriDP [6] tool consists of a server and a pipeline. The pipeline deals with tagging and reporting packet headers to controllers of different types of switches in the network: entry, exit, and internal switches. The server is put alongside the controller and intercepts controller communication with switches to construct a path table. Reported packets are to be verified according to the constructed path table. If the packet fails the verification, it means that configuration inconsistency is present and the server tries to localize the faulty switch. The reported overhead of VeriDP is expressed in terms of processing delay of its pipeline and native OpenFlow pipeline in hardware SDN switch. Tagging delays equal to 0.27 microseconds, and sampling delays of 0.15 microseconds are reported in [6].
Monocle [68] is another solution to verify whether the network view configured by the controller corresponds to actual devices behaviour. Monocle is inserted as a proxy into the network between the controller and the switches. Firstly, it inserts catching rules in the network and then issues test packets to check the specified rules, when received at a switch with installed catching rule, are forwarded back to Monocle, where the conclusion on rule-behaviour correctness is made. The authors of Monocle argue that injecting packet probes into the network does not overload switches and consumes small switch resources space.
2.3.2
SDN data plane monitoring
SDN (Software Defined Networking) is gaining momentum in modern data centers [69]. As such, a significant amount of works has focused on measuring SDN networks, their performance and resources management.
SDN’s intelligent centralization paradigm is not a cure-all solution. It also has its issues and may become a bottleneck with an increasing amount of tasks in the network [70]. Such
2.3 Monitoring in SDN-based environment 27
issues with centralized controller bottlenecks are addressed in DIFANE [71], DevoFlow [72], software-defined counters [73], Onix [74], Kandoo [75], HyperFlow [76] and Maestro [77], which try to reduce the measurement overhead of the control plane by sharing some tasks with forwarding devices or trying to improve controller performance by means of buffering, pipelining, multithreading and parallelism.
Data center exploits large scale, high speed and high utilization networks, that are com-plex to monitor. Tremendous effort was put into developing tools that would allow network operators to manage and troubleshoot their datacenter networks [78], [79], [80], [81], [82], [83], [66], [84], [85]. Some works [66], [84], [61] require entire data plane snapshot and may only be able to track specific events at coarse-grained time-scale [85]. Sampling technologies were introduced in order to alleviate overheads of such solutions [86], [11], [87], [88], [89], [90], [79], [91], [6], [92], [10]. Traffic sampling implies extraction of a certain portion of traffic for the purpose of network analysis. SFlow [93] is a famous sampling-based packet monitoring solution, that was adopted from traditional network devices and is now imple-mented in software switch (OvS) too. Full or partial extraction of traffic in SDN-based cloud environments is offered by TREX [94]. CeMon [10] develops three sampling algorithms for their framework in order to eliminate measurement overhead. UMON [95] modifies the way OvS handles SDN flow tables to decouple monitoring from traffic forwarding, hence building specific monitoring tables. UMON has a low CPU footprint: monitoring activities of 150 hosts takes 9.9% CPU of a core. A considerably small packet loss is present dur-ing monitordur-ing with UMON of 26 packets per second. Installdur-ing monitordur-ing capabilities at the network edge is proposed by Felix [96]. Predicates are used to answer monitoring queries of interest. Applying declarative query languages for network measurement was first proposed by GigaScope [97]. It allows to execute numerous tasks for network monitoring (traffic analysis, intrusion detection, router configuration analysis, network research, network monitoring, and performance monitoring and debugging) and since then high-level language programming and programming itself was leveraged in a variety of approaches in the context of SDN [98], [90], [81], [68], [99], [100], [101].
Measurement tasks are often executed on the commodity switches in SDN, which rely on TCAM (Ternary Content-Addressable Memory) - a very efficient, however greedy in terms of resource consumption type of memory. High energy consumption of switch memory makes it the most expensive component of the device. It is the number one priority for TCAM to execute networking functionality, and introducing the burden of measurement functions into