HAL Id: tel-01492786
https://tel.archives-ouvertes.fr/tel-01492786
Submitted on 20 Mar 2017HAL is a multi-disciplinary open access
archive for the deposit and dissemination of sci-entific research documents, whether they are pub-lished or not. The documents may come from teaching and research institutions in France or abroad, or from public or private research centers.
L’archive ouverte pluridisciplinaire HAL, est destinée au dépôt et à la diffusion de documents scientifiques de niveau recherche, publiés ou non, émanant des établissements d’enseignement et de recherche français ou étrangers, des laboratoires publics ou privés.
The drawbacks of paternal obesity on sperm biology,
preimplantation embryo morphokinetics, and its
transgenerational impacts
Georges Raad
To cite this version:
Georges Raad. The drawbacks of paternal obesity on sperm biology, preimplantation embryo mor-phokinetics, and its transgenerational impacts. Agricultural sciences. Université Côte d’Azur, 2016. English. �NNT : 2016AZUR4143�. �tel-01492786�
Université de Nice-Sophia Antipolis Ecole doctorale SVS ED85
Sciences-Vie-Santé
THESE DE DOCTORAT
Pour obtenir le grade de
Docteur en biologie de l‘université de Nice-Sophia Antipolis Spécialité: Recherche clinique et thérapeutique
Soutenue par: Georges RAAD
The drawbacks of paternal obesity on the sperm biology, the preimplantation
embryo morphokinetics, and its transgenerational impacts
Directrice de thèse : Valérie GRANDJEAN Co-directrice de thèse : Mira HAZZOURI
Soutenue le 14 Décembre 2016
Jury :
Rapporteurs : Sophie ROUSSEAUX Roger MIEUSSET
2 Table of Contents THESIS ABSTRACT ...6 RESUME ...8 LIST OF FIGURES ... 10 LIST OF TABLES ... 13
CHAPTER1 THE DRAWBACKS OF OBESITY ON THE GLOMERULOPATHY, TESTICULAR HOMEOSTASIS AND SPERM EPIGENOME ... 14
I- THE BODY WEIGHT HOMEOSTASIS ... 14
A- The human body homeostasis... 14
B- The body weight management ... 18
B. 1 The metabolic energy network ... 18
B.1.1 The digestive system: intake, processing and distribution of foodstuffs ... 18
B.1.2 Cells and molecules implicated in glucose homeostasis and energy management 19 a) Energy storing cells ... 20
a. 1 The white adipose tissue ... 20
a. 2 The liver ... 22
b) Energy consuming cells ... 23
B. 2 The control of food intake ... 24
II- WEIGHT IMBALANCE: OBESITY COMPLICATIONS ... 25
A- The drawbacks of obesity on kidney homeostasis ... 28
A. 1 Kidney physiology ... 28
A. 1.1 Obesity-related glomerulopathy (ORG) ... 31
A. 1.1.a The effect of obesity on the glomerular histology ... 31
A. 1.1.b Decline in renal function and obesity ... 31
a) Renal hemodynamics... 31
b) Hyperglycemia and hyperlipidemia: ... 33
B- The drawbacks of obesity on testicular homeostasis ... 34
B. 1 Male reproductive system anatomy ... 34
B.1.1 The effects of obesity on testicular anatomy, sexual function and seminal plasma biochemistry ... 36
B. 2 Testicular histology and physiology ... 37
B.2.1 The interstitial compartment... 38
a) Blood vessels ... 38
b) Leydig cells ... 38
b.1 Overview ... 38
b.2 Steroidogenesis ... 39
3
c) Immune cells ... 41
c.1 Phagocytosis, proliferation and physiology of Leydig cells ... 41
c.2 Immunoregulation and inflammation ... 42
c.3 The effect of obesity on testicular immune cells ... 42
B.2.2 Tubular compartment ... 43
a) Peritubular cells ... 44
b) Sertoli cells ... 45
b. 1 Overview ... 45
b. 2 Cytological features ... 45
b. 3 Sertoli cell functions ... 45
b. 4 The effects of obesity on Sertoli cell functions ... 49
c) Germ cells... 52
c. 1 Spermatogonia ... 52
c. 2 The meiotic cells ... 54
c. 3 The spermiogenesis ... 55
c. 4 The impact of male obesity on sperm parameters and embryo development .. 58
III- EPIGENETIC INHERITANCE OF PATERNAL ACQUIRED OBESITY ... 60
A- Epigenetic control of gene expression during spermatogenesis and early embryogenesis 60 A. 1 DNA methylation ... 60
A. 1.1 DNA methylation reprogramming in mouse germ cells and pre-implantation embryos 62 A. 1.2 The drawbacks of abnormal DNA methylation profile in gametes ... 63
A. 2 DNA hydroxymethylation and DNA demethylation ... 65
A. 2.1 5-hmC dynamics during mouse spermatogenesis and embryo development .. 67
A. 3 Chromatin modifications ... 69
A. 3.1 Chromatin structure in somatic cells ... 69
A. 3.2 Chromatin remodelling during spermatogenesis ... 72
a) Spermatogonia ... 72
b) Meiotic cells ... 73
c) Spermatids and spermiogenesis ... 74
c. 1 The incorporation of histones variants into the chromatin ... 74
c. 2 Histones hyperacetylation... 74
c. 3 Replacement of histones by transition proteins ... 75
c. 4 Replacement of TP by protamine... 75
d) Sperm chromatin ... 76
d.1 Nucleoprotamine-bound sperm chromatin ... 77
d.2 Nucleosome-bound sperm chromatin ... 77
d.3 Matrix attachment regions (MARs) ... 78
4
B- Transgenerational inheritance of paternal acquired obesity ... 79
B. 1 Overview ... 79
B. 2 Possible mechanims of intergenerational and transgenerational inheritance of paternal acquired obesity ... 81
IV- RESEARCH AIMS ... 84
V- BIBLIOGRAPHY ... 85
CHAPTER 2 SELECTIVE PHYSIOLOGICAL AND MOLECULAR ALTERATIONS IN THE MOTILE SPERM FROM OBESE MEN ... 109
I- ABSTRACT ... 109
II- INTRODUCTION ... 110
III- MATERIALS AND METHODS ... 112
a) Study population ... 112
b) Anthropometric measurements ... 112
c) Semen analysis... 112
d) Sperm isolation using swim-up technique... 113
e) Sperm morphology evaluation ... 113
f) Sperm membrane integrity assessment ... 113
g) Sperm chromatin structure assessment ... 113
h) Histone retention assessment ... 114
i) Sperm DNA extraction ... 114
j) Sperm Global DNA 5-methylcytosine (5-mC) and 5-hydroxymethylcytosine (5-hmC) measurements ... 114
k) Ovarian stimulation, oocytes retrieval, and ICSI ... 115
l) Embryo culture and evaluation of time-lapse images ... 115
m) Statistical analysis ... 115
IV- RESULTS ... 117
a) Characteristics of the cohort ... 117
b) The effect of paternal obesity on the macroscopic semen parameters ... 117
c) Description of the motile sprem-enriched fraction according to the paternal BMI and WC 117 d) Higher histones retention in motile sperm-enriched fraction of obese men... 121
e) Altered sperm chromatin integrity in motile sperm-enriched fraction of obese men ... 122
f) Global DNA hyohydroxymethylation in the motile sperm of obese men ... 123
g) The effect of paternal obesity on pre-implantation embryo morphokinetics ... 124
h) The effect of paternal obesity on embryo quality ... 124
V- DISCUSSION ... 129
5
CHAPTER 3 INTERGENERATIONAL AND TRANSGENERATIONAL INHERITANCE OF PATERNAL ACQUIRED OBESITY AND ITS ASSOCIATED
GLOMERULOPATHY AND SUBFERTILITY IN A MOUSE MODEL ... 141
I- ABSTRACT ... 141
II- INTRODUCTION ... 142
III- MATERIALS AND METHODS ... 144
a) Animals and experimental design ... 144
b) Body measurements ... 145
c) Metabolic cage experiments ... 145
d) Renal histology and special stains ... 145
e) Quantification of renal pathology ... 145
f) Assessment of sperm count and motility... 146
g) Evaluation of sperm morphology ... 146
h) Sperm chromatin integrity ... 146
i) Statistical analysis ... 146
IV- RESULTS ... 147
1- Exacerbation of the overweight phenotype and the adipose tissue volume after seven successive generations of HFD feeding ... 147
2- Feeding five successive generations of male mice with a HFD negatively impacted the body weight and the adipose tissue volume of the CD6 and the CD7 males ... 148
3- Progressive alterations in the body composition after seven successive generations of HFD feeding ... 148
4- The drawbacks of HFD feeding during 5 generations on the body composition of the CD6 and CD7 males ... 149
5- The amount of food intake in the different HFD and CD groups ... 149
6- The effect of the exposure to the same obesogenic environment during seven successive generations on the water balance ... 151
7- Physiological adaptation of the kidney to the continuous HFD stress during several generations ... 152
8- The effect of exposure to HFD during successive generations on glomerular histology 152 9- The impact of the continuous exposure to a HFD stress during several generations on the conventional semen parameters ... 155
10- The changes in the sperm chromatin integrity across HFD and CD generations ... 157
V- DISCUSSION ... 158
VI- CONCLUSION AND PERSPECTIVES ... 161
VII- BIBLIOGRAPHY ... 162
CHAPTER 4 FINAL DISCUSSION AND PERSPECTIVES ... 167
6
Thesis abstract
The body weight homeostasis is defined as the balance between the energy intake and the energy expenditure. This equilibrium is maintained due to the activity of different body systems such as the neuroendocrine system and the gastrointestinal tract. Obesity is a medical condition resulting from an excessive accumulation of adipose deposits. The pathological remodelling of the adipose tissue in obese subjects may lead to the development of several health problems such as hypertension, kidney disease, and type 2 diabetes. Unfortunately, the prevalence of obesity is increasing worldwide and of particular interest among young men of reproductive age. The impact of obesity on reproduction is well established in women; however it is not fully elucidated in men. Furthermore, accumulated evidence suggests that information from paternal environment such as acquired obesity remains in the sperm epigenome (non-coding RNAs, chemical modifications of paternally inherited histones, and DNA modifications) and can modulate the phenotype of the offspring. Therefore, a deeper comprehension of the drawbacks of male excessive fatness on the sperm molecular composition is needed.
The first aim of this thesis was to assess the impact of obesity on the molecular composition and on the physiology of the motile sperm. The semen samples were obtained from 96 men attending the A-clinic fertility center, Lebanon. Patients were categorized into three groups according to their body mass index (BMI) and waist circumference (WC): normal weight (18<BMI<24 kg/m2 and WC< 90 cm), overweight (25<BMI<29.9 kg/m2 and WC<102 cm), and obese (BMI>30 kg/m2 and WC >103 cm).We showed that the motile sperm of obese men had abnormal levels of paternally inherited histones and hypomethylated/hypohydroxymethylated DNA as compared to normal weight men. Subsequently, the embryos derived from the motile sperm of an obese father had an altered morphokinetic patterns when compared to those derived from normal weight one. Altogether, these results indicated that paternal obesity could affect the molecular composition of the motile sperm nucleus and negatively impact the pre-implantation embryo morphokinetics. The second aim of this thesis was to evaluate the adaptive and evolutionary potential of non-genetic heritable mechanisms in experimentally controlled animal models. Using a high fat diet (HFD)-induced obesity mouse model, we have examined how feeding male mice with a high fat diet for multiple generations impacts the phenotype of the resulting mice.For that purpose,C57BL/6 male mice were fed a high-fat diet (HFD) from weaning for up to 5 months during 5 successive generations. The resulting male offspring were raised either on a control diet (CD6 and CD7) or on a HFD (HFD6 and HFD7). Despite their genetic similarity, there was a gradual increase in the body weight, in the adipose tissue volume, in the severity of obesity-related glomerulopathy, and a significant decrease in the fertility status across HFD generations as compared to controls. Although the CD6 and CD7 male mice had never encountered an obesogenic environment, they had a heavier body weight and a larger adipose tissue, they
7 developed histological kidney lesions, and they had a reduced fertility potential when compared to the control group. These findings indicated that at each generation the offspring might retain residual effects of the paternal obesity within their cells that could be worsened when they were re-exposed to the same obesogenic environment.
In conclusion, our findings might add more insights into the current knowledge on the epigenetic signature transferred by the sperm of obese men to the oocyte during fertilization and into how biological systems might respond and adapt to continuous exposure to a HFD stress.
8
Résumé
L'homéostasie du poids corporel est définie comme étant l'équilibre entre les apports et les dépenses énergétiques. Cet équilibre est maintenu grâce à l'activité des différents systèmes du corps tels que le système neuroendocrinien et le tractus gastro-intestinal. L'obésité est une condition médicale résultant d'une accumulation excessive de dépôts adipeux. Le remodelage pathologique du tissu adipeux chez les sujets obèses pourrait conduire à l'élaboration de plusieurs problèmes de santé tels que l'hypertension, les maladies rénales et le diabète de type 2. Malheureusement, la prévalence de l'obésité augmente dans le monde entier et en particulier chez les jeunes hommes en âge de procréation. L'effet de l'obésité sur la reproduction est bien établi chez les femmes; cependant, il n'a pas été complètement élucidé chez les hommes. En outre, plusieurs études ont suggéré que les informations de l'environnement paternel comme l'obésité acquise restent dans l‘épigénome du spermatozoïde (ARNs non codants, des modifications chimiques des histones, et les modifications de l'ADN) et peuvent moduler le phénotype de la descendance. Pour toutes ces raisons, une compréhension plus approfondie des effets de l‘obésité sur la composition moléculaire des spermatozoïdes est nécessaire.
Le premier objectif de cette thèse était d'évaluer l'effet de l'obésité sur la composition moléculaire et sur la physiologie des spermatozoïdes mobiles. Les échantillons de sperme ont été obtenus à partir de 96 hommes s‘adressant au centre de fertilité ‗A-clinic‘, Liban. Les patients ont été classés en trois groupes en fonction de leur indice de masse corporelle (IMC) et le tour de taille (WC): poids normal (18 <IMC <24 kg/m2 et WC <90 cm), le surpoids (25 <IMC <29,9 kg/m2 et WC <102 cm), et obèses (IMC> 30 kg/m2 et WC> 103 cm). Nos résultats ont montré qu‘il y a une rétention des histones plus élevée, et un ADN spermatique hypométhylé et hypohydroxymethylé, dans les spermatozoïdes mobiles des hommes obèses par rapport à ceux des hommes non-obeses. Par conséquent, les embryons issus de spermatozoïdes mobiles d'un homme obèse avaient une cinétique de division embryonnaire altérer par rapport à ceux provenant des spermatozoïdes d‘un homme de poids normal. En conclusion, ces résultats indiquent que l'obésité paternelle peut avoir des effets négatifs sur la composition moléculaire des spermatozoïdes et sur la morphocinétique embryonnaire précoce.
Le second objectif de cette thèse était d'étudier l‘évolution et/ou la régression des maladies liées à l‘obésité chez les souris mâles après avoir été exposé pendant plusieurs générations a un régime riche en graisses. Pour accomplir ce but, des souris mâles (C57BL/6) ont été nourris avec un régime riche en graisses (HFD) à partir du sevrage jusqu'à 5 mois et pendant 5 générations successives. La progéniture mâle de la sixième et la septième génération ont été soulevées, soit sur un régime contrôle (CD6 et CD7) ou sur un HFD (HFD6 et HFD7). Tout en partant du même fond génétique le phénotype des souris était diffèrent à chaque génération. Il y a eu une augmentation progressive du poids corporel, du volume du tissu adipeux, de la sévérité de la glomérulopathie, et une diminution graduelle de l'état de fertilité entre les générations HFD par
9 rapport aux souris contrôles. Bien que les souris mâles CD6 et CD7 avait jamais rencontré un environnement obésogène, ils avaient un poids corporel plus élevé, un tissu adipeux plus volumineux, ils ont développé des lésions rénales histologiques, et ils avaient un potentiel de fertilité réduit par rapport au groupe de souris contrôles. Ces résultats indiquent que, à chaque génération la progéniture pourrait conserver les effets résiduels de l'obésité paternelle dans leurs cellules qui pourraient être aggravée quand ils ont été exposés de nouveau au même environnement obésogène.
En conclusion, nos résultats ont montrés qu‘il pourrait y avoir une signature épigénétique spécifique transférée par les spermatozoïdes des hommes obèses à l'ovocyte lors de la fécondation. En plus, à l‘aide d‘un modèle murin on a pu démontrer comment les systèmes biologiques pourraient réagir et s‘adapter à une exposition continue à un régime riche en graisses.
10
List of figures
Chapter1 The drawbacks of obesity on the glomerulopathy, testicular homeostasis and sperm epigenome
Figure 1: Cellular communication and homeostasis ... 14
Figure 2: Organization of the integration systems. ... 17
Figure 3:The central role of pancreatic islets in the maintenance of the normal level of plasma glucose ... 20
Figure 4: The adipose tissue. ... 21
Figure 5: Relation between the white adipose tissue and metabolism ... 22
Figure 6:Regulation of glucose metabolism by the hepatocytes. ... 27
Figure 7: A diagram showing the possible regulators of food intake and energy balance... 24
Figure 8: The prevalence (%) of obesity among adults in different countries. ... 26
Figure 9: The high prevalence (%) of overweight and obese among young population aged 5-17 years in both developed and developing countries ... 26
Figure 10: The central role of adipose tissue in the development of obesity-associated complications. ... 27
Figure 11: Anatomy of the nephron. ... 30
Figure 12: Regulation of blood Na+ levels by the kidney . ... 30
Figure 13: Pathogenesis of obesity-related glomerulopathy. ... 32
Figure 14: Histological kidney sections ... 33
Figure 15: Sagittal view of testis and male pelvis ... 34
Figure 16: Histological section of the human testis ... 37
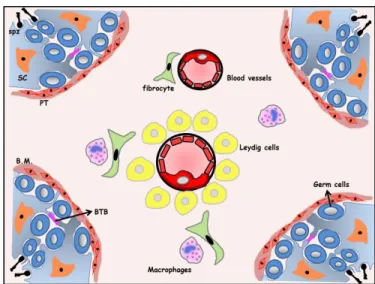
Figure 17: Illustration of the testicular interstitial tissue... 38
Figure 18: Illustration of the cascade of events leading to male sexual hormone production by the Leydig cell. ... 39
Figure 19: The high-energy diet overconsumption affects the reproductive axis at the central and at the gonadal levels. ... 41
Figure 20: Interstitial immune cells secrete stimulatory and inhibitory factors that may regulate Leydig cell physiology. ... 42
Figure 21: Organization of the seminiferous tubule. ... 43
Figure 22: Scheme illustrating the function of sometheperitubular cells (PT) secreted factors. ... 44
Figure 23: Schematic presentation of the metabolic coupling between Sertoli cells and the germ cells. ... 47
Figure 24: Steroids homeostasis in the seminiferous tubule. ... 48
Figure 25: Illustration showing the compartmentalization of the seminiferous epithelium by the specialized junctions between the Sertoli cells. ... 49
Figure 26: The drawbacks of excess high-energy diet consumption on testicular homeostasis ... 51
11
Figure 28: The role of retinoic acid in meiotic entry. ... 54
Figure 29: Illustration of the major events that occur during the meiotic division ... 56
Figure 30: The process of spermiogenesis ... 58
Figure 31: Flow diagram of methionine-folic acid metabolism. ... 60
Figure 32: The DNA methyltransferases functions. ... 61
Figure 33: The dynamics of DNA methylation during mouse gametogenesis and pre-implantation embryos. . ... 63
Figure 34: Regulation of gene expression by DNA methylation and demethylation. ... 66
Figure 35: The cross-talk between the glucose metabolism and 5-hydroxymethylcytosine formation in normal and cancer cells . ... 67
Figure 36: The dynamics of 5-hydroxymethylcytosine during mouse spermatogenesis and embryo development. ... 69
Figure 37: Chromatin structure. ... 70
Figure 38: The major steps of spermatid chromatin remodelling during spermiogenesis. . ... 75
Figure 39: The structure of the sperm chromatin. ... 76
Figure 40: Scheme showing different modes of non-genetic inheritance. ... 80
Figure 41: Pedigree pattern of acquired pathologies. ... 81
Figure 42: The impact of the lifestyle on the non-genetic paternal contribution to the embryogenesis. ... 84
Chapter 2: Selective physiological and molecular alterations in motile sperm from obese men Figure 1: The study design. ... 116
Figure 2: Cytological assessment of sperm membrane integrity and morphology. ... 120
Figure 3: Sperm histones retention as assessed by the aniline blue staining (AB). ... 121
Figure 4: Sperm chromatin integrity as assessed by the toluidine blue staining (TB). ... 122
Figure 5: Assessment of the global sperm DNA methylation status. ... 123
Figure 6: Assessment of the global sperm DNA hydroxymethylation status. ... 124
Figure 7: The different stages of pre-implatation embryo development. ... 128
Figure 8: Figure showing two blastocysts. ... 129
Chapter 3: Intergenerational and transgenerational inheritance of paternal acquired obesity and its associated glomerulopathy and subfertility in a mouse model Figure 1: Two pedigrees showing the high fat diet (HFD) ... 144
Figure 2: The body weight and the adipose tissue volume of the different HFD and CD groups. ... 147
12 Figure 3: Feeding male mice with a HFD during seven generations alters the glomerulus/capsule ratio and increases the matrix accumulation... 153 Figure 4: Quantitave analysis of the glomeruli in CD6 and CD7 males compared to the controls at 16 weeks. ... 154 Figure 5: Pathological alterations in the kidney of mice on HFD (1-7) and control diet (CD6 and CD7) at 16 weeks. ... 154 Figure 6: Graphs showing the sperm concentrations of the different HFD (a) and CD (b)
generations. ... 155 Figure 7: Graphs showing the percentage of spermatozoa with progressive motility,
non-progressive motility, and the non-motile ones in the different HFD (a) and CD (b) generations. ... 156 Figure 8: The normal sperm morphology percentage in the different HFD and CD groups. ... 157 Figure 9: The mean percentage of TB positive cells in the different HFD (a) and CD groups (b). ... 158
13
List of tables
Chapter 1 The drawbacks of obesity on the glomerulopathy, testicular homeostasis and sperm epigenome
Table 1:The systems implicated in internal environment homeostasis in humans ... 15
Table 2: Table showing the classification of the overweight and obesity ... 25
Table 3: Table showing some of the sex gland secretions ... 35
Table 4: A summary of the phenotypes derived from DNMTs genes mutations. ... 64
Table 5: The biochemical properties of the histones . ... 71
Table 6: The different types and functions of the post-translational modifications of histones ... 71
Table 7: Table summarizing some of the epigenetic events that occur during spermatogonia differentiation from type A undifferentiated to type A differentiated in a mouse model ... 72
Table 8: A comparison between the epigenetic regulation in the embryonic stem cells and the spermatogonia ... 73
Chapter 2: Selective physiological and molecular alterations in motile sperm from obese men Table 1: Characteristics of the study population according to the paternal BMI and WC... 118
Table 2: Comparison between the macroscopic semen parameters according to the paternal BMI and WC levels. ... 119
Table 3: Comparison between the sperm parameters in the raw semen and in the motile-enriched fraction post swim-up technique according to paternal BMI and WC levels . ... 120
Table 4: The diagnosis of female infertility according to the paternal BMI and WC. ... 125
Table 5: The effect of obesity on the morphokinetic parameters of pre-implantation embryo development ... 126
Table 6: The effect of paternal obesity on the fertilization rate and the embryo development on day 4 and 5 of culture. ... 127
Chapter 3: Intergenerational and transgenerational inheritance of paternal acquired obesity and its associated glomerulopathy and subfertility in a mouse model Table 1: Gross anatomy of the different HFD groups... 148
Table 2: Gross anatomy of the different CD groups. ... 149
Table 3: Calories intake, water balance, and kidney physiology of different HFD groups. ... 150
14
Chapter1 The drawbacks of obesity on the glomerulopathy, testicular
homeostasis and sperm epigenome
I-
The body weight homeostasis
A- The human body homeostasis
The evolution from aquatic unicellular organisms to land multicellular ones requires groupings of specialized cells into organs, which in turn are grouped into systems. To adapt and survive, the individual cells of the human body (multicellular organism)still need a milieu similar to that of the primordial sea. This medium is created by the extracellular body fluid. In this latter, specialized organs assure continuous absorption of nutrients and excretion of waste products via the urine and feces (Figure 1) (Despopoulos et al. 2003).
Figure 1:Cellular communication and homeostasis(A) Unicellular organisms can perform all
the necessary functions to live (Despopoulos, et al. 2003). (B) Multicellular organisms have specialized organs to perform specific tasks to sustain their lives (extracted after permission from www.santelvgar.blogspot.com).
In order to prevent depletion of essential elements and accumulation of toxic compounds, the body has developed a physiologic process called homeostasis (from the Greek homeo- meaning ―same‖ and the Latin stasis- meaning ―standing‖). It is made up of physiologic auto-regulatory
A
15 mechanisms that maintain steady states of the body. The systems implicated in maintaining this equilibrium are summarized in Table1 (Despopoulos et al. 2003).
Table 1:The systems implicated in internal environment homeostasis in humans
(Despopoulos et al. 2003)
Body systems Major organs Functions
Cardiovascular system
- heart
- blood vessels
- Connects all the systems together
- Exchanges compounds between blood and intercellular spaces - Regulates the body temperature
Digestive system
- Major organs:
mouth, oesophagus, stomach, small and large intestine
- Secondary organs:
liver, pancreas, salivary glands and the gall bladder
- absorbs
- Processes water, salts… - Distributes
- Excretes waste and toxins
Respiratory system
- Upper respiratory tract:
nose, nasal cavity, pharynx and larynx - Lower respiratory cavity: trachea, bronchi, alveoli and the lungs
- Oxygen ( O2) intake
- Carbon dioxide ( CO2)
elimination
- Regulates the internal environment (Osmolality, pH, ion concentrations…) Excretory system ( urinary) - Kidneys - Ureters - Bladder - Urethra
- Excretes the excess of water, salts, acids
- Excretes the waste, toxins and foreign bodies
- Regulates the internal environment
(Osmolality, pH, ion concentrations…)
Apart from the local regulation in each organ, these body systems can communicate together and with the external environment due to the coordinated control of regulatory systems. There are
16 three families of regulators: the nervous, endocrine and immune systems. The operation of these systems and the integration of information among them are responsible for the integrity of the organism or the homeostasis. This is accomplished by an intercellular communication that implements:
- A detector that responds to a chemical or physical stimulus - Components that integrate the signals coming from the detector
- Molecular mechanisms responsible for the transmission of information among cells of the same system and / or different systems
The intercellular communication signals are mainly of physical or chemical origin. At the fundamental level, the chemical signals are classified according to their site of secretion. The signals secreted in the interstitial fluid are the local paracrine and autocrine factors (growth factors as well as factors of the inflammatory reaction and cellular immunity), in addition to the chemicals diffusing in the synaptic space, which are termed neurotransmitters. However, the signals secreted in blood and using blood vessels to reach their cellular targets are the hormones and the antibodies. So, the concept of hormones is based on a physiological definition concerning the fluid compartment in which these signals are transported (Idelman et al. 2000). According to the needs of the organism at any change in the internal or external environment, the mechanisms of adaptation and regulations are triggered:
1-The nervous system monitors the changes in the internal environment by the sensory receptors. It can regulate the altered parameters by controlling the effectors cells: cardiac muscle, gland cells, and smooth muscles of the internal organs (stomach, intestine…) and of the blood vessels. Moreover, the nervous system monitors the external milieu by controlling the skeletal muscles (body movements) and by modulating the behavior (eating, learning, looking for sex…)(Figure
2A) (Despopoulos et al. 2003).
2-The endocrine system is involved in lipids, proteins, and carbohydrates metabolism. In addition, it plays a crucial role in growth, fat stores, reproduction, thermoregulation, glucose homeostasis and adaptation to the fluxes in the external conditions (Despopoulos et al. 2003). The endocrine cell can function as a mechanoreceptor that is sensitive to the change in blood volume for instance or as a chemoreceptor that is sensitive to the ionic concentration (Na+, K+…) or to the hormonal substance. Endocrine cells secrete hormones into the blood that can act on distal target cells (Figure 2B) (Idelman et al. 2000).
3-The immune system is essentially involved in the defense of the body against external aggressions or internal changes (viral or malignant transformations). Immune cells can secrete molecules that regulate the activities of the neurons. In turn, these secreted molecules could be regulated by the hormones and the neurotransmitters (Figure 2C) (Idelman et al. 2000).
17
Figure 2: Organization of the integration systems.
(A) Anatomy of the nervous system. (B)Scheme showing the main hormones of the endocrine
system, their site of secretion and their major target cells.(C) Interaction between the three integration systems to establish the homeostasis of the internal milieu. TRH= thyroid releasing hormone, TSH= thyroid stimulating hormone, PRH= prolactin releasing hormone, PRL= prolactin, GnRH= gonadotropin releasing hormone, FSH= follicle stimulating hormone, LH= luteinizing hormone, GHRH= growth hormone releasing hormone, GH= release hormone, CRH= corticotropin releasing hormone, ACTH= adrenocorticotropic hormone, ADH= antidiuretic hormone.
18 Nonetheless, a living being so complex and so organized, will eventually wear out and die. Therefore, humans like the majority of the species depend on the reproductive system to maintain their continuity. The copulation and the reproduction are assured by a group of female genital organs (ovaries, fallopian tubes, uterus, and vagina) and male genital organs (testicles, spermatic ducts, sex glands, and penis). Also, the physiology of the reproductive system is under the control of the regulatory systems (Brooker et al. et al. 1998) .
B- The body weight management
The body weight is defined by the grand total of bones, organs, body fluids and adipose tissue. The percentage of fat mass and free fat mass compartments is subject to continuous modifications as a result of changes in reproductive status, growth, aging, fever and excessive sport. Asserting body weight homeostasis is crucial to defend against extravagant weight fluctuations(Gee et al. 2008).This equilibrium is managed by the metabolic energy network and the control of food intake.
B. 1 The metabolic energy network
The energy is the ability of a system to perform work such as heart beating and respiration. The animals pick up energy mainly from protein, carbohydrate and fat metabolisms. After processing, the ingested foodstuffs could be transformed to energy-rich substances (adenosine triphosphate = ATP) and heat. Once ATP is hydrolyzed energy is produced and may be used as a fuel for cellular processes, muscle activity, ion transport, etc… An ideal diet should also provide water, minerals, vitamins and roughage (indigestible plant fibers: cellulose…), which facilitate the transit of food in the digestive tube.
The metabolic energy network is made up of a group of organs and cells involved in energy consumption, energy storage and regulation of energy usage. The cardinal goal of this network is to establish the metabolic homeostasis. On one hand, the supplied energy is used for different cellular processes; whereas an excess in energy supply will activate a cascade of events to store the energy in the white fat cells as triacylglycerol or in the liver cells as glycogen. On the other hand, the metabolic network will mobilize the energy from its stores when the supply is reduced. The main components of this network are (Despopoulos et al. 2003; Gee et al. 2008):
B.1.1 The digestive system: intake, processing and distribution of foodstuffs
Foodstuffs enter the body via the mouth where they are mixed with the saliva. Mammalian saliva is a heterogeneous biological fluid, composed of water (H2O), solutes (low concentrations of
-19 )) and proteins (mucins, α-amylase, lingual lipase, lysozyme, immunoglobulin A, growth factors and KalliKrein). Saliva constituents reflect its crucial functions. At first, water and mucins lubricate the food while eating thus facilitating its decomposition and swallowing. Besides that, digestion of starch and triglycerides start in the mouth due to presence of the α-amylase and the lingual lipase respectively. Saliva is a hypotonic solution with low NaCl concentration that serves in maintaining the oral hygiene and rinsing the teeth and the taste receptors. Moreover, the high HCO3- content regulates the pH and helps in protecting the tooth, the upper gastrointestinal
tract by buffering the oesophagus and neutralizing the acidity of gastric fluid during vomiting. In addition, the growth factors can repair the damaged oral tissues. Saliva also defends against different types of aggressors(Melvin et al. 2005; HETIZMAN et al. 2008; Ueda et al. 2013). Next, the swallowed nutrients are transported via the oesophagus to the stomach where they are transformed into a liquid form termed chyme. The latter is periodically ejected to the small intestine, facilitating its decomposition by the pancreatic, hepatic and intestinal secretions. The resulting products (amino acids, free fatty acids, and monosaccharaides) as well as water and vitamins are absorbed in the mucosa of the small intestine. Then the waste products and the excess of ions and water move down the large intestine; this organ serves as a last stop for fluid and minerals absorption, and as a storage area for feces (Despopoulos et al. 2003).
B.1.2 Cells and molecules implicated in glucose homeostasis and energy management
Glucose is the essential carbon and energy source for the body. The ability of the organism to eliminate the excessive amount of glucose from the bloodstream following a meal (glucose tolerance) is of paramount importance. The failure in the establishment of glucose homeostasis in the blood may lead to severe complications such as hypertension and kidney failure.
After a meal, the high level of glucose in blood stimulates insulin secretion from the β-cells of the pancreas. The secreted insulin acts on the energy storage cells (adipocytes, skeletal muscle cells, and hepatocytes) to stimulate the uptake of the glucose. However, in the fasted state, the low level of glucose stimulates the secretion of glucagon from the pancreatic α-cells in order to increase the concentration of plasma glucose (Figure3) (Schwartz et al. 2013).
20
Figure 3:The central role of pancreatic islets in the maintenance of the normal level of plasma glucose (Schwartz et al. 2013).
a) Energy storing cells a. 1 The white adipose tissue
The white adipose tissue is one of the essential elements of the metabolic energy network. Grossly speaking, it is distributed throughout the body (Figure 4A, 4B). The white adipose tissue contains adipocytes, pre-adipocytes, white blood cells, endothelial cells, and fibroblasts (Wozniak et al. 2008). At the cytological level, the white adipocytes are spherical cells, characterized by a single lipid droplet made up of triacylglycerols generated from the metabolism of fat, carbohydrate, amino acids, and from the glucose uptake. Thus, the nutritional status of the body could modify the amount of lipid in this droplet (Figure 4C) (Berridge et al. 2012).
Following a meal, the secreted insulin binds to its receptor on the adipocyte, facilitates the glucose uptake from the blood, and drives lipogenesis in the white fat cells to store the energy. In contrast, when the energy is needed to accomplish a physiological process, several hormones (e.g. glucagon, adrenocorticotropic hormone (ACTH), and norepinephrine (NE)) drive lipolysis and release fatty acids and glycerol into the blood (Figure 4C) (Berridge et al. 2012).
Moreover, the adipose tissue is also considered as an endocrine organ secreting hormones, proteins, and cytokines. These molecules are important mediators of metabolism and inflammation (Figure 5) (Wozniak et al. 2008).
21
Figure 4: The adipose tissue.
(A) In humans, the white adipose tissue is widely distributed in the body but mainly in
subcutaneous and intra-abdominal areas. However, the brown adipose tissue is abundant in new born babies but in the adults it is present in cervical, supraclavicular, and paravertebral regions (Bagchi et al. 2012). (B) Scheme showing the distribution of the two types of adipose tissue in a mouse at 20 degree Celsius (Scale bar represents 2 cm) (Bagchi et al. 2012).(C) Illustration showing the role of adipocytes in establishing the metabolic homeostasis (Berridge et al. 2012).
22
Figure 5: Relation between the white adipose tissue and metabolism
The white adipose tissue may regulate the metabolism by modulating the energy homeostasis, the adipocyte differentiation, and insulin sensitivity. Moreover, the white adipose tissue plays an important role in the inflammatory control, in protecting the cardiovascular system, and in vascular inflammation(Wozniak et al. 2008).
a. 2 The liver
The hepatocytes or liver cells have various crucial functions in the body; of particular interest is the maintenance of steady level of blood glucose (euglycaemia). After digestion, the nutrients are absorbed in the intestine and then transported to the liver via the portal vein. Subsequently, this hyperglycaemia induces hyperinsulinaemia that will stimulate the glucose uptake by the liver cells. In the hepatocytes, the glucose is stored as glycogen. In contrast, when the energy is required after fasting or due to stress, several hormones (e.g., ACTH, adrenaline, and glucagon) drive the glycogenolysis and gluconeogenesis; thus increase the hepatic glucose production (Figure 6)(Schwartz et al. 2013).
23
Figure 6:Regulation of glucose metabolism by the hepatocytes.
The hepatocytes manage their glycogen stores: on one hand, via the activity of the insulin (synthesis) and on the other hand, via glucagon, adrenaline, and ACTH (glycogenolysis). The ultimate goal is to maintain the euglycaemia (Berridge et al. 2012).
b) Energy consuming cells
The main three types of energy consuming cells are:
- The mammalian brain: It is the main glucose consumer organ of glucose (~5.6 mg glucose per 100 g human brain tissue per minute). The glucose is used by the neurones for cellular maintenance and for the production of neurotransmitters. Therefore, providing continuous and stable amount of glucose to the brain is essential for its normal physiology(Mergenthaler et al. 2013).
- The skeletal muscle cells: They transform the chemical energy into mechanical energy that is used during movements and exercises. In parallel, the skeletal muscle cells may also act as a glycogen storing cells under the control of insulin (Jensen et al. 2011). - The brown adipose tissue: It exists in specific areas of the human body (Figure 4A, 4B),
and it is mainly implicated in thermogenesis. The brown adipose tissue consumes the energy stored in the lipid droplets (triacylglycerols) to generate heat (Berridge et al. 2012).
24 B. 2 The control of food intake
Food intake brings to the body the energy needed to balance the amount of energy burned during various cellular processes. In order to maintain this energy balance, the feeding and the satiety are controlled by neuronal and endocrine signalling systems:
The feeding center in brain can respond to sensory stimulations (visual, taste, and smell) initiating the food uptake. Following the entry of the foodstuffs to the gastrointestinal tract, the stomach, the gut and the pancreas secrete hormones that may stimulate or inhibit the appetite; here are some examples (Figure 7):
- Ghrelin is a hormone secreted mainly by the stomach before the meal, and stimulates the feeding center in the brain
- Cholecystokinin (CCK), glucagon like-peptide 1 (GLP-1), and peptide YY (PYY) are secreted in the gastrointestinal tract and transported via the blood to the brain, where they act as satiety signals.
In parallel, the body fat mass and fat-free mass can also participate in the regulation of energy intake. On one hand, the white adipocytes can ‗sense‘ the content of their lipid droplets and secrete tonic hormones such as leptin (inhibits the feeding center in the brain) for long-term regulation of the energy stores. On the other hand, the daily physiological demand of energy (resting metabolic rate), body movements, and exercise can also regulate the food uptake to balance the energy expenditure (Figure 7) (Stensel et al. 2010; Parker et al. 2014; Blundell et al. 2015; Moehelecke et al. 2015).
Figure 7: A diagram showing the possible regulators of food intake and energy balance(Blundell et al. 2015).
25
II-
Weight imbalance: obesity complications
An imbalance between the energy intake and energy expenditure results in body weight fluctuations (e.g., gain or loss); the most common are overweight and obesity. Obesity is defined by an excessive accumulation of adipose tissue either generalized or localized within the body(Blundell et al. 2000; Proietto et al. 2004). Several ways could be used to assess the obesity such as:(De Lorenzo et al. 2016):
a- The body mass index (BMI):
It is a ratio of the weight to the squared height (BMI = weight (Kg) / height (m2)) of an individual, allowing to approximately determine the percentage of fat in the body. Based on this ratio, the people could be divided into five categories: underweight, normal weight, overweight, obese class I, obese class II, obese class III (Table 2).
Table 2: Table showing the classification of the overweight and obesity(De Lorenzo et al. 2016)
Categories Body mass index ( Kg/m2)
Underweight < 18.5
Normal weight 18.5-24.9
Overweight 25.0-29.9
class I obesity 30.0-34.9
class II obesity 35.0-39.9
Class III, extreme obesity ≥ 40
b- waist circumference (WC) :
The measurement of the waist circumference could be performed according to the National Health and Nutrition Examination Survey (NHANES) (measurement at the top of iliac crest) or according to the World Health Association (WHO) (midpoint between last palpable rib and top iliac crest) (Pettitt et al. 2012). The WC indicates the amount and the distribution of the fat within the body. Furthermore, a WC over 102 cm in men and over 88 cm in women indicates an excess in sub-cutaneous truncal-abdominal fat, termed android obesity. The ―apple-shape‖ or android obesity is more common among men(WHO 2008).
Obesity has exceeded the stage of dietary measures and has reached alerting level worldwide. Recent reports revealed that the prevalence of obesity is high in different countries such as USA, Saudi Arabia and Lebanon (Figure8and 9) (Nasreddine and Naja et al. 2012; AL-Quwaidhi et al. 2014; Ogden et al. 2014; Vilet-Ostaptchouk et al. 2014). Moreover, the prevalence of obesity among young population aged 5-17 years and among young men of reproductive age is very high(Wu et al. 2006; Ng et al. 2014; McPherson et al. 2015).
26
Figure 8: The prevalence (%) of obesity among adults in different countries (Nasreddine
and Naja et al. 2012; AL-Quwaidhi et al. 2014; Ogden et al. 2014; Vilet-Ostaptchouk et al. 2014; Julia et al. 2016).
Figure 9: The high prevalence (%) of overweight and obese among young population aged 5-17 years in both developed and developing countries(Wu et al. 2006).
When the body weight increases, histological changes occur in the white adipose tissue such as an increase in the number and size of white adipocytes as well as in the number of infiltrated white blood cells and apoptotic adipocytes. These modifications are accompanied with an altered
87% 10%
3%
27 secretion profile of the white adipose tissue (e.g., an increase in the levels of pro-inflammatory cytokines (tumor necrosis factor, and interleukin 6), an increase in the level of the free fatty acids, leptin, resistin, and decrease in the concentration of adiponectin) (Wozniak et al. 2008).Altogether, these alterations play a key role in the in the development of several pathologies such as type 2 diabetes mellitus (T2DM), cardiovascular diseases, respiratory diseases, and infertility (Golay et al. 2005; Fulleston et al. 2012). Of particular interest, obesity is one of the leading factors for the high prevalence (8.5%) of diabetes in Lebanon (Costanian et al. 2014) (Figure 10).
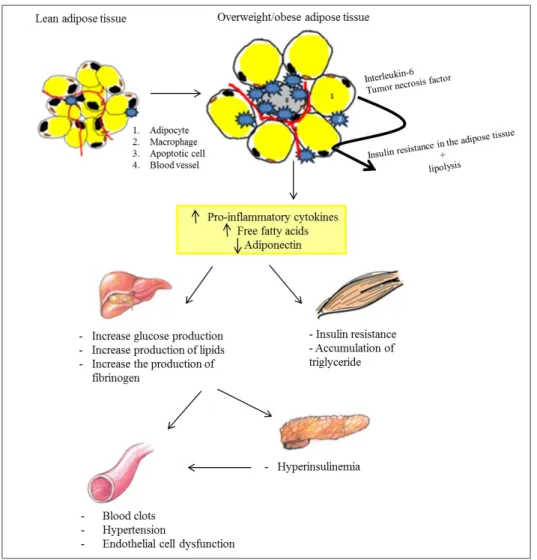
Figure 10: The central role of adipose tissue in the development of obesity-associated complications.
The expanded white adipose tissue (WAT) in obese subjects enhances the release of the interleukin-6 and the tumor necrosis factor resulting in insulin resistance in the WAT. Subsequently, the insulin resistance increases the lipolysis in the WAT. Moreover, the affected WAT releases high levels of pro-inflammatory cytokines, free fatty acids and low levels of adiponectin. These secretions promote insulin resistance and lipid accumulation in the muscle
28 cells. Also, they increase the production of glucose, lipid, and fibrinogen by the hepatocytes. Subsequently, the high level of plasmatic glucose will increase the insulin production by the pancreas leading to a hyperinsulinemia. This results in the loss of homeostasis in blood vessels (Eckel et al. 2005; Wozniak et al. 2008; Gauthier et al. 2010).
In the following sections we will focus on the effect of obesity on the urogenital apparatus, but mainly on the kidney and testicular homeostasis. This apparatus is characterized by a topographic and embryologic relationship between its organs (Hinrichsen et al. 1986).
A- The drawbacks of obesity on kidney homeostasis
The increase in the prevalence of obesity parallels the increase in the chronic kidney disease worldwide(Sharma et al. 2014). As mentioned earlier, obesity can lead to the development of hypertension and type 2 diabetes which together account for approximately 70% of end-stage renal disease(Griffin et al. 2008).
A. 1 Kidney physiology
The mammalian body contains 2 kidneys that are located in the retro-peritoneal region, on either side of the vertebral column. They play a pivotal role in the urine formation, in the excretion of metabolic waste products and toxic molecules, in the maintenance of Na+ homeostasis, in osmoregulation, and also function as endocrine organs. At the histological level, each kidney is made up of approximately one million nephrons. Nephron is the functional autonomous unit of the kidney that has (Figure 11A) (Berridge et al. 2012):
- An afferent arteriole which branches and narrows into capillaries to form the glomerulus. The endothelial cells of each capillary are surrounded by a basement membrane, and an outermost layer of podocytes. These three layers form the healthy glomerular filtration barrier. This filtration barrier helps to serially limit the escaping of serum large proteins (e.g., albumin) from the capillary loop; an abnormal protein leakage from the capillaries may lead to tubulointestinal injury and thus a decline in kidney function (Figure 11 A, 11
B)(Jefferson et al. 2008).
- Between the capillaries of the glomerulus there is a group of specialized cells termed
mesangial cells. They are multifunctional cells; they can contract/relax and thus regulate
the blood flow. They play a structural role in the kidney due to their contribution in the secretion and degradation of the extracellular matrix (such as: fibronectin, collagen IV, percalan, and laminin).
- The glomerulus is surrounded by a Bowman’s capsule. The space created between the glomerulus and the Bowman‘s capsule is termed as Bowman’s space. The blood plasma and all the small soluble molecules exit the capillaries and accumulate in the Bowman‘s space; thus creating the primary urine filtrate.
29 - Then the primary urine flows into the nephron tubules. These tubules are surrounded by a second capillary network. The latter is created from branches of the efferent arteriole that leaves the glomerulus. This capillary network around the tubules is essential for modifying the composition of the primary urine filtrate.
- The filtrated urine first enters the proximal convoluted tubule (PCT).It is responsible of water and Na+ reabsorption from the urine. That‘s why the cells of the PTC contain aquaporins, and a specialised plasma membrane suitable for isotonic fluid reabsorption.
- Next, the filtrate enters the thin descending part of loop of Henle. At this level, the water is also reabsorbed by the aquaporin of the descending portion cells. Consequently, the urine becomes highly concentrated.
- As the concentrated fluid move up the thick ascending loop of Henle (TALH) the cells become tightly linked together; they can absorb sodium but they have less water permeability. Fascinatingly, the close association between the TALH and the arterioles of the glomerulus creates the juxtaglomerular apparatus (JGA). The cells of the TALH facing the JGA are specialised cells termed macula densa. They can detect the concentration of Na+ and Cl- in the urine (Figure 12). When the concentration of Na+ in the TALH is too high it will draw water out of the body and decreases the blood pressure. In order to maintain a steady blood pressure and to prevent dehydration, the kidney activates auto-regulatory mechanisms:
A. The macula densa cells detect the high concentration of Na+ and release ATP. The latter will stimulate the renin-producing granular cells. Consequently, these cells secrete renin that will transform the angiotensinogen in the plasma into angiotensin I. Furthermore, the angiotensin-converting enzyme (ACE) converts angiotensin I into angiotensin II (Figure 12).
B. By itself, angiotensin II is a hormone that can perform various functions (Figure 12): a) It stimulates the secretion of aldosterone by the adrenal gland. Aldosterone regulates
the reabsorption of Na+ by the distal convoluted tubules (DCT).
b) In addition, the angiotensin II may act on the brain to drive water uptake, and to stimulate the secretion of the vasopressin which is responsible of water retention. c) Plus, the angiotensin II and the ATP produced by the macula densa cells could act on
the smooth muscle cells to increase blood vessels constriction.
d) Moreover, angiotensin II inhibits the secretion of renin by the renin-producing granular cells.
30 - The dilution of the urine continues in the DCT with Na+, Cl-, and Ca2+ reabsorption. Finally, several DCT are connected to a collecting duct, where the cells of the upper region of the duct continue to reabsorb the Na+. However, water reabsorption in collecting ducts is only possible via the influence of the vasopressin (Berridge et al. 2012).
Figure 11: Anatomy of the nephron.(A)The structural organisation of the nephron (Berridge et
al. 2012).(B)The gross anatomy of normal healthy glomerulus (Jefferson et al. 2008).
31 A. 1.1 Obesity-related glomerulopathy (ORG)
The increase in the BMI was shown to be associated with pathological changes in the glomeruli histology and physiology(Griffin et al. 2008).
A. 1.1.a The effect of obesity on the glomerular histology(de Vires et al. 2014; Sharma et al. 2014; D'Agati et al. 2016):
- Glomerulomegaly (glomerular hypertrophy) is characterized by the increase in the glomerular diameter and/or volume measured on histological sections. The biopsy samples from obese individuals may show an increase in the diameter of the glomerular capillaries and the afferent arteriole. In response to the glomerulomegaly, the podocytes may show a mal-adaptive response to obesity by increasing their size (hypertrophic changes) and decreasing their density.
- Progressive glomerulosclerosis is defined as an increase in the extracellular matrix deposition and/ or sclerosis (fibrosis) between the capillaries of the glomerulus leading to their obliteration. The glomerulosclerosis occurs mainly at the glomerular vascular pole, but also it could develop at any site of the glomerulus. In a mice model of diet-induced obesity, histological sections of the kidney showed an increase in the thickness of the glomerular basement membrane, a mesangial matrix expansion, and an increase in the deposition of type IV collagen in the glomeruli. These findings indicate that the high fat diet may induce glomerular sclerotic injury in mice (Deji et al. 2008).
- Tubular damage and interstitial fibrosis are also common features in obese patients. A. 1.1.b Decline in renal function and obesity
a) Renal hemodynamics (Figure 13):
The glomerular filtration rate (GFR) is defined as the total fluid volume filtered by the glomeruli of both kidneys per unit time (~ 180 L/day). Approximately, 99% of the GFR is reabsorbed by the nephron tubules and 1% is excreted (urine output ~ 1to2 L/day). Moreover, some indicators present in the plasma may help to measure the GFR. For instance, the creatinine could be used as an indicator since it does not alter the renal function and it is freely filtered, not reabsorbed by the tubules, and not metabolized by the kidney. However, glomerular hyperfiltration is an abnormal increase in the GFR of the kidneys (Helal et al. 2012). Of particular interest, several studies showed that obesity is generally associated with systemic hypertension, resulting in glomerular afferent arteriole vasodilation. The high blood flow may augment the pressure inside the capillaries which may lead to an increase in the GFR (Chagnac et al. 2000).
32 Moreover, this abnormal glomerular hyperfiltration in obese subjects is more likely correlated to an increase in sodium concentration in the tubules (Strazzullo et al. 2001). To counterbalance the loss of this high concentration of salt, the renin-angiotensin-aldosterone system is overactivated. The level of aldosterone and angiotensin II were shown to be higher in obese subjects(Engeli et al. 2004). On one hand, angiotensin II stimulates Na+ reabsorption in the PCT. On the other hand, aldosterone and angiotensin II may induce efferent arteriole vasoconstriction which may increase the pressure inside the capillary and thus promotes further glomerular hyperfiltration. BMI and WC are independent predictors of sodium reabsorption in the PCT (D'Agati et al. 2016).
Secondary to the excessive reabsorption of salt in the PCT, the low levels of Na+ in the urine could be detected by the macula densa of the TALH. Consequently, the tubuloglomerular feedback is deactivated resulting in further afferent arteriole vasodilation and thus glomerular hyperfiltration (D'Agati et al. 2016). Moreover, the glomerular hyperfiltration may affect the protein handling in the glomeruli. Epidemiological and observational studies demonstrated that the prevalence of proteinuria or macroalbuminuria is increased in obese patients (Valensi et al. 1996; Chen et al. 2004).
Figure 13: Pathogenesis of obesity-related glomerulopathy. The two major players in the
development of ORG are the hypertension and the lipid accumulation in the kidney (D'Agati et al. 2016).
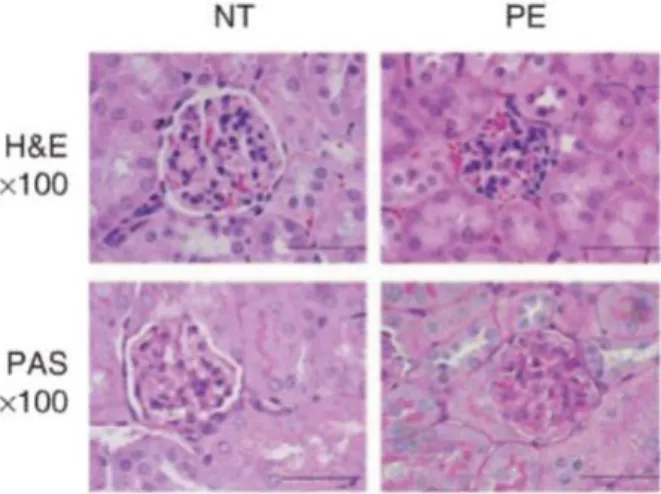
33 Altogether these hemodynamic changes in obese patients will lead to a glomerulomegaly with capillary growth, podocytes hypertrophy, detachment and apoptosis. Consequently, these histological lesions will develop the obesity-related glomerulosclerosis (D'Agati et al. 2016). Furthermore, chronic and serious hypertension (e.g.,pre-eclampsia during pregnancy)may increase the risk of renal failure and present small and condensed glomeruli, narrowed Bowman‘s space, and occluded capillary lumen on histological sections of the kidney (Datta et al. 2004; Siddiqui et al. 2011) (Figure 14).
Figure 14: Histological kidney sections. Histological kidney sections stained with
haematoxylin and eosin (upper panel) and with periodic acid Schiff (lower panel). These sections show the small glomerulus and the narrowed Bowman‘s space in the kidney derived from pregnant mice with pre-eclampsia (severe hypertension) (Siddiqui et al. 2011).
b) Hyperglycemia and hyperlipidemia:
In humans and mice, the adipose tissue increases the size and the number of its adipocytes as the body weight increases (Guo et al. 2004; Wozniak et al. 2008). It can secrete adipokines such as leptin, adiponectin, and resistin that could affect renal extracellular matrix, cellular hypertrophy and fibrosis in rodents (D'Agati et al. 2016). Moreover, obesity in humans and rodents may lead to the accumulation of lipids in the kidney ―fatty kidney‖ (mainly in mesangial cells and tubular cells), resulting in inflammation, and fibrosis (Figure 13)(de Vires et al. 2014).
In addition, obesity may induce the development of type 2 diabetes leading to a hyperglycemia. High glucose levels could activate several pathways in the kidney (e.g., hexokinase pathway, polyol pathway) promoting an abnormal deposition of the extracellular matrix components such as fibronectin and collagen I and IV in the glomerulus(Sharma et al. 2013; Reidy et al. 2014). The diabetic-kidney disease (DKD) is a leading cause of the development of end-stage renal disease. The DKD is characterized by: arteriole hyalinosis, basement membrane thickening, mesangial cells hypertrophy, nodular glomerulosclerosis development, podocytes hypertrophy/loss, albuminuria followed by a decline in the GFR, tubulointestinal inflammation and fibrosis (Alsaad et al. 2006; Tervaert et al. 2010; Reidy et al. 2014).
34
B- The drawbacks of obesity on testicular homeostasis
Andrology (from Greek Andros, man), is a multifaceted medical specialty dealing with normal and pathological aspects of male sexuality and reproductive health (Auger et al. 2009). Badly, there is an increase in the prevalence of male obesity among young men suffering from andrological disorders (Palmer et al. 2012) . The following section, will discuss in details the impact of obesity on the reproductive health of males.
B. 1 Male reproductive system anatomy (Figure 15)
The testicles are twin oval-shaped gonads that produce male gametes (motile spermatozoa) and sexual hormones. Testicular functions are thermodependent (~ 36oC) and sensitive to heat stress. That‘s why they are localised outside the body in the scrotum. The scrotum is a suspended thin skin sac, containing contracting muscles (dartos and cremaster) with minimal subcutaneous adipose tissue. These features plus the testis vasculature play a major role in the testicular thermoregulation, preventing hyperthermia and heat stress (Durairajanaygam et al. 2015). Furthermore, each testicle is attached to an epididymis characterized by sausage-shaped structure. The gametes mature as they pass through the epididymis and could be stored in it. The epididymis is connected to the vas deferens where the spermatozoa are mixed with the seminal vesicle secretions. Next, the spermatozoa are transported to the ureter due to the peristaltic contraction of vas deferens. In the ureter, the male gametes are exposed to the prostatic and Cooper gland secretions. The secretions of the different sex glands contribute to the complex content of the seminal plasma (Table 3). Finally, the semen (spermatozoa + seminal plasma) is ejaculated via the penile urethra (Caroppo et al. 2011).
35
Table 3: Table showing some of the sex gland secretions
Sex gland Molecules Functions References
Seminal vesicles
Fructose
Present at high concentrations (7.55-34.86 mM)
(Montagnon et al. 1982)
Source of energy (Owen et al.
2005)
Insulin
Its concentration in the semen is higher than in serum (19 ± 3µU/ml vs. 7.53µU/ml respectively)
(Hicks et al. 1973)
(Paz et al. 1977)
Largely unknown (Lampiao et
al. 2008) May enhance sperm motility (Lampiao et
al. 2008) Prostaglandins
Immune tolerance of male gametes in the female tract
(QUAYLE et al. 1989)
Semenogelin
Gelatinous entrapment of ejaculated spermatozoa, thus playing a major role in semen coagulation
(Wang et al. 2015)
Fibronectin Gelatinous entrapment of ejaculated spermatozoa, thus playing a major role in semen coagulation
(Wang et al. 2015)
Prostate
Carnitine Metabolism of fatty acids and antioxidant effect
(Abd-Allah et al. 2009) Calcium ions Regulation of sperm physiology and
modulation of oxidative stress
(Stru¨nker et al. 2011) Zinc Antioxidant, antibacterial, and
protection against heavy metals (lead)
(Dissanayake et al. 2010) Prostate-
specific antigen (PSA)
Digestion of the gel formed after ejaculation = liquefaction
(Wang et al. 2015)
Cooper gland Lubricating fluid
Neutralize urine acidity and lubricate the urethra
(Choughtai et al. 2005) By the sperm
itself
Glucose present in semen at a range of concentrations ( 0.22-16.37 mM)
(Bakos et al. 2010)
Present endogenously within the sperm as glycogen/ source of energy
(BALLESTER et al. 2000) Insulin Auto-regulation of glucose metabolism (Aquila et al.
36 B.1.1 The effects of obesity on testicular anatomy, sexual function and seminal plasma
biochemistry
The sedentary life style and the increase in calories intake by obese men could impair their reproductive health. On one hand, male obesity may lead to the accumulation of scrotal fat; thus inducing testicular hyperthermia. The excess of subcutaneous adipose tissue in the scrotum may inhibit the sperm production by the testicles and increase the risk of infertility. However, surgical removal of the scrotal fat in obese patients improves the sperm count, motility, and morphology (Sahfik et al. 1981; Durairajanaygam et al. 2015). On the other hand, erectile dysfunction and reduced libido are common conditions among obese men (Bacon et al. 2006; Larsen et al. 2007; Traish et al. 2009). Interestingly, these functions could be restored after weight loss (Esposito et al. 2004).
Furthermore, the sex accessory glands and the seminal plasma components could also be affected by male obesity(Binder et al. 2015).The seminal plasma is an alkaline gelatinous fluid (pH ~ 7.2), made up of seminal vesicle secretions (~60% of the total semen), and prostate gland secretions (~20% of the total semen volume). Moreover, this biological fluid not only serves as a transport and survival medium for spermatozoa, but also can modulate the female reproductive tract; potentially influencing the embryo development and implantation. It was demonstrated in mice, pigs, and humans, that seminal plasma induces a post-mating inflammatory response in the female tract, facilitating the embryo implantation. In addition, several studies in mammals highlighted the role of seminal plasma in regulating fetuses growth trajectory(Robertson et al. 2005; Lane et al. 2014). In a mice model of diet induced obesity, Binder and colleagues showed that seminal vesicle proteins and metabolites are affected by obesity. Also, clinical data indicate that obese men are at higher risk to have a reduced semen volume (Eisenberg et al. 2014) and an altered seminal plasma biochemistry. The level of insulin, leptin, fructose, and interleukin 8 were found to be higher in the semen of obese men; whereas the adiponectin, progranulin, and alpha-glucosidase levels were lower (Martini et al. 2010; Lotti et al. 2011; Thomas et al. 2012; Leisegang et al. 2014). Plus, men with type 2 diabetes had a higher level of nitric oxide (NO) in the seminal plasma when compared to non-diabetic men. NO can lead to an oxidative stress at high concentration, and its presence in the seminal plasma of diabetic men was posit ively correlated to the presence of oxidized nucleoside of DNA hydroxydeoxyguanosine (8-OHdG)). Further, malondialdehyde (MDA) which is one of the oxidative stress markers was detected at significantly higher level in the semen of men with type 2 diabetes when compared to non-diabetic ones. Altogether, these data open the question on the drawbacks of this altered seminal plasma composition in obese men on the spermatozoa, the uterine environment, and the embryo development.
Besides these alterations, several scientific papers hot spotted the correlation between obesity and prostate cancer. It was concluded that obese men are at greater risk to experience aggressive prostate cancer specific mortality (Discacciat et al. 2012; Moller et al. 2014).
37
B. 2 Testicular histology and physiology
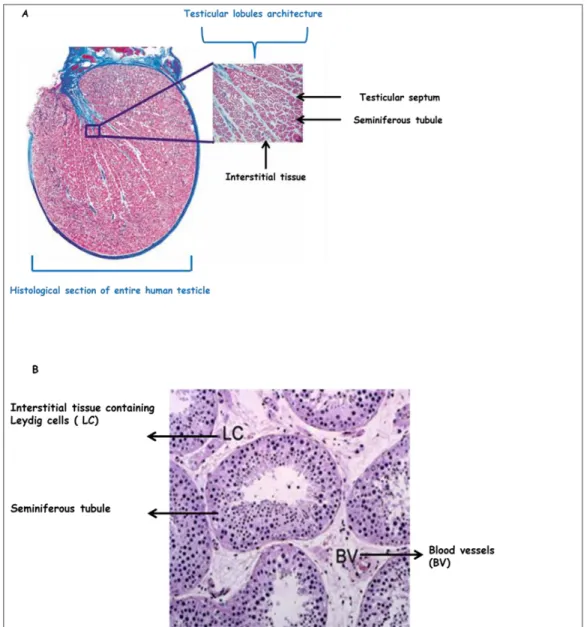
The human testis is divided by a group of septa into 250 to 300 lobules. Each lobule is composed of interstitial tissue and one to three seminiferous tubules (figure 16: A and B).The interstitial and the tubular compartments are histologically distinguishable from each other but are physiologically connected. All the processes involved in the production of male gametes take place in the tubular compartment, whereas the main function of the interstitial tissue is the production of male sex hormones. The integrity of both compartments is crucial for sperm cells (male gametes) differentiation (Weinbauer et al. 2010).
Figure 16: Histological section of the human testis(A)Histological section of entire human
testicle (Weinbauer et al. 2010). (B)Histological section of the human testis (x10) showing the two testicular compartments (McLchlan et al. 2007).