ORIGINAL ARTICLE
MRI with fibre tracking in Cogan congenital
oculomotor apraxia
Laura Merlini&Maria I. Vargas&Raoul De Haller&
Bénédict Rilliet&Joel Fluss
Received: 5 July 2009 / Revised: 27 January 2010 / Accepted: 7 February 2010 / Published online: 7 May 2010 # Springer-Verlag 2010
Abstract
Background Congenital ocular motor apraxia (COMA) occasionally shares with Joubert syndrome (JS) and related disorders (JSRDs) a peculiar malformation, the‘molar tooth sign’ (MTS). In JSRDs, the absence of superior cerebellar peduncles (SCP) decussation is reported.
Objective To investigate whether COMA demonstrates similar abnormal axonal pathways.
Materials and methods Eight healthy age-matched con-trols, three children with clinical COMA and one child with clinical JSRD underwent examination with a 1.5-T MRI scanner. Diffusion-weighted imaging (DWI), colour-coded fractional anisotropy maps and three-dimensional diffusion tensor imaging (DTI) tractography of the cerebellorubral network were analyzed.
Results On DTI cartography, the‘red dot’ originally supposed to represent the SCP decussation in the midbrain was present in
controls as well in those with COMA but absent in the single case with JS. In none of the subjects including controls was 3-D FT able to depict the SCP decussation. When seeded, the red dot resulted in the ventral tegmental decussation (VTD). It was normal in controls and in patients with COMA but was absent in our single patient with JSRD. MTS was identified in alla patients with COMA and in the patient with JSRD.
Conclusion MTS can be present in both COMA and JSRD but the underlying anatomy depicted by fibre tracking is distinct. The main difference is the integrity of the VTD in COMA. Keywords Joubert syndrome . Congenital ocular motor apraxia . MRI . Diffusion tensor imaging . Child . Molar tooth sign
Abbreviations
ADC Apparent diffusion coefficient COMA Congenital ocular motor apraxia CTT Central tegmental tract
DSI Diffusion spectrum imaging DTI Diffusion tensor imaging DWI Diffusion-weighted imaging FA Fraction anisotropy
FOV Field of view FT Fibre tracking
HARDI High angular resolution diffusion imaging JS Joubert syndrome
JSRDs Joubert syndrome related disorders MPR Multiplanar reconstruction
MTS Molar tooth sign
ODF Orientation distribution function OMA Oculomotor apraxia
PT Pyramidal tracts
PTCD Pontine tegmental cap dysplasia QBI Q-ball imaging
ROI Region of interest
L. Merlini (*)
Pediatric Radiology, University Hospital of Geneva, 6, Willy-Donzé,
1205 Geneva, Switzerland e-mail: [email protected] M. I. Vargas
Neuroradiology, University Hospital of Geneva, Geneva, Switzerland
R. De Haller
Pediatric Ophthalmology, University Hospital of Geneva, Geneva, Switzerland
B. Rilliet
Pediatric Neurosurgery, University Hospital of Geneva, Geneva, Switzerland
J. Fluss
Pediatric Neurology, University Hospital of Geneva, Geneva, Switzerland
SCP Superior cerebellar peduncles SNR Signal/noise ratio
VTD Ventral tegmental decussation
Introduction
Congenital oculomotor apraxia (COMA), also known as Cogan syndrome, is a rare disorder characterized by isolated ocular motor apraxia [1, 2]. In this condition, volitional horizontal saccades cannot be generated, while reflexive saccades, pursuit eye movements and vertical saccades are functional [3].
Oculomotor apraxia (OMA) is also a cardinal feature of Joubert syndrome (JS) and related disorders (JSRDs). In these entities, children generally present not only with ocular motor apraxia but exhibit ataxia, significant global developmental delay and various combinations of systemic abnormalities including retinal dystrophy, kidney cysts, liver disease and polydactyly [4]. The main radiological hallmark of JSRDs is the molar tooth sign (MTS). This image is the result on axial MRI of a peculiar form of hindbrain-midbrain malformation, that is a deep interpe-duncular fossa with elongated thick maloriented superior cerebellar peduncles (SCP) as well as dysplasia of the superior cerebellar vermis [5–7].
The MTS was thought to be pathognomonic of JS and related disorders (JSRDs) but it has been recently seen in cases of COMA and of pontine tegmental cap dysplasia (PTCD) [7–12]. Accordingly, Cogan syndrome and JSRDs appear to share the clinical features of ocular motor apraxia and also occasionally the radiological sign of MTS [13,14]. An additional hallmark of JSRDs is the complete absence of decussation of the pyramidal tracts (PT) in the caudal medulla and an abnormal decussation of the SCPs [15]. Studies on the molecular basis of JSRDs indicate that the primary cilium may be implicated in these disorders, which are thus all referred to‘ciliopathies’.
The abnormal pathways were originally observed from the autopsy of JS patients and were recently demonstrated by MRI studies with the use of fibre tracking (FT) [15–18]. In the
literature, decussation of the SCPs is classically identified in healthy subjects on the colour-coded fraction anisotropy maps (FA maps) as a red dot at the level of the inferior colliculi of the midbrain [19]. In JS patients, the absence of the red dot on colour-coded FA maps within the midbrain has therefore been assumed to be the sign of the failure of the SCPs to decussate. This non-decussation is reported to be a cardinal feature of JS and JSRDs [17,18].
The association between MTS and the absence of SCP decussation on FT MRI has also been recently described in a case of PTCD [11,12]. Based on this specific finding, the authors suggested that PTCD could be another example of a ciliopathy. Until now, this hypothesis has been difficult to confirm by genetic studies; apart from a marked phenotypic and genetic heterogeneity (nine genes are identified to date), many patients with JS and JSRDs still remain negative for genetic tests [20]. Furthermore, responsible genes have been identified neither in PTCD nor in COMA. However, despite the heterogeneity of JSRDs, functional-structural neuroimaging (DTI and FT) findings do not differ among the different genetic forms of JSRDs. In other words whatever the underlying genetic substrate, all patients with JSRDs show absence of the SCP and PT decussations [17]. The purpose of our study was to investigate whether patients with COMA and MTS exhibit similar abnormal decussating pathways to those found in JSRDs. This would eventually give support for a common underlying anatom-ical and genetic defect in these two yet distinct disorders, and/or give a clue regarding the anatomical substrate of COMA.
Materials and methods Patients
The institutional review board approved the project. Our study includes eight healthy age-matched controls, three children with clinical COMA (of whom two are siblings) and a single child with clinical JSRD. The clinical and imaging findings are summarized in Table 1.
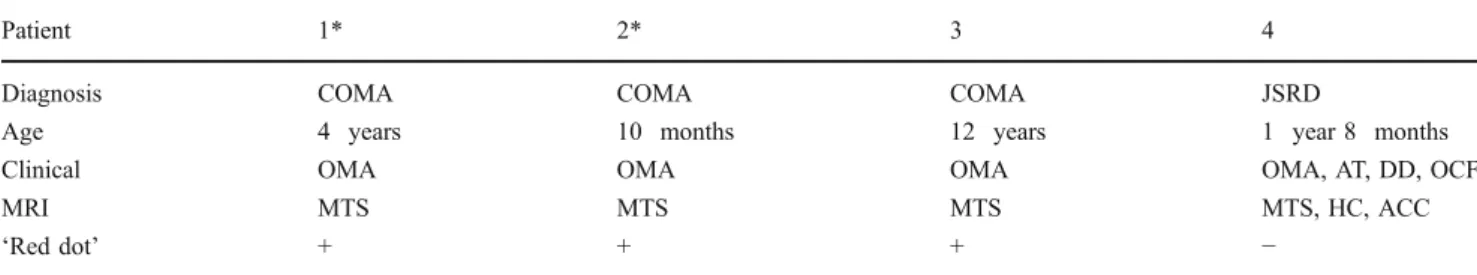
Table 1 Clinical and imaging findings in four children. * siblings, HC hydrocephalus, AT ataxia, DD developmental delay, OCF treated occipital
encephalocele, ACC partial agenesis of the corpus callosum,“Red dot” relates to a decussation point obtained in the colour-coded maps at the
midbrain level
Patient 1* 2* 3 4
Diagnosis COMA COMA COMA JSRD
Age 4 years 10 months 12 years 1 year 8 months
Clinical OMA OMA OMA OMA, AT, DD, OCF
MRI MTS MTS MTS MTS, HC, ACC
MR imaging
MRI studies were performed with a whole-body 1.5-T magnet using a dedicated 12-channel head coil (Avanto Siemens, Erlangen, Germany). The DTI measurements were performed in addition to a conventional imaging protocol (axial T2-weighted, coronal FLAIR and 3-D spin-echo T1-weighted sequences).
We recorded the radiological signs that in combination result in the molar tooth appearance. Any other associated morphological anomaly was also noted.
The diffusion tensor images were acquired in the axial plane with the following MR parameters: TE 92 ms, TR 9,000 ms, iPAT 2, number of excitations 1, field of view (FOV) 230, matrix 128×128, slice thickness 2 mm, resulting in a voxel size of 2×2×2 mm, b values = 0 and 1,000 s/mm2and 30 gradient directions. Diffusion weighting was implemented using a Stejskal-Tanner diffusion scheme (monopolar gradient) in order to achieve shorter TE, better signal/noise ratio (SNR) and reduced acquisition time. The DTI sequence duration was 5 min 44 s. FA, apparent diffusion coefficient (ADC) maps and tensor calculation were performed in-line by the MRI scanner. The 3-D datasets were analyzed using either the 3D Syngo (Siemens, Erlangen, Germany) task card [for simple multiplanar reconstruction (MPR) and maximum intensity projection (MIP) reconstruction on the 3-D STIR dataset] or using the Neuro3D Syngo software for fusion with FA maps calculated from DTI dataset or FT. The FA maps were calculated as the ratio of the anisotropic component of the diffusion tensor to the whole diffusion tensor, as published previously by Basser and Pierpaoli [21]. The 3-D orienta-tion of the major eigenvector was colour-coded per voxel according to the red-green-blue convention, red indicating a predominant left-right (x-element), green an antero-posterior (y-element), and blue a superior-inferior (z-element) orientation of the anisotropic component of
diffusion within each voxel. The colour intensity scale of the map was scaled in proportion to the measured FA-value. Presence or absence of the red dot on FA maps in the midbrain was recorded since its absence has previously been considered a marker of JSRDs [17,18].
We performed FT to confirm the findings of the colour-coded FA maps and to identify possible aberrant course of the analyzed tracts. Axial, coronal, and sagittal anatomic T1-W images were projected within the display for orientation purposes.
Fibre tracks were calculated using a fourth order Runge-Kutta algorithm from several seed points placed manually at different levels based on the anatomical knowledge of the fibre projection. The samples per voxel length were 1, with a step length of 1 mm, a curvature threshold of 0.2, FA threshold of 0.2 and an angle threshold of 30.0. A visual inspection of the reconstructed trajectories in each subject was carried out by the same investigator.
A region of interest (ROI) was placed within the SCPs and in the ipsilateral and contralateral red nucleus. Following the recommendations of Habas et al. [22] correct positioning of the seed points was also checked on T2-W images. Since the red nuclei are rich in iron, they are easily recognized as parasagittal hypointense foci within the mesencephalic tegmentum on T2-W images. Another seed point was also positioned within the mesencephalic tegmentum, in the red dot on the colour-coded maps, adjacent to the interpeduncular fossa. We compared FT results with the colour-coded DTI map in order to validate the significance of the ‘red dot’.
Results Controls
The SCPs have a rather vertical orientation [as shown by blue on colour vector DTI (Fig. 1)]. The red dot in the
Fig. 1 Colour vector DTI map in a normal child (a) and in a child with MTS (b). The vertical orientation of the SCP is coded in blue and horizontal orientation in green
midbrain at the level of the inferior colliculi was well visualized in all eight children (Fig.2).
Computed trajectories obtained from seeding the red nucleus, SCP and dentate nucleus identified an ipsilateral dentate-rubral tract which does not cross over the red dot (Fig.3).
Looking at the rostral direction from red nucleus seeding points, a bundle of fibres reaches the ventrolateral thalamus and projects to the prefrontal cortex and the sensory-motor cortex (Fig.3), as described in the literature [19,22,23].
The fibre tract obtained from seeding the midbrain red dot consists of the rubrospinal fibres that decussate at the
level of the ventral tegmental decussation (VTD also named Forel decussation in the French literature) and descend along the central tegmental tract [CTT (Figs. 4 and 5, red arrows)] [24].
COMA
In all three children conventional MR imaging showed the classic MTS (Fig. 6) with a deep interpeduncular fossa, thickened SCPs, a widened fourth ventricle and hypoplasia of the cerebellar vermis. However this sign was less obvious in patient 2 who had only mild manifestations of
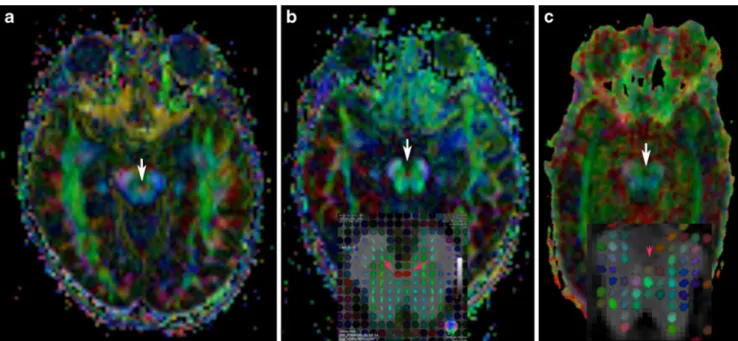
Fig. 2 Colour-coded vector DTIs at the level of inferior colliculi in normal (a), COMA (b) and JSRD (c) patients show absence of the red dot (arrow) in (c). The small figure in (b) indicates the major eigenvector map colour-coded tensor map superimposed to the anatomical dataset (axial T1-W slice at the level of the midbrain red
dot). In the small figure in b, clearly orientated right-left fibres lead to a strong anisotropy of the diffusion and thus to an elipsoidal tensor shape (pink arrows). This structure is lacking in the small figure in (c) (pink arrowhead)
Fig. 3 This illustrates the dentate-rubral tract through the SCP (red arrows) without decussation and the cortico-rubral pathway. In the rostral direction from the red nucleus a bundle of fibres reaches the ventrolateral thalamus and projects to the cortex. This result was the same in all patients
COMA and more pronounced in patient 3 with marked symptoms. Increased thickness of the SCP was more evident in patient 3 and the SCPs were asymmetric (left more than right) in patient 2. In patient 3, an abnormally thick corpus callosum was also present (not shown).
On colour-coded maps, the horizontal orientation of the fibres of the SCPs was confirmed in all children (Fig.1, arrows). In all COMA children a red colour coding dot was visible at the level of the inferior colliculi of the midbrain (Fig.2).
FT reconstruction in all three children demonstrated corticorubro-cerebellar tract and CTT pathways comparable to normal subjects (Figs.3,4 and5).
JSRD
In patient 4 with JSRD, conventional MRI showed horizontally oriented but thin SCPs (Fig. 6), a widened fourth ventricle, hypoplasia of the superior cerebellar vermis, hydrocephalus and partial corpus callosum agene-sis. An occipital encephalocele was treated early in infancy. Colour-coded FA maps demonstrated the absence of the transverse fibres at the level of the inferior colliculi of the midbrain, corresponding to the absence of the characteristic red dot deep within the interpeduncular fossa (Fig. 2). On FT reconstruction, the decussation of the rubrospinal tracts, corresponding to the red dot, was absent. FT reconstruction of the rubrocortical pathway was identical to that of the normal controls (Fig.7).
Discussion
Our study is an initial attempt to investigate diffusion tensor tractography in COMA and to compare the findings with recent work performed on patients with JS.
In the classical anatomical description (Dejerine and later Forel), the decussation of the SCP is a very large bundle placed just below the crossing of a much smaller structure, and by some anatomists even described as vestigial rubrospinal tracts, named the VTD. In the Duane E. Haines’ Atlas of Neuroanatomy [24, 25], schematic representations of anatomical transverse sections of the
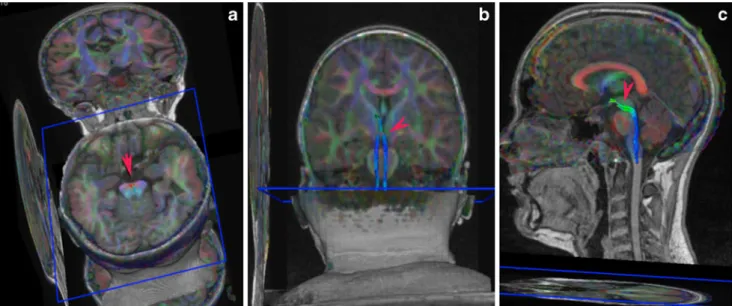
Fig. 4 a Axial, coronal (b) and sagittal (c) 3-D fibre tracking reconstructions obtained when seeding the red dot on the isthmic region. The ventral tegmental decussation (red arrows) continues in the CTT [in blue due to the vertical orientation (b and c)]
Fig. 5 This sagittal image shows the spatial relationship between the VTD (red arrowhead) and SCP (green arrowhead) in the isthmic region; note that the VTD is situated slightly cranial to SCP tracts
midbrain through the superior colliculus and caudal parts of the red nucleus, show the VTD in the interpeduncular fossa, just behind the interpeduncular nucleus; the rubrospinal tract corresponds to a very small bundle situated on both sides of the VTD. At the same level, the CTT lies behind the red nucleus. The SCP decussation is represented by a large zone situated medial to the red nucleus and its bulk lies essentially at the level of the cranial part of inferior colliculi [26].
In our study, the red dot was absent in our single child diagnosed with clinical JSRD and was clearly identified
in all three children with COMA along with all the controls.
In agreement with recent articles, we challenge the currently accepted anatomical interpretation of the midbrain red dot [27]. In previous works, the red dot located close to the deep interpeduncular fossa is assumed to correspond exclusively to the SCP decussation and the VTD is not recognized [19].
In the paper of Kamali et al. [28] the interpeduncular red dot is linked to the anterior mesencephalic decussation including both the SCP decussation and VTD. This
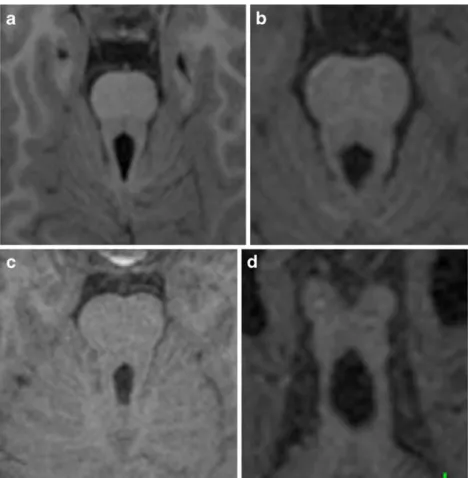
Fig. 6 Axial views show the different appearances of MTS in patients with COMA (a, b, and c) and with JSRD (d). The SCP are symmetrically thick in (a) and (c), asymmetrically thick in (b) and thin in (d)
Fig. 7 a FT of the cerebello-rubro-thalamic tract in patient 4. b No FT can be obtained when seeding the deep interpeduncu-lar fossa (arrow)
interpretation would suggest that actual neuroimaging techniques currently fail to demonstrate two distinct red dots and therefore cannot dissociate these two close anatomically but distinct crossing fibre tracts (VTD and SCP) even at 1×1×1 mm resolution.
Another hypothesis that we support is that the red dot is formed mainly by the VTD. At first sight it seems hard to conceive that the large SCP decussation cannot be demonstrated by DTI while the much smaller VTD can. On the other hand, the VTD can probably be depicted more easily due to a more homogeneous right-left fibre crossing pattern like the middle cerebellar peduncle or the pontine crossing tracts, which are always traceable.
The alignment of the red dot on colour-coded maps does not always match the classic anatomical description and can be a confounding factor. It is sometimes depicted at the level of the inferior colliculi and in other images at the level of the superior colliculi (Fig.5). A slight oblique orientation in the slices (a tilting of the axial plane, which is always variable from one patient to another) may align the inferior colliculi with either the SCP or the VTD. Nevertheless, the localization of the red dot, which is slightly more anterior and superior than the SCP decussation (Fig. 5), seems to better correspond to the VTD. In addition, the restricted size of the red dot fits more accurately the small bundle of VTD rather than the thick and long bundle associated with SCP decussation. Finally, when the red dot is seeded, the resulting tractogram corresponds to the CTT (Fig.4) and this finding has already been reported by other authors [27]. This might seem paradoxical as CTT fibres do not decussate. This could be in contradiction to the findings that the seeding of the VTD generates pathways of the CTT. This is, however, plausible knowing the detailed anatomy of the CTT. This tract is mainly composed of extrapyramidal axonal fibres projecting from the parvocellular red nucleus to the ipsilateral inferior olivary nucleus and is part of the Guillain-Mollaret triangle. In humans, a very large number of rubrospinal and rubrobulbar fibres arising from the parvocellular part of the red nucleus decussate in the VTD and run within the CTT [29].
There are thus no anatomical objections to the hypoth-esis that the red dot corresponds to the VTD as reported by other studies.
Supporting the above results of the colour-coded maps and the significance of the absent red dot in patient 4 with clinical JS, VTD could not be identified by tractography in this single case. This has to our knowledge not been previously documented. Neuropathological descriptions of deceased Joubert patients do not mention the decussation of the rubrospinal tract through the VTD and point essentially to the known abnormal decussating pathways of the SCP and PT [15, 16]. Anatomopathological reappraisal of our hypothesis will certainly be useful.
A stronger objection is of a technical nature; fibre tracking cannot be taken as a gold standard for fibre anatomy, as FT data and FA maps are only two mathemat-ical manipulations from the same dataset.
Turning to the anatomy of the SCP in both COMA/ JSRD and normal controls, computed trajectories of the SCP could only identify an ipsilateral dentate-rubral tract not crossing over the median line. This finding is in agreement with the papers of Habas et al. [27] and Wakana et al. [19] and in contrast with two reports on FT in JS [17, 18]. We have not found so far in the literature convincing evidence of 3-D FT reconstructions of the SCP decussation, even when this anatomy is studied on a 3-T machine, with better resolution (1×1×1 mm voxel) and better SNR. This is probably due to the fact that when fibres cross within the same voxel, the FT algorithm fails due to the fact that the tensor becomes spherical and indicates no preferred directionality. We could therefore not draw any conclusions regarding SCP pathways in COMA patients.
In summary, the main difference in FT between our COMA and JSRD is the integrity of the rubrospinal fibres crossing through the VTD. The rubrospinal tract in animals is the main route for the mediation of voluntary movement. It is responsible for large muscle movements as well as for fine motor control [30]. It facilitates flexion and inhibits extension in the upper extremities. It is small and rudimentary in humans. However, in some other primates, experiments have shown that over time the rubrospinal tract can assume almost all the duties of the corticospinal tract when the corticospinal tract is damaged. Our findings could possibly explain why ataxia is a constant feature in JS and JSRD but not in COMA. In contrast to ataxia, oculomotor apraxia is present in both disorders. This can lead to the assumption that the shared neuroanatomical anomalies (i.e. vermis and SCP dysplasia) observed in both conditions are involved in the pathogenesis of oculomotor apraxia. In fact, together with the superior colliculus, functional MRI studies have demonstrated that the cerebellar vermis controls several aspects of saccade generation [31].
The other relevant point relates to the presence of MTS in patients with Cogan syndrome. This finding confirms a prior neuroradiological study showing that MTS is proba-bly present in a majority of COMA patients but could be missed, being often milder in its morphology than in the classical JSRDs [10].
In addition, the evidence of a different underlying defective anatomy between the two conditions suggests that Cogan syndrome, despite sharing MTS, does not truly belong per se to the spectrum of JSRDs and that it‘s underlying genetic defect is probably not a ciliopathy. This is however purely speculative and deserves more research. Our study has some limitations: first, we used a deterministic approach to FT, with a conventional
stream-lining tract-tracing algorithm. A major disadvantage of this technique is its inability to recover more than one fibre orientation within a single voxel, thus it lacks sensitivity in regions where heavy fibre crossing/kissing is occurring and small parallel tracts are tightly packed. More advanced solutions including probabilistic tractog-raphy performed with 3-T MRI, or fibre tract segmenta-tion have however not so far produced convincing 3-D reconstructions of the SCP decussation [23, 27]. More promising techniques are high angular resolution diffusion imaging (HARDI) tractography, or comprehensive diffu-sion spectrum imaging (DSI) [32–34]. These techniques combine stronger diffusion-weighting (higher b values) with diffusion measurements in 50 or more independent directions allowing the reconstruction of multiple fibre directions within a single voxel and avoiding the ‘kissing effect’. Q-ball imaging (QBI) is a method for estimating the water displacement orientation distribution function (ODF) from high angular resolution diffusion imaging data and has yielded detailed information about complex white matter structure [35]. The problem is that at the present time these techniques are not yet feasible in a clinically acceptable acquisition time for children.
Second, the problem of the tilting of the axial plane with consequent incorrect alignment of structures on colour-coded maps should be solved in the future by co-registration of the DTI data sets in a standard space; we hope that this procedure will allow one to effectively discriminate the precise localization of different structures. Third, in addition to technical limitations, we acknowl-edge that the number of cases in our study is small. However, the estimated prevalence of these pathologies is very low. Due to the rarity of these diseases, we think that all cases of MTS studied with FT should be recorded in an international database in order to have the widest possible study population to evaluate more reliably clinical, genetic and imaging findings.
Conclusion
FT 3-D reconstruction could not demonstrate the decussa-tion of the SCP at the level of the inferior colliculi in all the studied subjects independent of the presence or absence of MTS. The midbrain red dot was present in controls and COMA children (with MTS) and absent in a JSRD child. The ‘red dot’ likely corresponds to the ventral tegmental decussation and not to the SCP decussation. The absence of VTD in the child with JSRD is the main difference found by FT technique between JSRD and COMA patients and might explain the difference in the phenotype of these conditions.
Acknowledgements The authors are grateful to Dr Steven Singer
and Sev Fluss for their editorial assistance.
References
1. Cogan DG (1953) A type of congenital ocular motor apraxia
presenting jerky head movements. Am J Ophthalmol 36:433–441
2. Cogan DG (1966) Congenital ocular motor apraxia. Can J
Ophthalmol 1:253–260
3. Orssaud C, Ingster-Moati I, Roche O et al (2009) Familial congenital oculomotor apraxia: clinical and electro-oculographic features. Eur J Paediatr Neurol 13:370–372
4. Parisi MA, Doherty D, Chance PF et al (2007) Joubert syndrome (and related disorders) (OMIM 213300). Eur J Hum Genet 15:511–521
5. Maria BL, Hoang KB, Tusa RJ et al (1997)“Joubert syndrome”
revisited: key ocular motor signs with magnetic resonance
imaging correlation. J Child Neurol 12:423–430
6. Fluss J, Blaser S, Chitayat D et al (2006) Molar tooth sign in fetal brain magnetic resonance imaging leading to the prenatal diagnosis of Joubert syndrome and related disorders. J Child
Neurol 21:320–324
7. Maria BL, Quisling RG, Rosainz LC et al (1999) Molar tooth sign in Joubert syndrome: clinical, radiologic, and pathologic
signifi-cance. J Child Neurol 14:368–376
8. Gleeson JG, Keeler LC, Parisi MA et al (2004) Molar tooth sign of the midbrain-hindbrain junction: occurrence in multiple distinct
syndromes. Am J Med Gen 125A:125–134, discussion 117
9. Sargent MA, Poskitt KJ, Jan JE (1997) Congenital ocular motor apraxia: imaging findings. AJNR 18:1915–1922
10. Kondo A, Saito Y, Floricel F et al (2007) Congenital ocular motor apraxia: clinical and neuroradiological findings, and long-term intellectual prognosis. Brain Dev 29:431–438
11. Jissendi-Tchofo P, Doherty D, McGillivray G et al (2009) Pontine tegmental cap dysplasia: MR imaging and diffusion tensor imaging features of impaired axonal navigation. AJNR
30:113–119
12. Barth PG, Majoie CB, Caan MW et al (2007) Pontine tegmental cap dysplasia: a novel brain malformation with a defect in axonal
guidance. Brain 130:2258–2266
13. Liu W, Narayanan V (2008) Ataxia with oculomotor apraxia.
Semin Pediatr Neurol 15:216–220
14. Tusa RJ, Hove MT (1999) Ocular and oculomotor signs in Joubert
syndrome. J Child Neurol 14:621–627
15. Yachnis AT, Rorke LB (1999) Neuropathology of Joubert syndrome. J Child Neurol 14:655–659, discussion 669
16. Padgett KR, Maria BL, Yachnis AT et al (2002) Ex vivo high-resolution magnetic resonance imaging of the brain in Joubert’s syndrome. J Child Neurol 17:911–913
17. Poretti A, Boltshauser E, Loenneker T et al (2007) Diffusion
tensor imaging in Joubert syndrome. AJNR 28:1929–1933
18. Widjaja E, Blaser S, Raybaud C (2006) Diffusion tensor imaging
of midline posterior fossa malformations. Pediatr Radiol 36:510–
517
19. Wakana S, Jiang H, Nagae-Poetscher LM et al (2004) Fiber
tract-based atlas of human white matter anatomy. Radiology 230:77–87
20. Valente EM, Brancati F, Dallapiccola B (2008) Genotypes and phenotypes of Joubert syndrome and related disorders. Eur J Med
Genet 51:1–23
21. Basser PJ, Pierpaoli C (1998) A simplified method to measure the diffusion tensor from seven MR images. Magn Reson Med
22. Habas CC, Cabanis EAEA (2006) Cortical projections to the human red nucleus: a diffusion tensor tractography study with a
1.5-T MRI machine. Neuroradiology 48:755–762
23. Habas C, Cabanis EA (2007) Cortical projection to the human red nucleus: complementary results with probabilistic tractography at 3T. Neuroradiology 49:777–784
24. Duane E. Haines (2007) In: Neuroanatomy: an Atlas of Structures, Sections, And Systems. Seventh edn, Lippincott Williams & Wilkins, pp132, Fig 6–24A
25. Duane E. Haines (2007) In: Neuroanatomy: an Atlas of Structures, Sections, And Systems. Seventh edn, Lippincott Williams &
Wilkins, pp133, Fig 6–24B
26. Duane E. Haines (2007) In: Neuroanatomy: an Atlas of Structures, Sections, And Systems. Seventh edn, Lippincott Williams &
Wilkins, pp130, Fig 6–23A
27. Habas C, Cabanis EA (2007) Anatomical parcellation of the brainstem and cerebellar white matter: a preliminary probabilistic
tractography study at 3T. Neuroradiology 49:849–863
28. Kamali A, Kramer LA, Butler IJ et al (2009) Diffusion tensor tractography of the somatosensory system in the human
brain-stem: initial findings using high isotropic spatial resolution at
3.0T. Eur Radiol 6:1480–1488
29. Nathan PW, Smith MC (1982) The rubrospinal and central
tegmental tracts in man. Brain 105:223–269
30. Kennedy PR (1990) Corticospinal, rubrospinal and rubro-olivary projections: a unifying hypothesis. Trends Neurosci 13:474–479 31. Dieterich M, Bucher SF, Seelos KC et al (2000) Cerebellar activation
during optokinetic stimulation and saccades. Neurology 54:148–155 32. Hagmann P, Jonasson L, Deffieux T et al (2006) Fibertract segmentation in position orientation space from high angular
resolution diffusion MRI. Neuroimage 32:665–675
33. Chao YP, Cho KH, Yeh CH et al (2009) Probabilistic topography of human corpus callosum using cytoarchitectural parcellation and high angular resolution diffusion imaging tractography. Human
brain mapping 30:3172–3187
34. Nezamzadeh M, Wedeen VJ, Wang R et al (2009) In-vivo investigation of the human cingulum bundle using the optimization of MR diffusion spectrum imaging. Eur J Radiol Jul 15 [Epub ahead of print] 35. Barnett A (2009) Theory of Q-ball imaging redux: Implications