ARTICLE
Fuel metabolism during exercise in euglycaemia
and hyperglycaemia in patients with type 1 diabetes
mellitus
—a prospective single-blinded randomised
crossover trial
S. Jenni&C. Oetliker&S. Allemann&M. Ith&L. Tappy& S. Wuerth&A. Egger&C. Boesch&Ph. Schneiter& P. Diem&E. Christ&C. Stettler
Received: 27 February 2008 / Accepted: 18 April 2008 / Published online: 30 May 2008
# Springer-Verlag 2008 Abstract
Aims/hypothesis We assessed systemic and local muscle fuel metabolism during aerobic exercise in patients with type 1 diabetes at euglycaemia and hyperglycaemia with identical insulin levels.
Methods This was a single-blinded randomised crossover study at a university diabetes unit in Switzerland. We studied seven physically active men with type 1 diabetes (mean±SEM age 33.5±2.4 years, diabetes duration 20.1±3.6 years, HbA1c
6.7±0.2% and peak oxygen uptake [V:O2peak] 50.3±4.5 ml min−1 kg−1). Men were studied twice while cycling for 120 min at 55 to 60% of V:O2peak, with a blood glucose level randomly set either at 5 or 11 mmol/l and identical insulinaemia. The participants were blinded to the glycaemic level; allocation concealment was by opaque, sealed enve-lopes. Magnetic resonance spectroscopy was used to quantify intramyocellular glycogen and lipids before and after exer-cise. Indirect calorimetry and measurement of stable isotopes and counter-regulatory hormones complemented the assess-ment of local and systemic fuel metabolism.
Results The contribution of lipid oxidation to overall energy metabolism was higher in euglycaemia than in hyperglycaemia (49.4±4.8 vs 30.6±4.2%; p<0.05). Carbohydrate oxidation accounted for 48.2±4.7 and 66.6±4.2% of total energy expenditure in euglycaemia and hyperglycaemia, respectively (p<0.05). The level of intramyocellular glycogen before exercise was higher in hyperglycaemia than in euglycaemia (3.4±0.3 vs 2.7±0.2 arbitrary units [AU]; p<0.05). Absolute glycogen consumption tended to be higher in hyperglycaemia than in euglycaemia (1.3±0.3 vs 0.9±0.1 AU). Cortisol and growth hormone increased more strongly in euglycaemia than in hyperglycaemia (levels at the end of exercise 634±52 vs 501±32 nmol/l and 15.5±4.5 vs 7.4±2.0 ng/ml, respectively; p<0.05).
Conclusions/interpretation Substrate oxidation in type 1 dia-betic patients performing aerobic exercise in euglycaemia is similar to that in healthy individuals revealing a shift towards lipid oxidation during exercise. In hyperglycaemia fuel metab-olism in these patients is dominated by carbohydrate oxidation. Intramyocellular glycogen was not spared in hyperglycaemia. Trial registration: ClinicalTrials.Gov NCT00325559
S. Jenni
:
C. Oetliker:
S. Allemann:
A. Egger:
P. Diem:
E. Christ:
C. Stettler (*)Division of Endocrinology, Diabetes and Clinical Nutrition, Inselspital, Bern University Hospital and University of Bern, Freiburgstrasse CH-3010 Bern, Switzerland
e-mail: [email protected] C. Oetliker
Department of Anaesthesia, University Hospital Basel, Basel, Switzerland
S. Allemann
:
C. StettlerInstitute of Social and Preventive Medicine, University of Bern, Bern, Switzerland M. Ith
:
C. BoeschDepartment for Clinical Research,
Magnetic Resonance Spectroscopy and Methodology, University of Bern,
Bern, Switzerland L. Tappy
:
P. SchneiterDepartment of Physiology, University of Lausanne, Lausanne, Switzerland
S. Wuerth
Institute for Sport Science, University of Basel, Basel, Switzerland
Funding: This study was supported by unrestricted grants from the Oetliker-Stiftung für Physiologie, from the Swiss Diabetes Foundation, from NovoNordisk, Switzerland, and from the Swiss National Science Foundation.
Keywords Carbohydrate oxidation . Euglycaemia . Exercise . Glucose clamp . Glucose turnover . Hyperglycaemia . Insulin . Magnetic resonance spectroscopy . Type 1 diabetes mellitus Abbreviations
AU arbitrary unit
IMCL intramyocellular lipids
MRS magnetic resonance spectroscopy
Ra rate of appearance
Rd rate of disappearance
RPE rate of perceived exertion V:CO2 carbon dioxide production V:O2 oxygen uptake
V:O2peak peak oxygen uptake
Introduction
The performance of physical exercise imposes high demands on patients with type 1 diabetes mellitus. Although recom-mended by treatment guidelines [1], exercise may increase the risk of hypoglycaemia [2–4] and bears the risk of deteriorat-ing diabetes control due to complex interference with the regulation of glucose transport into working muscle [5].
Detailed insight into the metabolic processes during exercise in type 1 diabetic patients could refine treatment recommendations during physical activity. However, quan-titative data on fuel metabolism in exercising type 1 diabetic patients are scarce up to now. In clinical practice, patients are advised to adapt insulin doses when planning to perform exercise [1, 6]. The effects of differing levels of insulin on substrate metabolism in exercising type 1 diabetic patients have recently been reported [7]. Converse-ly, little is known on the complementary impact of differing levels of blood glucose on fuel metabolism and exercise performance in these patients. Recently, we found the contribution of carbohydrate and lipid oxidation to overall energy consumption to be similar in euglycaemia and hyperglycaemia during exercise up to 40 min, but the study design did not allow a detailed quantification of substrate fluxes [8]. Even less is known on the effect of differing glycaemic levels on fuel metabolism during aerobic exercise of longer duration in patients with type 1 diabetes mellitus. Studies in healthy individuals have consistently shown that increased availability of carbohydrates before or during exercise increased carbohydrate oxidation [9–13].
However, it is uncertain whether increased carbohydrate availability also induces a saving of intramyocellular glycogen during exercise [9, 14–20]. Interestingly, in healthy individuals, hyperglycaemia is generally accom-panied by physiological hyperinsulinaemia, thereby ham-pering direct application of these findings to diabetic patients.
The aim of the present study was to comprehensively compare the local and systemic fuel metabolism of type 1 diabetic patients performing aerobic exercise under stable euglycaemic and hyperglycaemic conditions at a similar and comparably low insulinaemia. We hypothesised that: (1) in euglycaemia, they would behave similarly to non-diabetic individuals, shifting fuel oxidation towards con-sumption of lipids in the course of exercise; (2) in hyperglycaemia, they would show persistent oxidation of carbohydrates; and (3) intramyocellular glycogen would be spared in hyperglycaemia, but not in euglycaemia.
Methods
Patients, preliminary peak oxygen uptake testing We recruited seven physically active male volunteers with type 1 diabetes mellitus for this study. Mean±SEM age and BMI were 33.5±2.4 years and 24.3±0.4 kg/m2. Average duration of physical exercise was 255±65 min per week. Diabetes duration was 20.1 ± 3.6 years, and all volunteers had continuous subcutaneous insulin infusion, with a mean insulin dose of 0.61±0.05 U kg−1 day−1. HbA1c was 6.7± 0.2%. Informed written consent was obtained and the study was approved by the local Ethics Committee. Peak oxygen uptake (V:O2peak) was determined during a stepwise incre-mental test on a bicycle ergometer with breath-to-breath spirometry (Cardiovit AT-104PC; Schiller, Baar, Switzer-land). The criteria used for attainment of V:O2peak were as follows: a heart rate >90% of predicted value, inability to pedal at a rate of 60 rev/min, a near maximal rate of perceived exertion (RPE) ≥19 [21] and a respiratory exchange ratio >1.10. Mean V:O2peak was 50.3±4.5 ml min−1kg−1.
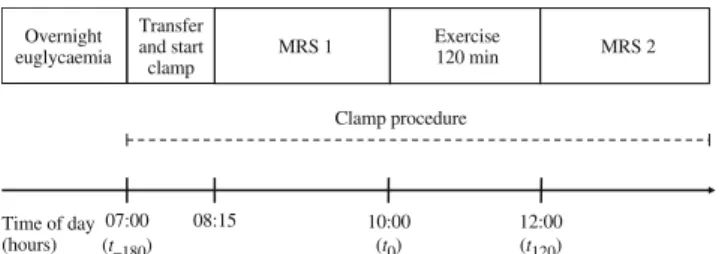
Study design This was a randomised, single-blinded, cross-over trial. Each participant was investigated twice at an interval of 7 weeks (range 6–10). Patients were blinded to glycaemia, randomly set to either euglycaemia or hyper-glycaemia. Randomisation was by sealed opaque envelopes. Prior to the first test, participants were familiarised with the study procedures including a full ride over 120 min. The experimental plan of the main test is outlined in Fig.1. Pre-test standardisation procedures and overnight prepara-tion phase Prior to the main test, patients followed an
isoenergetic diet (145–165 kJ/kg body weight; 60% carbohydrate, 20% protein, 20% fat). Strenuous exercise was not allowed for 72 h and the patients refrained from alcohol for 48 h before the main test. Patients arrived at the hospital the night before the main experiment and stayed overnight. At 20:00 hours they were offered a standardised meal corresponding to 35% of their expected basal energy requirements (60% carbohydrate, 20% fat and 20% protein). Continuous subcutaneous insulin infusion was disconnected at 21:00 and an indwelling 18G cannula was inserted into one vein of each forearm, for sampling and administration of insulin, glucose and tracer, respectively. Overnight, glucose concentrations were maintained within the 4–7 mmol/l range with variable infusion of regular insulin (Actrapid; Novo Industries, Copenhagen, Denmark). Patients were then kept fasting but had free access to sugar-free water until the end of the study on the following day.
Exercise test and spirometry The exercise consisted of 120 min (start=t0) cycling at a power corresponding to 55– 60% V:O2peak. Spirometry was performed from t−10to t15, t50 to t70 and t100 to t120. Urinary urea and glucose concen-trations were analysed before and during exercise to quantify nitrogen excretion [22] and glucose spill-over. Rates of substrate oxidation were then calculated using standard equations [23,24]. ECG was monitored continuously, blood pressure was regularly measured and RPE was assessed by the Borg scale every 10 min.
Euglycaemic and hyperglycaemic clamp procedures For the clamp the insulin infusion was fixed at a rate (median 7 mU m−2 min−1, range 5–8.2 mU m−2 min−1) corresponding to the individual reduced basal rate commonly applied during a similar exercise. Euglycaemia (target level 5 mmol/l) or hyperglycaemia (target level 11 mmol/l) were maintained by infusion of 20% dextrose [25]. Blood glucose was measured every 5 min and glucose infusion was adapted accordingly. When stable glycaemia was reached, infusions of stable isotopic tracers were started: D-[U-13C]glucose was infused at a rate of 1.25 μg kg−1 min−1 (primed with 25 μg kg−1 [mmol/l glucose]−1). D-[6–6–2H2]Glucose was infused at a rate of 30μg kg−1min−1(primed with 0.6 mg kg−1[mmol/ l glucose]−1). The bicarbonate pool was simultaneously
primed with 6 μmol/kg NaH13CO3. During exercise the infusion rates were quadrupled in order to minimise changes in enrichment [26]. Isotopes were manufactured by Cam-bridge Isotope Laboratories, Innerberg, Switzerland. Sterile pathogen-free solutions were prepared by the University Hospital Pharmacy, Lausanne, Switzerland.
Samples and biochemical analysis Blood glucose and lactate were measured every 5 min by an immobilised glucose-oxidase and lactate-oxidase method (YSI2300; Yellow Springs Instruments, Yellow Springs, OH, USA) and are presented in 15 min intervals. Serum insulin and NEFA were sampled twice before exercise and every 15 min during exercise. NEFA were determined using a commercially available kit (Wako Pure Chemical, VWR International, Dietikon, Switzerland). Counter-regulatory hormones were sampled twice before exercise and twice during the last 10 min of the exercise. They are reported as mean pre- and post-test values. Catecholamine levels were determined by high-performance liquid chromatography (PU-980; Jasco, Tokyo, Japan) coupled to an electrochem-ical detector (CLC 100; Chromosystems, Munich, Germany). Growth hormone was measured using a chemiluminescence method (Immulite One; DPC, Los Angeles, CA, USA). Glucagon was measured using a double radioimmuno-assay (Siemens Medical Solutions Diagnostic, Los Angeles, CA, USA) in EDTA plasma mixed with aprotinin, immedi-ately cooled and frozen after separation. Cortisol and insulin were measured with electro-chemiluminescence immuno-assays (Roche Modular-E170; Roche Diagnostics, Rotkreuz, Switzerland).
Tracer samples and glucose turnover Double background enrichment measurements (blood and breath samples) were taken prior to infusion at 07:00 hours (t−180). After a 160 min equilibration phase to reach steady-state tracer enrichments, two blood and breath samples were obtained before exercise (t−20 and t−10). Blood samples were obtained during exercise at t90, t100, t110 and t120. Breath samples were obtained at t90 and t120 and collected in vitreous tubes. Isotopic enrichments of D-[6-6-2H2]glucose were determined by gas-chromatography mass-spectrome-try (GC 5890/MS 5971; Hewlett-Packard, Palo Alto, CA, USA). Isotopic enrichment of 13CO2and 13C glucose was measured by isotope ratio mass spectrometry (Tracermass 13
C/15N; Europa Scientific, Crewe, UK). At rest glucose rate of appearance (Ra) and rate of disappearance (Rd) were calculated from D-[6-6-2H2]glucose enrichments using Steele’s equations [26]. During exercise non-steady state conditions were presumed and Ra and Rd were calculated using the modified Steele equations for non-steady state conditions [26] assuming an effective fraction of 0.65 and a distribution volume of 0.22 l/kg. The oxidation rate of 07:00 (t–180) Exercise 120 min MRS 2 MRS 1 Overnight euglycaemia 08:15 10:00 (t0) 12:00 (t120) Transfer and start clamp Time of day (hours) Clamp procedure
Fig. 1 Experimental plan. Timepoint 0 (t0) denotes start of exercise.
systemic glucose was calculated from labelled 13CO2 and labelled D-[U-13C]glucose, using a recovery factor of 0.8 during rest and 1.0 during the exercise [27]. Endogenous glucose production was calculated from the infusion rate and the total Ra. Glucose disposal was calculated by taking into account the urinary glucose loss. The difference between net carbohydrate oxidation and the oxidation of systemic glucose was used to calculate glycogen breakdown rates. Magnetic resonance spectroscopy Muscular glycogen [28] and intramyocellular lipids (IMCL) [29] were measured sequentially in the right m. quadriceps by 13C and 1 H-magnetic resonance spectroscopy (MRS) before and after exercise on both test occasions (total four measurements per participant). Mean±SEM interval between start of the clamp and start of the MRS was 55±7 min. The right leg was placed in a specially designed cast to guarantee a reproducible position of the muscle within the magnetic field. Positioning at initial measurement and repositioning (the following three measurements) of the 1H/13C-coil as well as of the 1H-voxel was monitored by two series of localiser images. The total time for one combined mea-surement of glycogen and IMCL was 95 min. All MRS examinations were performed on a clinical 1.5 T whole-body scanner (SIGNA, General Electric, Milwaukee, WI, USA) equipped with a 13C/1H double-tuned flexible coil (1H: Helmholtz design, 13C: single turn 11.5×11.5 cm2, Medical Advance, Milwaukee, WI, USA).
For1H-MRS, IMCL was measured in an 11×12×18 mm3 (in right/left×anterior/posterior×inferior/superior directions) sized voxel in m. vastus intermedius using an optimised short echo time point resolved spectroscopy (PRESS) sequence (repetition time TR=3 s, echo time TE=20 ms, 2,000 Hz, 1,024 pts, 128 acquisitions, water presaturation and outer volume suppression) and quantified using the unsuppressed fully relaxed water signal as internal concen-tration standard. IMCL concenconcen-trations in absolute units of mmol per kg muscle wet weight (mmol/kgww) were calculated as reported earlier [30]. A reproducibility study
revealed a typical CV of 6% for repeated measurements [29] of IMCL.
For 13C-MRS, glycogen and creatine content were measured by 13C-MRS using a pulse-and-acquire sequence (adiabatic 90° excitation, repetition time TR= 165 ms, 5,000 Hz, 512 pts, 12,000 acquisitions per measurement). 1
H decoupling during data acquisition and nuclear Over-hauser effect build-up between the acquisitions were done using a partially home-built second channel. Absolute glycogen concentrations were normalised to the creatine signal and expressed in arbitrary units (AU). Relative glycogen changes denote percentage changes during exer-cise. Signals of glycogen and creatine were evaluated using the jMRUI software package (version 3.0, Magnetic Reso-nance User Interface, University of Barcelona, Spain) as described in detail in [31].
Statistical analysis Values are expressed as mean±SEM. Non-normally distributed data were log-transformed. Paired data were compared using Student’s t test. For parameters with repeated measurements, AUCs were calculated. All analyses were performed using Stata version 9.2 (Stata Corporation, College Station, TX, USA).
Results
Euglycaemic and hyperglycaemic clamp procedures Insulin levels did not differ between euglycaemia and hyper-glycaemia, with mean levels during exercise at 121.5± 21.5 and 123.6±22.2 pmol/l respectively (Fig. 2a). Mean blood glucose during exercise was 5.4±0.5 mmol/l for euglycaemia and 11.0±0.3 mmol/l for hyperglycaemia (p< 0.001) (Fig. 2b). The total amount of infused glucose was higher for hyperglycaemia than for euglycaemia (733±182 and 283±89 mg/kg; p<0.05).
Exercise levels Mean exercise levels were similar in euglycaemia and hyperglycaemia (57.0±1.4 and 56.6±
0 2 4 6 8 10 12 14 Glucose (mmol/l) At rest 15 30 45 60 75 90 105 120 Time (min) Time (min) * * * * * * * * * a b Insulin (pmol/l) 0 50 100 150 200 At rest 15 30 45 60 75 90 105 120
Fig. 2 Insulin (a) and glucose (b) concentrations during rest and during 120 min of exercise in euglycaemia (black circles) and hyperglycaemia (white squares). Data are mean±SEM (n=7). *p<0.05 for differences between trials
1.2% of predetermined V:O2peak, respectively). There was an identical increase in RPE from baseline throughout the exercise in euglycaemia and in hyperglycaemic exercise conditions. Values at the end of exercise were 16.1±0.8 in euglycaemia and 15.6 ±0.9 in hyperglycaemia. Lactate levels were similar in euglycaemia and hyperglycaemia, starting at 0.6±0.1 and 0.7±0.1 mmol/l at baseline and increasing to a maximum of 1.3±0.3 and 1.4±0.3 mmol/ l respectively after 30 min. Thereafter, lactate levels declined in both groups, levels being lower in euglycaemia than in hyperglycaemia during the second hour of exercise (p<0.05 for AUC).
Spirometry and net carbohydrate and lipid oxidation rates Table 1 sums up the respiratory gas exchange at rest and during exercise. There were no baseline differences in V:O2and CO2production (V
:
CO2) between euglycaemia and hyperglycaemia. The increase of V:O2 during exercise was more pronounced in euglycaemia than in hyperglycaemia, resulting in a higher level of V:O2 at the end of exercise in the former condition (29.7±2.1 vs 28.4±2.0 ml min−1kg−1, p<0.05). Values for V:CO2 were similar in euglycaemia and hyperglycaemia throughout the entire exercise. This translat-ed into a higher respiratory exchange ratio during exercise in hyperglycaemia than in euglycaemia (0.89±0.01 vs 0.84± 0.01 at the end of exercise; p<0.05). The contribution of net carbohydrate oxidation to overall substrate oxidation was higher in hyperglycaemia than in euglycaemia (66.6±4.2 vs 48.2±4.7% at the end of exercise; p<0.05). Inverse findings resulted for the contribution of net lipid oxidation to overall
substrate oxidation, which was higher in euglycaemia than in hyperglycaemia (49.4±4.8 vs 30.6±4.2%; p<0.05). Local and systemic carbohydrate metabolism During the first 30 min of exercise, glucose infusion rates were low in euglycaemia and hyperglycaemia (0.3±0.2 and 1.8±1.0 mg min−1kg−1). Rates increased throughout exercise to 4.4±1.2 and 9.5±1.5 mg min−1 kg−1 during the last 30 min in euglycaemia and hyperglycaemia (p<0.01). Table 2 shows the parameters of glucose turnover assessed by stable isotope technique. Endogenous glucose production was at similarly low levels at rest in euglycaemia and hyperglycaemia (2.4± 0.2 and 1.9±0.6 mg min−1 kg−1). In euglycaemia endoge-nous glucose production significantly increased during exercise (to 4.0±0.6 mg min−1kg−1during the last 30 min; p<0.05 compared with rest), but remained stable in hyper-glycaemia (1.9±0.8; p<0.01 for difference to euhyper-glycaemia). Conversely, glucose disposal tended to be higher during exercise in hyperglycaemia than in euglycaemia (11.3±1.6 vs 8.4±0.8 mg min−1kg−1 for last 30 min). The oxidation rate of systemic glucose corresponded well to the glucose disposal and tended to be higher in hyperglycaemia than in euglycaemia towards the end of exercise (10.3±1.3 vs 8.4± 1.1 mg min−1kg−1).
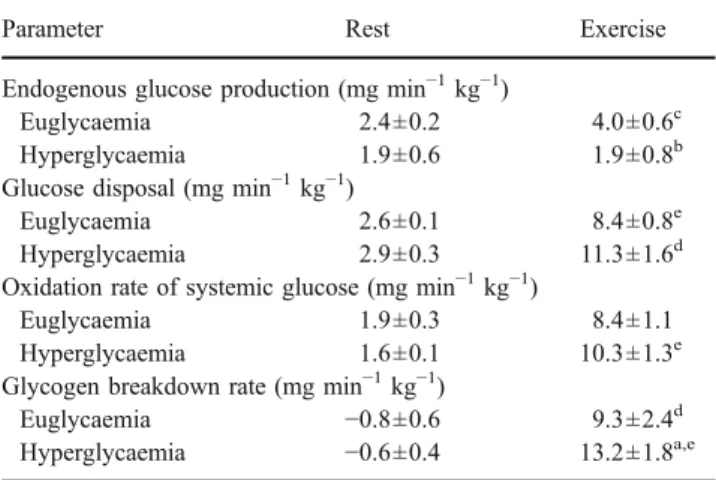
The calculated glycogen breakdown rates at the end of exercise were lower in euglycaemia than in hyperglycaemia (9.3 ±2.4 and 13.2±1.8 mg min−1 kg−1; p<0.05). The corresponding results from MRS are shown in Fig.3a, where absolute levels of glycogen before exercise are seen to be
Table 1 Respiratory gas exchange and net substrate oxidation rates Parameter Rest Exercise
60 min 120 min V:O2(ml min−1kg−1) Euglycaemia 4.4±0.8 28.6±2.4c 29.7±2.1c,d Hyperglycaemia 5.0±0.2 28.2±2.0c 28.4±2.0a,c V:CO2(ml min−1kg−1) Euglycaemia 3.4±0.6 24.5±2.0c 24.9±1.9c Hyperglycaemia 3.9±0.2 25.0±1.7c 25.4±1.8c Carbohydrate oxidation (mg min−1kg−1)
Euglycaemia 1.2±0.4 19.1±2.0c 17.5±2.5c Hyperglycaemia 1.0±0.4 22.6±2.1c 23.7±2.1a,c
Lipid oxidation (mg min−1kg−1)
Euglycaemia 1.6±0.4 6.6±0.8c 7.7±0.8c,d
Hyperglycaemia 1.7±0.2 5.1±0.9b 4.8±0.8a,b Data are mean±SEM (n=7)
Data are reported as mean over 5 min at rest and mean over each 15 min from t55to t70and from t105to t120
a
p<0.05 for hyperglycaemia compared with euglycaemia; bp<0.01 compared with the corresponding baseline value;cp<0.001 compared with the corresponding baseline value;dp<0.05 compared with the corresponding value at 60 min
Table 2 Glucose turnover
Parameter Rest Exercise Endogenous glucose production (mg min−1kg−1)
Euglycaemia 2.4±0.2 4.0±0.6c Hyperglycaemia 1.9±0.6 1.9±0.8b Glucose disposal (mg min−1kg−1)
Euglycaemia 2.6±0.1 8.4±0.8e Hyperglycaemia 2.9±0.3 11.3±1.6d Oxidation rate of systemic glucose (mg min−1kg−1)
Euglycaemia 1.9±0.3 8.4±1.1 Hyperglycaemia 1.6±0.1 10.3±1.3e Glycogen breakdown rate (mg min−1kg−1)
Euglycaemia −0.8±0.6 9.3±2.4d Hyperglycaemia −0.6±0.4 13.2±1.8a,e
Data are mean±SEM (n=7); data at rest are mean of two measurements and during exercise mean of four measurements during the last 30 min Rate of appearance and disappearance were derived fromD-[6-6-2H
2]
glucose enrichment and oxidation rate of systemic glucose from
13
CO2andD-[U-13C]glucose a
p<0.05 for hyperglycaemia compared with euglycaemia; bp<0.01 for hyperglycaemia compared with euglycaemia; cp<0.05 compared with the corresponding baseline values;dp<0.01 compared with the corresponding baseline values; ep < 0.001 compared with the corresponding baseline values
higher in hyperglycaemia than in euglycaemia (3.4±0.3 vs 2.7±0.2 AU; p<0.05). Absolute glycogen consumption tended to be higher in hyperglycaemia than in euglycaemia (1.3±0.3 vs 0.9±0.1 AU) while relative proportions were comparable for both glycaemic levels (35.2±6.5 and 31.2± 3.5%).
Local and systemic lipid metabolism As shown in Table1, the increase of the net lipid oxidation rate was more pronounced in euglycaemia than in hyperglycaemia (7.7± 0.8 vs 4.8±0.8 mg min−1 kg−1 at the end of exercise; p< 0.05). Levels of NEFA during exercise tended to be higher in euglycaemia than in hyperglycaemia (0.63±0.07 vs 0.56± 0.05 mmol/l). Baseline levels of IMCL assessed by MRS were comparable in both conditions (euglycaemia 6.4±0.7 vs 6.3±0.6 mmol/kg muscle wet weight; Fig. 3b). The relative and absolute amounts of IMCL consumed during exercise tended to be higher in euglycaemic than in hyper-glycaemic conditions (−1.1±0.2 and −0.7±0.4 mmol/kg muscle wet weight and−16.2±2.6 and −11.5±4.9%). Summary of energy consumption Figure 4 summarises the relative contribution of local and systemic fuel sources to overall energy metabolism. In euglycaemia, 49.4±4.8% of the total energy demands was met by lipid oxidation, while carbohydrate oxidation accounted for 48.2±4.7%. About half of carbohydrate oxidation (24.2±6.0%) was from oxidised intramyocellular glycogen, the other half was accounted for by systemic glucose (11.9±2.2% by endogenous hepatic glucose production, 12.2±3.4% by exogenous glucose infusion). In hyperglycaemia, the contribution of lipid oxidation to overall energy consumption was lower than in euglycaemia (30.6± 4.2%; p<0.05). Conversely, significantly more energy was provided by carbohydrate oxidation in hyperglycaemia than in euglycaemia (66.6±4.2%; p<0.05). In hyperglycaemia, oxi-dation from systemically available glucose was mainly fed by exogenous glucose infusion (25.6±5.1%), while endogenous hepatic glucose production was significantly lower than in euglycaemia (4.2±1.7%; p<0.01). Protein oxidation was similarly low in both conditions (euglycaemia 2.4±0.2 vs 2.8±0.3%).
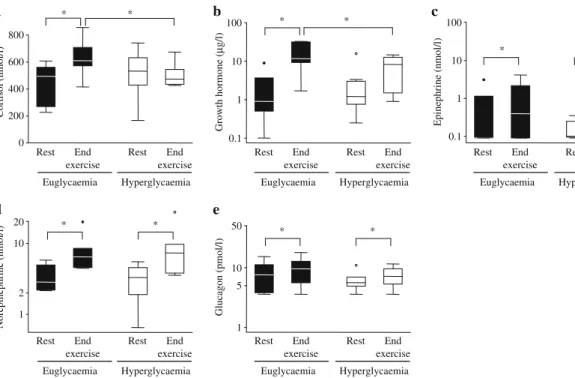
Hormonal regulation Figure5depicts the levels of counter-regulatory hormones before and at the end of exercise. While levels for cortisol (Fig. 5a) were not different at baseline in either condition (euglycaemia 449±55 vs 501± 73 nmol/l), there was a significant increase during euglycaemia but not in hyperglycaemia (levels at the end of exercise 634±52 vs 501±32 nmol/l; p<0.05). Similarly, levels of growth hormone (Fig.5b) were comparable before exercise in both conditions (euglycaemia 2.6±1.2 vs 3.3± 2.1μg/l). During exercise there was a stronger increase in growth hormone in euglycaemic than in hyperglycaemic exercise conditions, resulting in significantly higher levels at the end of exercise in the former (euglycaemia 15.5±4.5 vs 7.4±2.0 μg/l; p<0.05). Levels of norepinephrine and
0 20 40 60 80 100 Euglycaemia Hyperglycaemia * * ** ** Per cent
Fig. 4 Relative energy contribution of specific substrates at the end of exercise during euglycaemia and hyperglycaemia. Data are means (n= 7); *p<0.05 and **p<0.01 for comparison of corresponding energy substrates in euglycaemia and hyperglycaemia. White, glycogen; light grey, glucose infusion; medium grey, endogenous glucose; dark grey, lipids; black, protein
0 1 2 3 4 5 Glycogen/creatine
Before After Before After
Euglycaemic exercise 0 2 4 6 8 10 IMCL (mmol/kg ww ) Hyperglycaemic exercise *** * † ‡ † a b
Before After Before After
Euglycaemic exercise Hyperglycaemic exercise
Fig. 3 Results from MRS for glycogen:creatine ratio (a) and IMCL (b) concentrations in the right thigh (in absolute units of mmol per kg muscle wet weight [mmol/kgww]) before and after
exercise in euglycaemia and hyperglycaemia. Data are mean±SEM (n=7). *p=0.05; ***p<0.001;
epinephrine (Fig. 5c,d) were similar at baseline and increased moderately and to a similar extent in euglycaemia and hyperglycaemia. Similarly, levels of glucagon (Fig.5e) were not different between the two conditions either before or at the end of exercise.
Discussion
This is the first study to assess the impact of differing glucose levels at similar and comparably low insulinaemia on fuel metabolism during aerobic exercise in patients with type 1 diabetes mellitus. The principal findings were that: (1) during exercise the rate of carbohydrate oxidation was higher in hyperglycaemia than in euglycaemia; conversely, the rate of lipid oxidation was higher in the latter; (2) intramyocellular glycogen was not spared in hyperglycaemia and glycogen breakdown was even increased in this condition compared with euglycaemia; and (3) in the presence of identical insulin concentrations hyperglycaemia rapidly increased pre-exercise intramuscular glycogen.
This confirms our hypothesis of a shift from carbohy-drate oxidation towards a predominance of lipid oxidation in the course of aerobic exercise in euglycaemia but not in hyperglycaemia, if insulin infusion is adapted in patients with type 1 diabetes mellitus. The relative contributions of
carbohydrate and lipid oxidation to overall energy produc-tion found in the present study in euglycaemia were virtually identical to those reported in the study of Hawley and colleagues in healthy athletes exercising in euglycaemia and hyperglycaemia [12]. In the present study the relative contributions in euglycaemia were 49%, 24% and 24% for lipids, systemic glucose and local glycogen, while their values in euglycaemia were 53%, 26% and 21%. It can, consequently, be stated that patients with type 1 diabetes mellitus performing aerobic exercise in euglycaemia behave metabolically in a similar way to healthy individuals.
The underlying mechanisms for these findings are not entirely known. During moderate exercise (<60% of
V:O2peak) the ratio of glucagon to insulin is the main
regulator of fuel metabolism in healthy individuals [32]. In the present study both insulin and glucagon were not different in euglycaemia and hyperglycaemia and are, therefore, unlikely to have caused the shift in fuel oxidation. Similarly, the levels of catecholamines were virtually identical in both glycaemia conditions. In contrast, differences were observed for cortisol and growth hormone. Thus while baseline levels of cortisol were identical in euglycaemia and hyperglycaemia, they increased during exercise in euglycaemia, but not in hyperglycaemia. Comparably, the levels of growth hormone, also similar at baseline, increased to a greater extent during euglycaemia compared with hyperglycaemia. Both hormones are known
1 5 10 50 Glucagon (pmol/l) Euglycaemia Hyperglycaemia
Rest Rest End
exercise End exercise 1 2 10 20 Norepinephrine (nmol/l) 0.1 1 10 100 Epinephrine (nmol/l) 0.1 1 10 100 Growth hormone ( µ g/l) 0 200 400 600 800 Cortisol (nmol/l) * * * * * * * * * * a b c d e Euglycaemia Hyperglycaemia
Rest Rest End
exercise End
exercise
Euglycaemia Hyperglycaemia
Rest Rest End
exercise End
exercise
Euglycaemia Hyperglycaemia
Rest Rest End
exercise End
exercise
Euglycaemia Hyperglycaemia
Rest Rest End
exercise End
exercise
Fig. 5 Serum cortisol (a), growth hormone (b), epinephrine (c), norepinephrine (d) and plasma glucagon (e) concentrations at rest and at the end of exercise. Data are means±SEM, n=7 (a–c, e), n=6 (d); *p=0.05. Note that log scales on the y-axis were used in b–e since
data were not normally distributed. Data points outside of the range of the plot are shown by black circles (euglycaemia) and white circles (hyperglycaemia)
to induce peripheral lipolysis [33] and could have played a role in the shift towards higher lipid oxidation in euglycae-mia compared with hyperglycaeeuglycae-mia. This hypothesis is further substantiated by the tendency towards higher levels of NEFA in euglycaemia than in hyperglycaemia, reflecting an increased peripheral lipolysis.
Data on intramyocellular glycogen and lipids in general are scarce for patients with type 1 diabetes mellitus. In the present study, the pre-exercise concentration of IMCL and its consumption during exercise in euglycaemia were comparable to concentrations assessed by similar tech-niques in healthy athletes [31], the consumption of IMCL in hyperglycaemia being slightly lower. Interestingly, the results of the present study did not confirm our hypothesis regarding a saving of intramyocellular glycogen during hyperglycaemia compared with euglycaemia. The mecha-nisms by which hyperglycaemia increased glycogen con-sumption are not fully understood. Interestingly, the capacity of glycogen storage has been reported to be impaired in type 1 diabetes mellitus [34]. While the absolute amount of pre-exercise glycogen in hyperglycae-mia in the present study was similar to levels found in healthy athletes [31, 35], pre-exercise glycogen concen-trations were considerably lower in euglycaemia. Studies in healthy individuals have shown that net muscle glycogen utilisation is determined by muscle glycogen content before exercise [35]. It is a matter of debate whether this is a pure mass action effect initiated by the readily available fuel in the muscle cell, as was suggested by a genetically modified mouse model overaccumulating glycogen due to over-expression of glycogen synthase [36]. Other studies have suggested a cross-talk hypothesis through an upregulation of glycogen phosphorylase in the presence of higher glycogen stores [37]. Due to the pre-test standardisation procedures of the present study, including similar diet and physical activity before both tests, it is unlikely that the increased glycogen levels before exercise in hyperglycae-mia were due to a systematically higher intake of carbohydrates in the days before. Conversely, it is conceiv-able that the hyperglycaemic clamp procedure, started just under 1 h before the pre-test MRS, induced a rapid synthesis of intramyocellular glycogen. The similar esti-mated rates of glycogen synthesis using the stable isotope data before exercise do not necessarily argue against this hypothesis, since it is unknown whether glycogen synthesis is a linear process and it is possible that synthesis was mainly activated in the early stage of the hyperglycaemic clamp. In agreement with this hypothesis, it has been shown previously that a single high-carbohydrate meal taken 4 h before exercise may increase glycogen content in M. vastus by over 40% [9].
The present study provides a complementary approach to the recent study of Chokkalingam and colleagues [7].
While they assessed the influence of differing insulin concentrations in euglycaemia on whole-body and muscle metabolism, the present study investigated the impact of dissimilar glucose concentrations at stable and comparably low insulinaemia on fuel metabolism during exercise. They reported an increase in exogenous glucose utilisation in hyperinsulinaemia, without concomitant sparing of muscle glycogen utilisation, which is consistent with the present results. The longer exercise duration of the present study allowed us to observe changes in aerobic substrate metabolism over an extended follow-up. In addition, insulin concentrations in the present study were lower than both insulin levels in Chokkalingam’s trial in order to reflect insulin dose reductions before and during exercise as recommended by treatment guidelines [1].
The strengths of the present study are its standardised and randomised design, combining techniques to quantify glucose turnover by stable isotope tracer technique with non-invasive methods to quantify IMCL and glycogen. Glycogen measurements derived from indirect calculations were consistent with the results from MRS. We neverthe-less acknowledge several limitations: First, the complex study design limited the number of participants. Second, our insight into lipid metabolism did not encompass turnover quantification using tracer technique. We agreed to this compromise in order to keep the technical interventions manageable and thereby ensure the quality of the performed measurements. Third, due to technical reasons (duration of exercise, magnetic field) no heating box could be used for the clamp. Importantly, previous studies have confirmed sufficient arterialisation of ante-cubital venous blood during exercise of similar duration and intensity [12]. Fourth, the maintenance of hyper-glycaemia by continuous glucose infusion was an artificial intervention, limiting the direct applicability of our findings to daily clinical practice. Conversely, a deeper insight into the metabolic processes during exercise in type 1 diabetes mellitus patients under controlled conditions may still be a step towards the refinement of treatment guidelines for these patients.
In conclusion, the results of the present study suggest that substrate oxidation in type 1 diabetic patients performing aerobic exercise in euglycaemia is comparable to that observed in healthy individuals, revealing a shift towards lipid oxidation in the course of exercise. In contrast, exercising in hyperglycaemia retains fuel metab-olism in an artificially restrained state of carbohydrate predominance. No evidence was found for a saving of intramyocellular glycogen in hyperglycaemia. Further stud-ies investigating fuel metabolism during exercise in patients with type 1 diabetes mellitus should now focus on the intracellular mechanisms involved in the regulation of substrate oxidation in different glycaemic states.
Acknowledgements This study was supported by unrestricted grants from the Oetliker-Stiftung für Physiologie (Oetliker Foundation for Physiology), from the Swiss Diabetes Foundation, from NovoNordisk, Switzerland and from the Swiss National Science Foundation (grant number 320000-109522/1 to E. Christ). C. Stettler is a PROSPER fellow supported by the Swiss National Science Foundation (grant number 3233B0-115212). The MRUI software package was kindly provided by the participants of the EU Network programmes Human Capital and Mobility (CHRX-CT94-0432) and Training and Mobility of Researchers (ERB-FMRX-CT970160).
Duality of interest The authors declare that there is no duality of interest associated with this manuscript.
References
1. Zinman B, Ruderman N, Campaigne BN, Devlin JT, Schneider SH (2004) Physical activity/exercise and diabetes. Diabetes Care 27(Suppl 1):S58–S62
2. Horton ES (1988) Role and management of exercise in diabetes mellitus. Diabetes Care 11:201–211
3. Berger M, Berchtold P, Cuppers HJ et al (1977) Metabolic and hormonal effects of muscular exercise in juvenile type diabetics. Diabetologia 13:355–365
4. Koivisto VA, Felig P (1978) Effects of leg exercise on insulin absorption in diabetic patients. N Engl J Med 298:79–83 5. Wallberg-Henriksson H, Gunnarsson R, Rossner S, Wahren J (1986)
Long-term physical training in female type 1 (insulin-dependent) diabetic patients: absence of significant effect on glycaemic control and lipoprotein levels. Diabetologia 29:53–57
6. Grimm JJ, Ybarra J, Berne C, Muchnick S, Golay A (2004) A new table for prevention of hypoglycaemia during physical activity in type 1 diabetic patients. Diabetes Metab 30:465–470 7. Chokkalingam K, Tsintzas K, Norton L, Jewell K, Macdonald IA,
Mansell PI (2007) Exercise under hyperinsulinaemic conditions increases whole-body glucose disposal without affecting muscle glycogen utilisation in type 1 diabetes. Diabetologia 50:414–421 8. Stettler C, Jenni S, Allemann S et al (2006) Exercise capacity in
subjects with type 1 diabetes mellitus in eu- and hyperglycaemia. Diabetes Metab Res Rev 22:300–306
9. Coyle EF, Coggan AR, Hemmert MK, Lowe RC, Walters TJ (1985) Substrate usage during prolonged exercise following a preexercise meal. J Appl Physiol 59:429–433
10. Coyle EF, Hamilton MT, Alonso JG, Montain SJ, Ivy JL (1991) Carbohydrate metabolism during intense exercise when hyperglyce-mic. J Appl Physiol 70:834–840
11. Jeukendrup AE, Raben A, Gijsen A et al (1999) Glucose kinetics during prolonged exercise in highly trained human subjects: effect of glucose ingestion. J Physiol 515:579–589
12. Hawley JA, Bosch AN, Weltan SM, Dennis SC, Noakes TD (1994) Glucose kinetics during prolonged exercise in euglycaemic and hyperglycaemic subjects. Pflugers Arch 426:378–386 13. Carter JM, Jeukendrup AE, Mann CH, Jones DA (2004) The
effect of glucose infusion on glucose kinetics during a 1-h time trial. Med Sci Sports Exerc 36:1543–1550
14. Manzon A, Fisher SJ, Morais JA et al (1998) Glucose infusion partially attenuates glucose production and increases uptake during intense exercise. J Appl Physiol 85:511–524
15. Yaspelkis BB 3rd, Patterson JG, Anderla PA, Ding Z, Ivy JL (1993) Carbohydrate supplementation spares muscle glycogen during variable-intensity exercise. J Appl Physiol 75:1477– 1485
16. Coyle EF, Coggan AR, Hemmert MK, Ivy JL (1986) Muscle glycogen utilization during prolonged strenuous exercise when fed carbohydrate. J Appl Physiol 61:165–172
17. Harger-Domitrovich SG, McClaughry AE, Gaskill SE, Ruby BC (2007) Exogenous carbohydrate spares muscle glycogen in men and women during 10 h of exercise. Med Sci Sports Exerc 39:2171–2179 18. Stellingwerff T, Boon H, Gijsen AP, Stegen JH, Kuipers H, van Loon LJ (2007) Carbohydrate supplementation during prolonged cycling exercise spares muscle glycogen but does not affect intramyocellular lipid use. Pflugers Arch 454:635–647
19. Tounian P, Schneiter P, Henry S, Tappy L (1996) Effects of infused glucose on glycogen metabolism in healthy humans. Clin Physiol 16:403–416
20. Hargreaves M, Briggs CA (1988) Effect of carbohydrate ingestion on exercise metabolism. J Appl Physiol 65:1553–1555
21. Borg G (1970) Perceived exertion as an indicator of somatic stress. Scand J Rehabil Med 2:92–98
22. Maroni BJ, Steinman TI, Mitch WE (1985) A method for estimating nitrogen intake of patients with chronic renal failure. Kidney Int 27:58–65
23. Frayn KN (1983) Calculation of substrate oxidation rates in vivo from gaseous exchange. J Appl Physiol 55:628–634
24. Ferrannini E (1988) The theoretical bases of indirect calorimetry: a review. Metabolism 37:287–301
25. DeFronzo RA, Tobin JD, Andres R (1979) Glucose clamp technique: a method for quantifying insulin secretion and resistance. Am J Physiol 237:E214–E223
26. Wolfe RR, Chinkes DL (2005) Isotope tracers in metabolic research: principles and practice of kinetic analysis, 2nd edn. Wiley-Liss, Hoboken
27. Robert JJ, Koziet J, Chauvet D, Darmaun D, Desjeux JF, Young VR (1987) Use of 13C-labeled glucose for estimating glucose oxidation: some design considerations. J Appl Physiol 63:1725–1732 28. Shulman GI, Rothman DL, Chung Y et al (1988) 13C NMR studies of
glycogen turnover in the perfused rat liver. J Biol Chem 263:5027– 5029
29. Boesch C, Slotboom J, Hoppeler H, Kreis R (1997) In vivo determination of intra-myocellular lipids in human muscle by means of localized 1H-MR-spectroscopy. Magn Reson Med 37:484–493 30. Boesch C, Decombaz J, Slotboom J, Kreis R (1999) Observation
of intramyocellular lipids by means of 1H magnetic resonance spectroscopy. Proc Nutr Soc 58:841–850
31. Zehnder M, Christ ER, Ith M et al (2006) Intramyocellular lipid stores increase markedly in athletes after 1.5 days lipid supple-mentation and are utilized during exercise in proportion to their content. Eur J Appl Physiol 98:341–354
32. Marliss EB, Vranic M (2002) Intense exercise has unique effects on both insulin release and its roles in glucoregulation: implica-tions for diabetes. Diabetes 51(Suppl 1):S271–S283
33. Moller N, Jorgensen JO, Alberti KG, Flyvbjerg A, Schmitz O (1990) Short-term effects of growth hormone on fuel oxidation and regional substrate metabolism in normal man. J Clin Endocrinol Metab 70:1179–1186
34. Bak JF, Jacobsen UK, Jorgensen FS, Pedersen O (1989) Insulin receptor function and glycogen synthase activity in skeletal muscle biopsies from patients with insulin-dependent diabetes mellitus: effects of physical training. J Clin Endocrinol Metab 69:158–164 35. Weltan SM, Bosch AN, Dennis SC, Noakes TD (1998) Preexercise
muscle glycogen content affects metabolism during exercise despite maintenance of hyperglycemia. Am J Physiol 274:E83–E88 36. Pederson BA, Cope CR, Irimia JM et al (2005) Mice with
elevated muscle glycogen stores do not have improved exercise performance. Biochem Biophys Res Commun 331:491–496 37. Laurent D, Hundal RS, Dresner A et al (2000) Mechanism of
muscle glycogen autoregulation in humans. Am J Physiol Endocrinol Metab 278:E663–E668
![Fig. 3 Results from MRS for glycogen:creatine ratio (a) and IMCL (b) concentrations in the right thigh (in absolute units of mmol per kg muscle wet weight [mmol/kg ww ]) before and after exercise in euglycaemia and hyperglycaemia](https://thumb-eu.123doks.com/thumbv2/123doknet/14840307.624683/6.892.509.755.592.979/results-glycogen-creatine-concentrations-absolute-exercise-euglycaemia-hyperglycaemia.webp)