Trisomy for Synaptojanin1 in Down syndrome
is functionally linked to the enlargement
of early endosomes
Jack-Christophe Cossec
1,{, Je´re´mie Lavaur
1,{, Diego E. Berman
2, Isabelle Rivals
3,
Alexander Hoischen
4, Samantha Stora
5, Cle´mentine Ripoll
6, Clotilde Mircher
5, Yann Grattau
5,
Jean-Christophe OlivoMarin
7, Fabrice de Chaumont
7, Magalie Lecourtois
8,
Stylianos E. Antonarakis
9, Joris A. Veltman
4, Jean M. Delabar
6, Charles Duyckaerts
1,
Gilbert Di Paolo
2, and Marie-Claude Potier
1,∗1
Centre de Recherche de l’Institut du Cerveau et de la Moelle, CNRS UMR7225, UPMC, INSERM UMRS975, Hoˆpital Pitie´-Salpeˆtrie`re, Paris, France,2Taub Institute for Research on Alzheimer’s Disease and The Aging Brain and Department of Pathology and Cell Biology, Columbia University Medical Center, New York, NY, USA,3Equipe de Statistique Applique´e, ESPCI ParisTech, Paris, France,4Department of Human Genetics, Radboud University Nijmegen Medical Center, Nijmegen, The Netherlands,5Institut Je´roˆme Lejeune, Paris, France,6Univ Paris Diderot, Sorbonne Paris Cite´, Unite´ de Biologie Fonctionnelle et Adaptative (BFA) EAC4413 CNRS, Paris, France,7Institut Pasteur, Quantitative Image Analysis Unit, CNRS URA2582, Paris, France,8INSERM U 614, Rouen, France,
9
University of Geneva, Geneva, Switzerland
Received February 24, 2012; Revised and Accepted April 4, 2012
Enlarged early endosomes have been observed in neurons and fibroblasts in Down syndrome (DS). These endosome abnormalities have been implicated in the early development of Alzheimer’s disease (AD) path-ology in these subjects. Here, we show the presence of enlarged endosomes in blood mononuclear cells and lymphoblastoid cell lines (LCLs) from individuals with DS using immunofluorescence and confocal mi-croscopy. Genotype – phenotype correlations in LCLs carrying partial trisomies 21 revealed that triplication of a 2.56 Mb locus in 21q22.11 is associated with the endosomal abnormalities. This locus contains the gene encoding the phosphoinositide phosphatase synaptojanin 1 (SYNJ1), a key regulator of the signalling phospholipid phosphatidylinositol-4,5-biphosphate that has been shown to regulate clathrin-mediated endo-cytosis. We found that SYNJ1 transcripts are increased in LCLs from individuals with DS and that overexpres-sion of SYNJ1 in a neuroblastoma cell line as well as in transgenic mice leads to enlarged endosomes. Moreover, the proportion of enlarged endosomes in fibroblasts from an individual with DS was reduced after silencing SYNJ1 expression with RNA interference. In LCLs carrying amyloid precursor protein (APP) microduplications causing autosomal dominant early-onset AD, enlarged endosomes were absent, suggest-ing that APP overexpression alone is not involved in the modification of early endosomes in this cell type. These findings provide new insights into the contribution of SYNJ1 overexpression to the endosomal changes observed in DS and suggest an attractive new target for rescuing endocytic dysfunction and lipid metabolism in DS and in AD.
†
These authors contributed equally to the work.
∗To whom correspondence should be addressed at: Centre de Recherche de l’Institut du Cerveau et de la Moelle, CNRS UMR7225, UPMC, INSERM
UMRS975, Hoˆpital Pitie´-Salpeˆtrie`re, 47, Bd de l’Hoˆpital 75013 Paris, France. Tel:+33 157274519; Email: [email protected]
#The Author 2012. Published by Oxford University Press. All rights reserved. For Permissions, please email: [email protected]
INTRODUCTION
Enlarged endosomes are believed to be the first morphological change observed in Alzheimer’s disease (AD) brains, preced-ing the deposition of amyloid-b peptide (Ab) (1). They are primarily found in sporadic cases with no pathological evi-dence of AD yet and in all individuals with Down syndrome (DS) as early as after 28 weeks of gestation, preceding AD neuropathology by decades (2). Early endosomes are a major sorting compartment of the endocytic pathway in which the amyloid precursor protein (APP) is internalized and processed, producing amyloid-b peptides (Ab) (3). The APP gene maps to 21q21, suggesting that the APP locus could be the major genetic determinant of AD neuropathology in DS (4–7). Following this hypothesis, it was shown that overexpression of APP is necessary, although not sufficient, for inducing endosomal anomalies in neurons from transgenic mouse models of DS (8). Additionally, over-expression of the C-terminal fragment of APP in human fibroblasts induced the AD-like endosomal phenotype (9). Rab4, Rab5 and Rab7 GTPases and early endosomal antigen 1 (EEA1) have also been shown to be overexpressed in AD and DS (2,10–12). Since overexpression of Rab5 or Rab5 mutants blocking guanosine triphosphate (GTP) hydrolysis increases the fusion of endocytic vesicles, inducing the formation of giant early endosomes, increase in Rab5 in AD and DS could also be re-sponsible for the increase in size of early endosomes (13,14). However, several lines of evidence suggest that human chromosome 21 (Hsa21) genes other than APP could contribute to the endosomal dysfunction. In familial AD, where Ab over-production is associated with mutations in the APP or in the presenilin genes, the endosomal compartment appears to be unchanged (15). In addition, App transgenic mice carrying the Swedish mutations do not show any endosomal dysfunction (8). Finally, enlarged endosomes have been found in the brain of Ts65Dn mice, a DS mouse model that has three genomic copies of about half of the genes orthologous to human chromo-some 21, including APP. When the number of copies of App was reduced to normal condition by crossing Ts65Dn mice with App knock-out mice, endosomal dysfunction was sup-pressed, suggesting that APP overexpression was necessary but not sufficient to produce enlarged endosomes (8).
We thus searched, for other genes from Hsa21 that may con-tribute to the observed endosomal dysfunctions in DS, using genotype – phenotype correlations. This approach had been extensively applied to identify the Down Syndrome Critical Region (DSCR) responsible for most of the clinical features of DS using cells generated from partial trisomy 21 (partial T21) cases, but had not been applied yet to a cellular phenotype (16,17). We found that blood mononuclear cells as well as lym-phoblastoid cell lines (LCLs) derived from blood samples of individuals with DS carried endosomal abnormalities. We then used a collection of LCLs originating from partial T21 cases and showed that triplication of a 2.56 Mb locus from Hsa21 containing the synaptojanin1 (SYNJ1) gene is associated with the presence of endosomal abnormalities. SYNJ1 is a phos-phatase that catalyses the dephosphorylation of the signalling phospholipid phosphatidylinositol-4,5-biphosphate PI(4,5)P2
that has been shown to control clathrin-mediated endocytosis (18,19). SYNJ1 levels are increased in DS brain (20) and its
overexpression in DS mouse models has been found to perturb PI(4,5)P2metabolism and contribute to cognitive
defi-cits (21). In this study, we further show that SYNJ1 overexpres-sion alone is functionally linked to the enlargement of early endosomes using three different models: overexpression of SYNJ1 in neuroblastoma cells and in neurons from transgenic mice, and SYNJ1 inhibition in fibroblasts from an individual with DS.
RESULTS
Endosomal abnormalities are present in blood
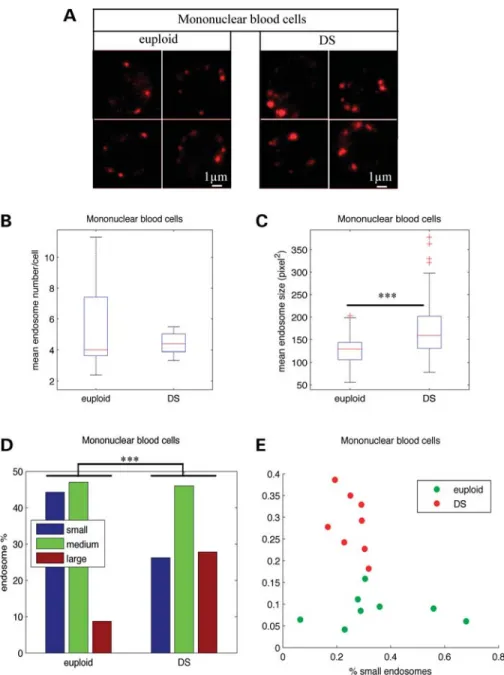
mononuclear cells and LCLs from individuals with DS To compare the number and the size of endosomes of blood mononuclear cells from individuals with DS (n ¼ 8) and age-matched controls (euploid individuals) (n ¼ 8), early endo-somes were labelled by immunofluorescence with an antibody against the early endosome antigen protein EEA1 (Fig. 1A). Using confocal microscopy and image analysis, we showed that the mean number of endosomes per cell in individuals with DS was not significantly different from that of euploids (Fig.1B and Table 1; euploids 5.6, DS 4.4, P ¼ 0.33). Inter-estingly, the mean size of endosomes was significantly increased in cells from individuals with DS when compared with age-matched euploids (Fig. 1C and Table 1; euploids 119.8, DS 157.43, P ¼ 1.4 10210). We then categorized the endosomes from DS and euploid individuals in three classes according to their size (small, medium and large), based on K-means clustering. Figure 1D shows that the percentage of large endosomes was higher (27.8%) in mononuclear blood cells from individuals with DS when compared with euploids (8.7%). Conversely, the percentage of small endosomes was lower in DS mononuclear blood cells (26.2%) when compared with euploids (44.3%) (Fig.1D and Table1; x2-test of homo-geneity P ¼ 0). Figure1E shows that cells from euploids and individuals with DS could be clearly distinguished based on their content in large and small endosomes.
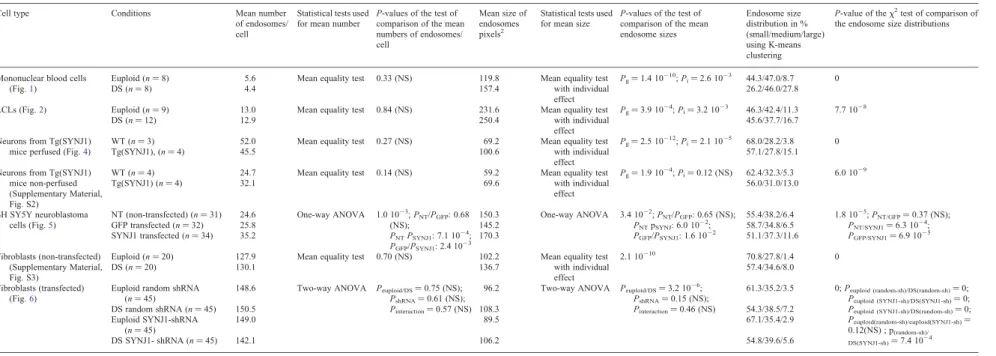
We then performed similar morphometric analyses of early endosomes from LCLs generated by transformation of lymphocytes from individuals with DS (n ¼ 12) and euploids (n ¼ 9) with the Epstein – Bar virus (Fig. 2A). As in mono-nuclear blood cells, the mean number of endosomes per cell in LCLs from DS and euploids was not statistically different (Fig.2B and Table1; euploids 13.0, DS 12.9, P ¼ 0.84). Inter-estingly, the mean endosome size was significantly increased in LCLs from individuals with DS when compared with euploids (Fig. 2C and Table 1; euploids 231.6, DS 250.4, P ¼ 3.9 1024). The analysis of the size distribution of endo-somes from individuals with DS and euploids using x2 homo-geneity tests revealed that the percentage of larger endosomes was higher in DS LCLs (16.7%) when compared with euploids (11.3%) (Fig. 2D and Table 1; P ¼ 7.7 1028). In addition, LCLs from euploids and individuals with DS could be differ-entiated according to the percentage of large and small endo-somes (Fig. 2E). We also found a significant increase in the mean size of endosomes of DS LCLs (n ¼ 3) when compared with euploids (n ¼ 3) using immunolabelling with an anti-Rab5 antibody (data not shown).
The amounts of Rab5 and EEA1 proteins in LCLs from DS (n ¼ 10) and euploid (n ¼ 10) individuals were quantified by western blot and no significant difference was found between DS and control cells, although there was a trend for an increase in DS samples (Supplementary Material, Fig. S1; P ¼ 0.1 and P ¼ 0.43 for Rab5 and EEA1, respectively; t-test).
In conclusion, we have described a new cellular phenotype based on the morphology of early endosomes in mononuclear blood cells as well as in LCLs from individuals with DS. The presence of this phenotype in LCLs allowed us to characterize partial trisomies 21 for identifying region(s) from Hsa21 involved in the cellular phenotype.
Endosomal abnormalities in LCLs from individuals carrying partial trisomies 21
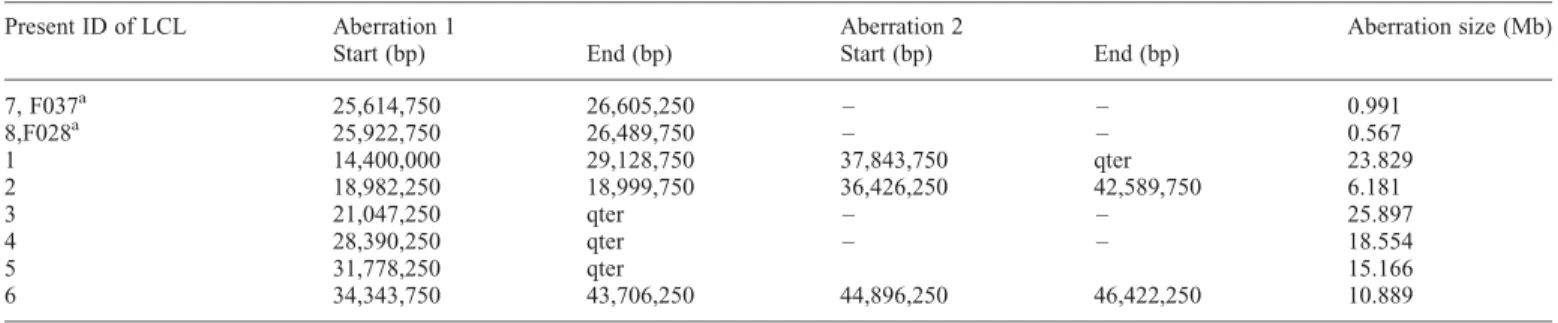
We analysed the endosomes of LCLs from eight patients carrying partial trisomies 21 (partial T21). The extent of the partial trisomies was characterized in detail by high-resolution comparative genomic hybridization (CGH) using Hsa21-spe-cific NimbleGen microarrays (Table 2).
We compared the endosome size distribution from each partial T21, to the distributions obtained with DS and control LCLs using x2-tests (Fig. 3A and B, Table 3). This analysis revealed that three out of eight partial T21 showed
Figure 1. Endosomal abnormalities are present in mononuclear blood cells from individuals with DS. (A) Immunofluorescence confocal images showing EEA1-labelled early endosomes in representative mononuclear blood cells from euploid (left) and individuals with DS (right). (B) Mean number of EEA1-positive early endosomes in DS (n ¼ 8) mononuclear blood cells when compared with euploids (n ¼ 8). (C) Mean endosome size in DS mononuclear blood cells when com-pared with euploids. (D) Endosome size distribution of small-, medium- and large-sized endosomes, based on K-means clustering. (E) Representation of mono-nuclear blood cells from euploid (green circles) and individuals with DS (red circles) in the plane defined by the percentage of their large and small endosomes.
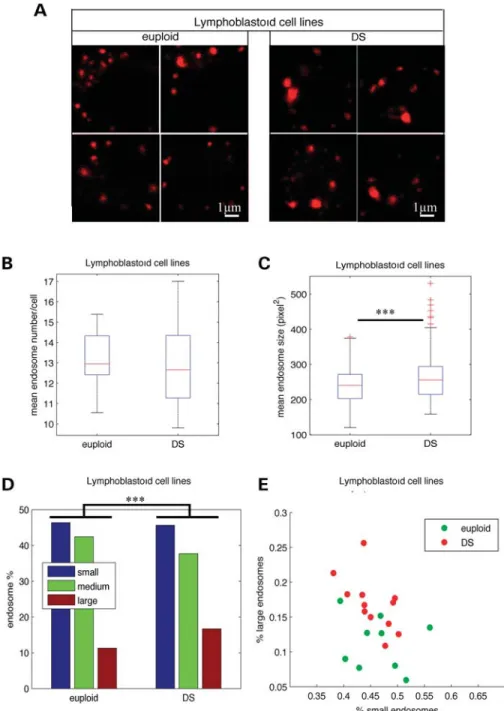
Table 1. Statistical analysis of the endosome characteristics
Cell type Conditions Mean number of endosomes/ cell
Statistical tests used for mean number
P-values of the test of comparison of the mean numbers of endosomes/ cell
Mean size of endosomes pixels2
Statistical tests used for mean size
P-values of the test of comparison of the mean endosome sizes Endosome size distribution in % (small/medium/large) using K-means clustering P-value of the x2 test of comparison of the endosome size distributions
Mononuclear blood cells (Fig.1)
Euploid (n ¼ 8) 5.6 Mean equality test 0.33 (NS) 119.8 Mean equality test with individual effect
Pg¼ 1.4 10210; Pi¼ 2.6 1023 44.3/47.0/8.7 0
DS (n ¼ 8) 4.4 157.4 26.2/46.0/27.8
LCLs (Fig.2) Euploid (n ¼ 9) 13.0 Mean equality test 0.84 (NS) 231.6 Mean equality test with individual effect Pg¼ 3.9 10 24 ; Pi¼ 3.2 10 23 46.3/42.4/11.3 7.7 1028 DS (n ¼ 12) 12.9 250.4 45.6/37.7/16.7
Neurons from Tg(SYNJ1) mice perfused (Fig.4)
WT (n ¼ 3) 52.0 Mean equality test 0.27 (NS) 69.2 Mean equality test with individual effect
Pg¼ 2.5 10212; Pi¼ 2.1 1025 68.0/28.2/3.8 0
Tg(SYNJ1), (n ¼ 4) 45.5 100.6 57.1/27.8/15.1
Neurons from Tg(SYNJ1) mice non-perfused (Supplementary Material, Fig. S2)
WT (n ¼ 4) 24.7 Mean equality test 0.14 (NS) 59.2 Mean equality test with individual effect Pg¼ 1.9 10 24 ; Pi¼ 0.12 (NS) 62.4/32.3/5.3 6.0 10 29 Tg(SYNJ1) (n ¼ 4) 32.1 69.6 56.0/31.0/13.0 SH SY5Y neuroblastoma cells (Fig.5)
NT (non-transfected) (n ¼ 31) 24.6 One-way ANOVA 1.0 1023
; PNT/PGFP: 0.68 (NS); PNTPSYNJ1: 7.1 10 24 ; PGFP/PSYNJ1: 2.4 1023 150.3 One-way ANOVA 3.4 1022 ; PNT/PGFP: 0.65 (NS); PNTpSYNJ: 6.0 1022; PGFP/PSYNJ1: 1.6 10 22 55.4/38.2/6.4 1.8 1025 ; PNT/GFP¼ 0.37 (NS); PNT/SYNJ1¼ 6.3 1024; PGFP/SYNJ1¼ 6.9 10 25 GFP transfected (n ¼ 32) 25.8 145.2 58.7/34.8/6.5 SYNJ1 transfected (n ¼ 34) 35.2 170.3 51.1/37.3/11.6 Fibroblasts (non-transfected) (Supplementary Material, Fig. S3)
Euploid (n ¼ 20) 127.9 Mean equality test 0.70 (NS) 102.2 Mean equality test with individual effect 2.1 10210 70.8/27.8/1.4 0 DS (n ¼ 20) 130.1 136.7 57.4/34.6/8.0 Fibroblasts (transfected) (Fig.6)
Euploid random shRNA (n ¼ 45)
148.6 Two-way ANOVA Peuploid/DS¼ 0.75 (NS); PshRNA¼ 0.61 (NS); Pinteraction¼ 0.57 (NS)
96.2 Two-way ANOVA Peuploid/DS¼ 3.2 1026; PshRNA¼ 0.15 (NS); Pinteraction¼ 0.46 (NS) 61.3/35.2/3.5 0; Peuploid (random-sh)/DS(random-sh)¼ 0; Peuploid (SYNJ1-sh)/DS(SYNJ1-sh)¼ 0; Peuploid (SYNJ1-sh)/DS(random-sh)¼ 0; Peuploid(random-sh)/euploid(SYNJ1-sh)¼ 0.12(NS) ; p(random-sh)/ DS(SYNJ1-sh)¼ 7.4 10 24 DS random shRNA (n ¼ 45) 150.5 108.3 54.3/38.5/7.2 Euploid SYNJ1-shRNA (n ¼ 45) 149.0 89.5 67.1/35.4/2.9 DS SYNJ1- shRNA (n ¼ 45) 142.1 106.2 54.8/39.6/5.6
In the ‘Conditions’ column, the numbers in parentheses are the numbers of individuals. For the tests of comparison of the mean endosome sizes, the P-values Pgand Pirefer to the significance of the genotype and individual effects, respectively. For the SH SY5Y neuroblastoma experiment, we indicate four P-values: the ones at the top correspond to the comparison of the three conditions [not transfected (NT), GFP or SYNJ1 transfected], and the P-values below correspond to two-by-two comparisons. For comparing the mean endosome number and size of transfected fibroblasts, we applied a two-way ANOVA: Peuploid/DScorresponds to the test of the effect of genotype, PshRNAto that of treatment, and Pinteractionto that of their interaction. The first P-value given for the x2tests corresponds to the test of homogeneity of all four conditions, the P-values below are those of the two-by-two comparisons. ANOVA, analysis of variance.
Human Molecula r Gen etics, 2012, Vol. 21, No. 14 3159
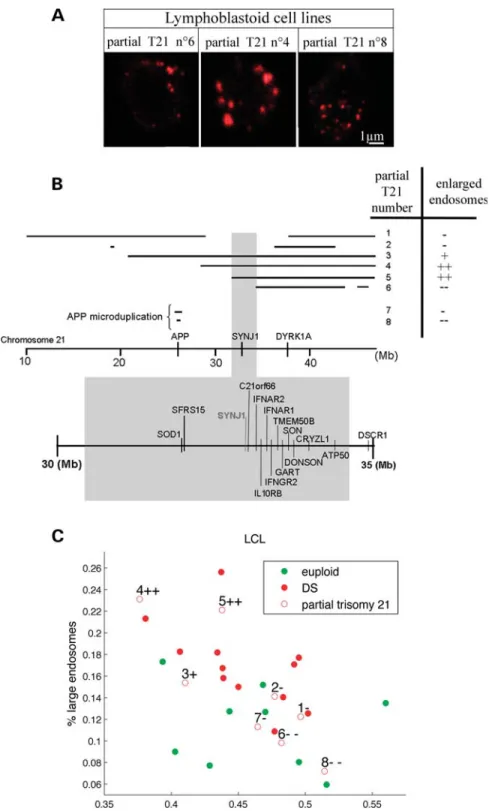
endosome size distributions similar to individuals with DS, indicating that LCLs from these partial T21 (numbers 3, 4 and 5) contained endosomal abnormalities (Fig. 3B and C and Table 3). Interestingly, endosomal dysmorphologies were absent in LCLs 7 and 8 carrying APP microduplications causing autosomal dominant early-onset AD (22) (Fig. 3A showing partial T21 number 8). We concluded that APP gene dosage imbalance was not involved in the phenotype in this cell type where APP was barely detectable in the control situation (23,24).
By correlating the presence of enlarged endosomes detected by immunofluorescence to the chromosomal segment triplicated, we isolated a 2.56 Mb region from Hsa21 located in 21q22.1 from position 31,778,250 to position 34,343,750 (Fig. 3B, Table2). This segment contains 33 genes or predictions among which 14 are expressed in LCLs according to expression micro-array data or quantitative polymerase chain reaction (PCR): SOD1, SFRS15, SYNJ1, C21ORF66, IFAR2, IL10RB, IFNAR1, IFNGR2, TMEM50B, GART, SON, CRYZL1, DONSON and ATP50 (Table4) (23,24) (M.C.P. and J.M.D., unpublished data).
Figure 2. Enlarged endosomes are present in LCLs from individuals with DS. (A) Representative confocal images of EEA1-positive early endosomes of LCLs from euploids and individuals with DS. (B) Mean number of EEA1-positive early endosomes in DS (n ¼ 12) when compared with euploids (n ¼ 9) LCLs. (C) Mean endosome size in LCLs from DS when compared with euploids. (D) Endosome size distribution of small-, medium- and large-sized endosomes, based on K-means clustering. (E) Representation of LCLs from euploid (green circles) and individuals with DS (red circles) in the plane defined by the percentage of their large and small endosomes.∗∗∗P , 0.001.
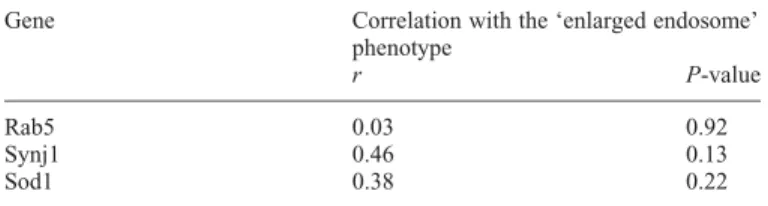
From this list, SYNJ1 appeared as a strong candidate for the observed phenotype. Indeed, previous studies reported that SYNJ1 is involved in vesicle recycling and clathrin-mediated endocytosis (25,26). In addition, SYNJ1 protein levels are increased in post-mortem DS brains (20,27). Interestingly, using real-time quantitative PCR, we found that SYNJ1 tran-scripts show a 2.24-fold significant increase in LCLs from individuals with DS when compared with euploids (n ¼ 3, P ¼ 0.032, t-test). In addition, correlation between the pres-ence of endosomal dysmorphologies in individuals with partial T21 and SYNJ1 expression levels was non-significant (r ¼ 0.46), because of lack of partial T21 LCLs available (Table 5). However, for RAB5 and SOD1, these correlations were lower (r ¼ 0.03 and r ¼ 0.38 respectively, Table 5). Based on these findings, we investigated the contribution of SYNJ1 in the observed phenotype.
SYNJ1 overexpression in SH-SY5Y cells induces DS-like endosome enlargement
SH-SY5Y neuroblastoma cells were transfected with the human SYNJ1 cDNA long isoform (170Kd) flag-tagged or a GFP cDNA as a control (Fig. 4A). Endosomes were labelled as described above with an anti-EEA1 antibody. Image ana-lysis revealed that the mean number of endosomes per cell was increased in cells overexpressing SYNJ1 (Fig. 4B and Table 1; non-transfected 24.6, GFP 25.8, SYNJ1 35.2, P ¼ 1.0 1023). Interestingly, the mean endosome size in cells over-expressing SYNJ1 was increased by 18% when compared with controls (Fig. 4C; non-transfected 150.3, GFP 145.2, SYNJ1 170.3, P ¼ 3.4 1022). Analysis of the endosome size distribu-tions showed that the percentage of larger endosomes was sig-nificantly higher in SYNJ1-transfected cells (11.6%) when compared with control cells (6.5%) (Fig. 4D and E and Table 1; P ¼ 1.8 1025). We thus concluded that SYNJ1 overexpression induces morphological changes of the early EEA1-positive early endosomes.
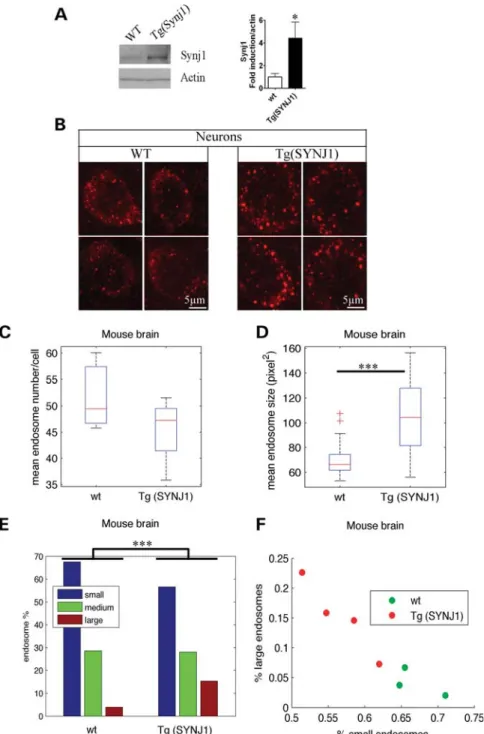
Neurons from the prefrontal cortex of transgenic mice overexpressing SYNJ1 show endosomal abnormalities We then analysed the morphology of EEA1-positive endo-somes in the brain of transgenic mice carrying one additional copy of the mouse Synj1 gene (21). Figure 5A shows a
significant increase in Synj1 in the brain of Tg(SYNJ1) mice (n ¼ 4, P ¼ 0.02 t-test), as described previously (21). Endo-somes were analysed in the prefrontal cortex where labelling was the strongest, in neurons double-labelled with anti-MAP2 and anti-EEA1 antibodies (Fig. 5B). The mean number of endosomes per neuron in Tg(SYNJ1) was not found to be sig-nificantly different from that of controls, both for perfused and non-perfused brains [Fig. 5C, Supplementary Material, Fig. S2B and Table S1; perfused WT 52.0, Tg(SYNJ1) 45.5, P ¼ 0.27; non-perfused WT 24.7, Tg(SYNJ1) 32.01, P ¼ 0.14]. However, morphometric analysis revealed a significant 1.45-fold increase in the mean endosome size in transgenic mice overexpressing Synj1 when compared with WT mice, with both fixation methods (Fig. 5D, Supplementary Material, Fig. S2C and Table S1; perfused WT 69.2, Tg(SYNJ1) 100.6, P ¼ 2.5 10212; non-perfused WT 59.2, Tg(SYNJ1) 69.6, P ¼ 1.9 1024). As for the other cell types analysed, the significant increase in mean endosome size was due to a higher percentage of large EEA1-positive endosomes in Tg(SYNJ1) mice when compared with WT (Fig. 5E and F, Supplementary Material, Fig. S2D and E and Table 1; perfused large WT 3.8% and TgSynj1 15.1%, P ¼ 0, non-perfused WT 5.3% and TgSynj1 13.0%, P ¼ 6.0 1029). In conclusion, we showed that overex-pression of SYNJ1 in transgenic mice leads to the enlargement of early endosomes of neurons.
Endosomal abnormalities in DS fibroblasts are partially rescued by selectively reducing SYNJ1 expression
We performed morphometric analyses of EEA1-positive endo-somes in cultured fibroblasts from one euploid and one indi-vidual with DS, which had been previously shown to contain enlarged endosomes (9) (Supplementary Material, Fig. S3A). Mean number of endosomes per cell was not statistically dif-ferent in DS fibroblast when compared with euploids (Supple-mentary Material, Fig. S3B, euploids 127.9, DS 130.1, P ¼ 0.70), while the mean size of endosomes was significantly increased in DS fibroblasts when compared with euploids (Supplementary Material, Fig. S3C, euploids 102.2, DS 136.7, P ¼ 2.1 10210). The size distributions of endosomes from DS and euploid fibroblasts were significantly different, with the percentage of larger endosomes higher in DS fibro-blasts (8%) when compared with euploids (1.4%) (Supplemen-tary Material, Fig. S3D, P ¼ 0).
Table 2. Results of ultra-high-resolution array CGH for partial trisomies 21 and APP microduplications (7 and 8)
Present ID of LCL Aberration 1 Aberration 2 Aberration size (Mb)
Start (bp) End (bp) Start (bp) End (bp)
7, F037a 25,614,750 26,605,250 – – 0.991 8,F028a 25,922,750 26,489,750 – – 0.567 1 14,400,000 29,128,750 37,843,750 qter 23.829 2 18,982,250 18,999,750 36,426,250 42,589,750 6.181 3 21,047,250 qter – – 25.897 4 28,390,250 qter – – 18.554 5 31,778,250 qter 15.166 6 34,343,750 43,706,250 44,896,250 46,422,250 10.889
Positions are deduced from hg18 on UCSC browser 2006 built. aFrom Reference (22).
We and others showed that SYNJ1 transcripts are overex-pressed in fibroblasts from individuals with DS [1.5-fold increase n ¼ 3 P ¼ 0.03 t-test; and (24)]. We thus tested
whether reducing SYNJ1 expression in these cells would decrease the proportion of enlarged endosomes. SYNJ1 expression inhibition was initially validated in HEK293 cells
Figure 3. Mapping of the chromosomal region from Hsa21 responsible for the abnormal endosome phenotype in DS. (A) Representative confocal images of EEA1-positive early endosomes in LCLs from individuals with partial trisomies 21 (partial T21) with normal-sized endosomes (Nos 6 and 8) and with abnormal endosomes (No. 4). (B) LCLs from eight partial trisomies 21 (Nos 7 and 8 correspond to APP microduplications) were characterized by CGH (Table2) and analysed for their endosome size.+/2 indicate the presence/absence of enlarged endosomes according to statistical analysis of the size distribution of their endosome (Table3). Bottom shows the 2.56 Mb candidate region associated with endosomal abnormalities. (C) Representation of the LCLs from euploid (green circle) and from individuals carrying either full trisomies 21 (red circle) or partial T21 (red open circles with numbers corresponding to B and Table2) in the plane defined by the percentage of large and small endosomes in their LCLs.+/2 indicate the presence/absence of enlarged endosomes.
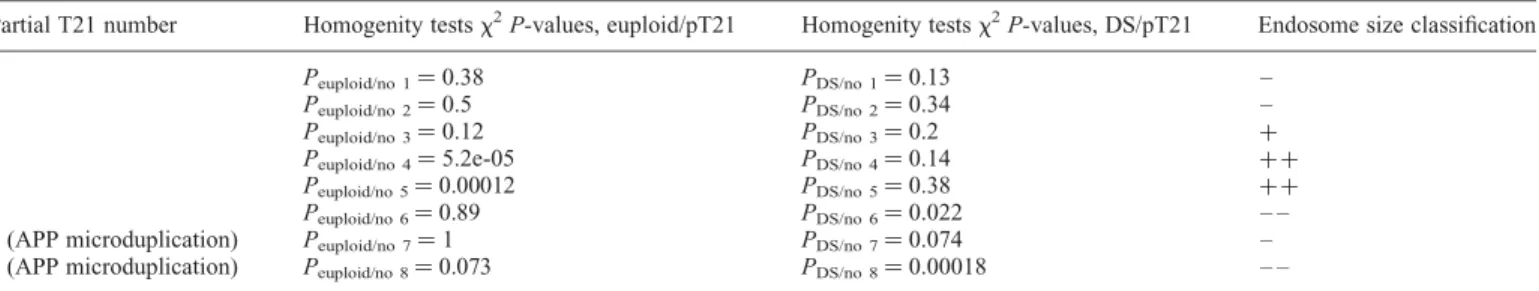
Table 3. Classification of the partial trisomies according to the size distribution of their endosome sizes
Partial T21 number Homogenity tests x2P-values, euploid/pT21 Homogenity tests x2P-values, DS/pT21 Endosome size classification
1 Peuploid/no 1¼ 0.38 PDS/no 1¼ 0.13 –
2 Peuploid/no 2¼ 0.5 PDS/no 2¼ 0.34 –
3 Peuploid/no 3¼ 0.12 PDS/no 3¼ 0.2 +
4 Peuploid/no 4¼ 5.2e-05 PDS/no 4¼ 0.14 ++
5 Peuploid/no 5¼ 0.00012 PDS/no 5¼ 0.38 ++
6 Peuploid/no 6¼ 0.89 PDS/no 6¼ 0.022 – –
7 (APP microduplication) Peuploid/no 7¼ 1 PDS/no 7¼ 0.074 –
8 (APP microduplication) Peuploid/no 8¼ 0.073 PDS/no 8¼ 0.00018 – –
For each partial trisomy LCL, the P-values Peuploidand PDSare those of the x2tests of homogenity of its endosome size distribution with that of the euploid and DS LCLs, respectively. When Peuploid, 5% and PDS≥ 5%, the partial trisomy is classified with confidence into the enlarged endosome phenotype (++), and conversely when Peuploid≥ 5% and PDS, 5% ( – – ); otherwise, the classification is weak (+ or 2).
Table 4. List of genes mapping to the 2.56 Mb chromosomal segment from Hsa21 functionally associated to the endosomal abnormalities in DS Gene present
on locus
Function
TIAM-1
SOD1 Antioxydant mechanisms involved in down syndrome phenotype
SFR15 Provide a link between transcription and pre-mRNA splicing. Alternatively spliced transcript variants have been described HUNK C21ORF45 MRAP FALP URB SNORA80 C21ORF63 TCP10 C21ORF77 C21ORF59
SYNJ1 Polyphosphatatase involved in endocytosis
C21ORF66 Transcription encodes a protein that may bind to GC-rich DNA sequences, which suggests its involvement in the regulation of transcription C21ORF49
C21ORF62 OLIG1 OLIG2
IFNAR2 Inflammation. The protein encoded by this gene is a type I membrane protein that forms one of the two chains of a receptor for interferons alpha and beta. Binding and activation of the receptor stimulates Janus protein kinases, which in turn phosphorylate several proteins, including STAT1 and STAT2 inflammation
IL10RB The protein encoded by this gene belongs to the cytokine receptor family. It is an accessory chain essential for the active interleukin 10 receptor complex. Coexpression of this and IL10RA proteins has been shown to be required for IL10-induced signal transduction
IFNAR1 The protein encoded by this gene is a type I membrane protein that forms one of the two chains of a receptor for interferons alpha and beta. Binding and activation of the receptor stimulates Janus protein kinases, which in turn phosphorylate several proteins, including STAT1 and STAT2 IFNGR2 This gene (IFNGR2) encodes the non-ligand-binding beta chain of the gamma interferon receptor. Human interferon-gamma
TMEM50B Encodes a predicted transmembrane protein over-expressed during cerebellar development in a Down syndrome mouse model, Tmem50b, is a developmentally regulated intracellular ER and Golgi apparatus membrane protein that may prove important for correct brain development through functions associated with precursor cells and glia
C21ORF4 DNAJC28
GART The protein encoded by this gene is a trifunctional polypeptide. It has phosphoribosylglycinamide formyltransferase, phosphoribosylglycinamide synthetase, phosphoribosylaminoimidazole synthetase activity which is required for de novo purine biosynthesis
SON
DONSON This gene lies downstream of the SON gene and spans 10 kb on chromosome 21. The function of this gene is unknown.
CRYZL1 This gene encodes a protein that has sequence similarity to zeta crystallin, also known as quinone oxidoreductase. This zeta crystallin-like protein also contains an NAD(P)H-binding site. Alternatively, spliced transcript variants have been observed but their full-length nature has not been completely determined
C21ORF60 ITSN1
ATP50 This ATP5O subunit is a key structural component of the stalk of the mitochondrial respiratory chain F1F0-ATP synthase and as such may contribute in a gene dosage-dependent manner to the phenotype of Down syndrome (trisomy 21)
CR626360
Genes expressed in LCLs are highlighted in grey.
expressing human cDNAs encoding Flag-tagged constructs of the long (170Kd) or short (145Kd) isoforms of SYNJ1 together with plasmids expressing either SYNJ1-shRNA or random-shRNA GFP-tagged. Supplementary Material, Figure S4A and B shows that SYNJ1-shRNA decreased significantly the expression of the long and short isoforms of SYNJ1 by 65 and 55%, respectively, as revealed by western blot and immunocytochemistry [P ¼ 0.017 and P ¼ 0.016 for the long and short isoforms, respectively; one-way analysis of variance (ANOVA)]. We next transfected DS and euploid fibroblasts with either SYNJ1-shRNA or random-shRNA. After 72 h, cells were fixed and labelled with EEA1 anti-body (Fig. 6A). Image analysis revealed that the mean numbers of endosomes per cell in DS and euploid fibroblasts transfected with
SYNJ1-shRNA or random-SYNJ1-shRNA were not statistically different (Fig.6B, two-way ANOVA P ¼ 0.75 for genotype, P ¼ 0.61 for treatment and P ¼ 0.58 for the interaction between geno-type and treatment). Importantly, the mean endosome size in fibroblasts from individuals with DS was significantly higher than the one from euploid fibroblasts after transfection with random shRNA, but the effect of SYNJ1-shRNA transfection on the mean endosome size was not significant (Fig. 6C, euploid 96.2, DS 108.3, P ¼ 3.2 1026for genotype, P ¼ 0.15 for treatment and P ¼ 0.46 for the interaction). However, the analysis of the size distributions of endosomes from DS fibro-blasts transfected with SYNJ1 shRNA or random shRNA using x2 homogeneity tests showed a significant difference, with the percentage of larger endosomes 1.3-fold lower in SYNJ1-shRNA-transfected DS fibroblasts (5.6%) when com-pared with random-shRNA-transfected DS fibroblasts (7.2%) (Fig. 6D, P ¼ 7.4 1024). Altogether, these results strongly suggest the involvement of SYNJ1 expression in the enlarged endosome phenotype.
DISCUSSION
This study is the first to describe a cellular phenotype in blood cells and LCLs from individuals with DS: the presence of ab-normally large endosomes using immunoflorescence labelling and confocal microscopy. Endosomal abnormalities in DS are thus not restricted to neurons and fibroblasts as demon-strated earlier (2,11). However, only peripheral cells appear to all contain enlarged endosomes, while in the brain not all neurons have enlarged endosomes and their percentage increases with age (2). In DS, endosomal abnormalities result from the direct or indirect overexpression of genes from Hsa21 that are at dosage imbalance. We searched for
these genes from Hsa21 by studying genotype – phenotype cor-relations in LCLs carrying partial trisomies 21. We have shown that triplication of a 2.56 Mb locus from Hsa21 is asso-ciated with the presence of endosomal abnormalities. This chromosomal segment contains 33 genes or predictions among which 14 are expressed in LCLs: SOD1, SFRS15, SYNJ1, C21ORF66, IFAR2, IL10RB, IFNAR1, IFNGR2, TMEM50B, GART, SON, CRYZL1, DONSON and ATP50. To our knowledge, only one (SYNJ1) is involved in endocyto-sis. The functions of the others can be categorized in three main groups: (i) inflammation-related genes (IFAR2, IL10RB, IFNAR1 and IFNGR2), (ii) mitochondria metabolism genes (CRYZL1 and ATP50) and (iii) transcription/translation genes (SFRS15, C21ORF66 and GART) (Table4). TMEM50B has been localized in the endoplasmic reticulum and in the Golgi apparatus (28), while SON and DONSON are involved in mRNA processing and gene expression (29). Although we cannot completely rule out a putative role of these genes in the formation of enlarged endosomes in DS, we focused on SOD1 and SYNJ1 which are particularly relevant to DS pheno-types (21,30). We knew from our previous work that SOD1 and SYNJ1 transcripts are increased in LCLs (23). SOD1 was shown not to be involved in the enlarged endosome phenotype (9). Interestingly, we found that SYNJ1 overexpres-sion in SH-SY5Y and in Tg(SYNJ1) mice produced morpho-logical changes of the early endosomes apparently similar to the one observed in blood cells or LCLs. Conversely, we showed that reducing SYNJ1 expression in DS fibroblasts decreases the number of enlarged endosomes. Although in these conditions, the endosomal phenotype was not fully rescued, we can speculate that this may either be due to the re-sidual expression of SYNJ1, resisting to the shRNA treatment, as suggested by the partial knockdown shown in Supplemen-tary Material, Figure S4, or to the existence of other genes contributing to this phenotype.
The SYNJ1 gene codes for the phosphoinositide phosphatase SYNJ1, which dephosphorylates most phosphoinositides through the combined action of its central inositol 5-phosphatase domain and NH2-terminal Sac1 domain. Among
all the phosphoinositides, PI(4,5)P2appears to be a key
sub-strate for SYNJ1, which dephosphorylates this lipid on the 5′ position via its 5-phosphatase domain (18,21,31,32). PI(4,5)P2
controls a variety of phenomena at the plasma membrane-cytosol interphase, including clathrin-mediated endocytosis and the recycling of synaptic vesicles (26,31). Interestingly, SYNJ1 overexpression in CHO cells causes a redistribution of Eps15, clathrin and a-adaptin into large clusters (33). More-over, abnormal synaptic morphology has been observed in flies overexpressing Synj1, and is associated with lower [PI(4,5)P2] levels (34). Finally, SYNJ1 has been shown to be
increased in post-mortem DS brains (20,27) and overexpression of this gene in DS mouse models was shown to cause a decrease in the levels of PI(4,5)P2 and cognitive deficits (21).
The involvement of SYNJ1 in endosomal abnormalities is consistent with the finding that the 145 kDa isoform inter-acts with endocytic SH3 domain-containing proteins, such as endophilin, amphiphysin and intersectin, while the 170 kDa isoform also interacts with clathrin, AP-2 and Eps15 (33,35–37). Both lipid phosphatase domains of SYNJ1 are required for proper synaptic vesicle internalization, although
Table 5. Correlations of endosomal dysmorphology analysed in LCLs from individuals with partial T21 with gene expression levels evaluated using Pear-son’s correlation coefficient and the associated two-sided P-values
Gene Correlation with the ‘enlarged endosome’ phenotype
r P-value
Rab5 0.03 0.92
Synj1 0.46 0.13
the 5-phosphatase domain appears to play a dominant role (18), consistent with the well-established role of PI(4,5)P2 in
clathrin-mediated endocytosis (32). Indeed, PI(4,5)P2control
the recruitment of clathrin adaptors to the cell surface as well as a number of accessory factors that are critical for clathrin-mediated endocytosis, including the fission factor dynamin. De-crease in intracellular PI(4,5)P2levels achieved by either
over-expression of SYNJ1’s 5-phosphatase domain or knock-down of the kinase PIP5Ks in COS-7 cells leads to severe defects in the internalization and recycling of the transferrin receptors (38). PI(4,5)P2metabolism in the adult brain is largely
con-trolled by the 145 kDa isoform of SYNJ1 (26,31) and PIPK1g (PIP kinase type 1g) (39). Transgenic mice over-expressing SYNJ1, and PIPK1g2 knock-out mice (PIPK1g2/2) have lower PI(4,5)P2levels (21,39). Interestingly, stimulation with
high K+ induces a larger increase in horseradish peroxydase (HRP)-labelled endosome-like endocytic intermediates in PIPK1g2/2 neurons when compared with control neurons (39). Interactions with the SH3 domain proteins are regulated by the level of phosphorylation of SYNJ1’s proline-rich COOH-terminal tail by Cdk5 and Calcineurin (40,41).
Interestingly, MNB/DYRK1A, a serine-threonine kinase mapping to Hsa21 involved in DS phenotypes, also
phosphorylates SYNJ1 and can regulate its interactions with amphyphisin and intersectin, at least in vitro (42). In addition, EphB2 that phosphorylates tyrosines in the proline-rich domain of SYNJ1 inhibits the interaction with endophilin and the 5′-phosphatase activity, leading to increased clathrin-dependant endocytosis (43).
Altogether, these observations suggest that overexpression of SYNJ1 leads to endosomal abnormalities by lowering PI(4,5)P2 levels. Consistent with this, increase in plasma
membrane cholesterol in HEK293 cells was shown to induce a depletion of [PI(4,5)P2] and to lead to the
forma-tion of enlarged endosomes (44,45). However, a contribu-tion of SYNJ1’s NH2-terminal Sac1 region cannot be
ruled out, as this catalytic domain can also dephosphorylate PI3P, a lipid that plays a key role in the physiology of endosomes (34).
We confirmed the presence of enlarged endosomes in the cortex of transgenic mice overexpressing Synj1, generated using a bacterial artificial chromosome spanning the region containing the mouse Synj1 gene with two additional unre-lated and not well-characterized gene predictions C21orf59 and C21orf66. C21orf59 does not appear to be expressed in LCLs and is thus unlikely to contribute to the endosomal
Figure 4. SYNJ1 overexpression induces DS-like endosomal dysmorphologies in SH-SY5Y neuroblastoma cells. (A) Representative confocal images of EEA1-positive early endosomes (in red) from SH-SY5Y neuroblastoma cells transfected or not with the Flag-SYNJ1 plasmid or the GFP plasmid; transfected cells (in green) were visualized using either an anti-Flag monoclonal antibody (SYNJ1-transfected) or by direct detection of GFP fluorescence (GFP-transfected cells). White arrows indicate endosomal abnormalities in cells overexpressing Flag-SYNJ1. (B) Mean number of EEA1-positive early endosomes in SH-SY5Y neuro-blastoma cells transfected with SYNJ1 (n ¼ 34) when compared with controls (n ¼ 31 for non-transfected and n ¼ 32 for GFP-transfected). (C) Mean endosome size in SH-SY5Y neuroblastoma cells transfected with SYNJ1 (n ¼ 34) when compared with controls (n ¼ 31 for non-transfected and n ¼ 32 for GFP-transfected). (D) Endosome size distribution of small-, medium- and large-sized endosomes, based on K-means clustering. (E) Representation of the SH-SY5Y neuroblastoma cells transfected (filled circle) or not (open circle) with the Flag-SYNJ1 plasmid (red) or the GFP plasmid (green) in the plane defined by their percentage of large and small endosomes.∗∗∗P , 0.0001,∗∗P , 0.001,∗P , 0.05.
anomalies in this cell type (23). However, we cannot rule out a putative role of C21orf66 on the observed phenotype in LCLs. While we show here a direct functional link between SYNJ1 overexpression and the presence of enlarged endo-somes, other genes mapping to Hsa21 have been reported to produce endosomal abnormalities as well. Knock-out mice for Intersectin (Itsn1) display abnormally enlarged
endosomes (46). Overexpression of Dyrk1A causes defects in clathrin-mediated endocytosis in fibroblasts (47). In add-ition, Jiang et al. (9) showed that overexpression of APP in fibroblasts from individuals with DS leads to the formation of enlarged endosomes. This result is not in accordance with the finding that APP transgenic mice have apparently normal early endosome morphology in neurons (8). Our
Figure 5. Transgenic mice overexpressing Synj1 show endosomal abnormalities in prefrontal cortex neurons. (A) Western blot analysis of brain extracts from Tg(SYNJ1) (n ¼ 4) and WT (n ¼ 4) mice probed by anti-SYNJ1 and anti-bactin antibodies. (B) Representative confocal images of EEA1-positive early endo-somes in neurons of the prefrontal cortex from WT and Tg(SYNJ1) mice. Morphometric analysis of EEA1-positive endoendo-somes were performed in neurons of three WT mice and four Tg(SYNJ1) mice. (C) Mean number of EEA1-positive early endosomes in neurons from Tg(SYNJ1) when compared with WT mice. (D) Mean endosome size in neurons from Tg(SYNJ1) when compared with WT mice. (E) Endosome size distribution of small-, medium- and large-sized endosomes, based on K-means clustering. (F) Representation of the WT (green) and Tg(SYNJ1) mice (red) in the plane defined by the percentage of large and small endo-somes in their neurons.∗∗∗P , 0.0001,∗P , 0.05.
study showed that enlarged endosomes were absent in LCLs carrying APP microduplications, while enlarged endosomes were detected in neurons derived from induced pluripotent stem cells (iPSCs) generated from fibroblasts of two indivi-duals carrying APP microduplications (48). Post-mortem studies in brain sections from patients carrying APP microdu-plications will be important to clarify the role of APP over-expression on endosomal abnormalities.
Amyloid b (Ab) is produced by enzymatic processing of APP within the endosomal compartment, and intracellular
Ab was localized principally in enlarged Rab5-positive endo-somes in neurons from AD and DS brains (10). Studies reported a link between SYNJ1 and Ab. Indeed, Ab42 oligo-mers were shown to decrease PI(4,5)P2 levels and that this
decrease was necessary to cause an LTP impairment in hippo-campal slices, based on experiments conducted in haploinsuf-ficient SYNJ1 mice (49). In addition, overexpression of SYNJ1 5′phosphatase domain increased Ab42 secretion and lowered PI(4,5)P2 levels (50). Learning deficits in transgenic mice
overexpressing SYNJ1 is associated with lower PI(4,5)P2
Figure 6. Downregulation of SYNJ1 expression in DS fibroblasts by shRNA partially rescues enlarged endosome phenotype. (A) Representative confocal images of EEA1-positive early endosomes (red) from euploid and DS fibroblasts transfected with random-shRNA (green) or SYNJ1-shRNA plasmid (green). (B) Mean number of EEA1-positive early endosomes from euploid and DS fibroblasts transfected with random-shRNA or SYNJ1-shRNA. (C) Mean endosome size from euploid and DS fibroblasts transfected with random-shRNA or SYNJ1-shRNA. (D) Endosome size distribution into small-, medium- and large-sized endosomes, based on K-means clustering.∗∗∗P , 0.0001.
levels, suggesting that treatments using inhibitors of SYNJ1 should restore PI(4,5)P2levels and improve synaptic functions
in individuals with DS (21,51). Interestingly, an elderly DS patient carrying a partial trisomy with no sign of AD path-ology had only two genomic copies of both APP and of SYNJ1 (52).
SYNJ1 is related to two newly identified AD risk factors: PICALM (phosphatidylinositol-binding clathrin assembly protein) involved in clathrin-mediated endocytosis and BIN1 (bridging integrator 1), a brain-specific SH3 domain-containing protein amphiphysin homologue highly enriched in nerve terminals which bind to SYNJ1, dynamin and clathrin (53–57).
Finally, a recent genome-wide screen in yeast for Ab tox-icity identified the orthologue of SYNJ1 as a suppressor, further highlighting the importance of the endocytic machin-ery in AD (58). Because of its roles in endocytosis and in the regulation of PI(4,5)P2levels, SYNJ1 could become an
at-tractive two-faced new AD-DS target for rescuing endocytic dysfunction in DS as shown here and likely in AD, and to modulate Ab toxicity as demonstrated earlier (49,58).
MATERIALS AND METHODS Cell cultures
Mononuclear blood cells
Heparinized blood samples were obtained from eight healthy volunteers and eight individuals with DS. All blood donors gave their informed consent to the participation in this study. The mononuclear cell fraction (MNCF) was isolated by carefully loading 4 ml of blood diluted in 8 ml of phosphate buffer saline (PBS) onto 3 ml of Pancoll Separating Solution (PANTMBIOTECH GmbH) at room temperature. After cen-trifugation 10 min at room temperature at 1000g, the MNCF was collected with a pipette (a membrane prevented contamin-ation with the granulocytes/erythrocytes). The MCNF was washed twice with PBS by centrifugation at 250g for 10 min. Three millions cells per blood sample were re-suspended in RPMI 1640-GlutaMAXTM (Invitrogen) sup-plemented with 10% FBS (Invitrogen) and transferred to culture dishes for 2 h.
Lymphoblastoı¨d cells lines (LCLs)
LCLs were derived from B lymphocytes of individuals with DS collected from the cytogenetic service of the hospital Necker Enfants Malades and the Institut Je´roˆme Lejeune. Parents of patients from the Institut Je´roˆme Lejeune gave their informed consent, and the French biomedical ethics com-mittee gave its approval for this study (Comite´ de Protection des Personnes dans la Recherche Biome´dicale number 03025). Written informed consent was obtained from the par-ticipants or from their families by the cytogenetic service of Hoˆpital Necker Enfants Malades. Cell lines from control individuals were also obtained with their written informed consent. All cell lines were karyotyped, to confirm their triso-mic or euploid status and also to verify that immortalization by the Epstein – Barr virus did not produce any visible chromo-somal rearrangement other than trisomy 21. Cells were har-vested by centrifugation, washed in 5 ml PBS and stored at
2808C. Lymphoblastoid cells were grown in Opti-MEM supplemented with 10% fetal bovine serum.
Neuroblastoma cells SH-SY5Y
SH-SY5Y cells grown in Dubelcco’s modified Eagle medium (DMEM) medium F12 supplemented with 10% fetal bovine serum were transfected with the Flag-SYNJ1 long isoform (170 kDa) plasmid (gift from Dr DeCamilli, Yale University School of Medicine, New Haven, CT, USA) using lipofecta-min LTX and Plus reagent (Invitrogen) and maintained in culture for 48 h.
Primary fibroblast cultures
Human forearm skin fibroblasts from individuals with DS and euploid age-matched controls were purchased from Coriell Cell Repositories. Cells were maintained at 378C and 5% CO2and cultured according to the Coriell Cell Repositories’s
protocol. Cell passage numbers ranged from p7 to p13 and cell confluency was 90%. Nucleofector solution (Amaxa) was used for transfecting SYNJ1-shRNA (purchased from Santa Cruz) and random-shRNA plasmid constructs (pTrip H1 random CMV GFP DeltaU3 Sequence; cccctcgtcatagcgtgcataggttcaa-gagacctatgcacgctatgacgatttttggaaa) kindly provided by Dr Philippe Ravassard and validated previously (59). Fibroblasts were fixed for EEA1 immunolabelling 72 h after transfection.
HEK293 cells
HEK293 cells grown in DMEM medium F12 supplemented with 10% fetal bovine serum were transfected with either Flag-SYNJ1-170 human ubiquitous isoform (170 kDa) plasmid or with Flag-SYNJ1-145 human neuronal isoform (145 kDa) DNA plasmids and with random-shRNA, kindly provided by Dr Philippe Ravassard and previously validated (59), or with SYNJ1-shRNA (purchased at Santa Cruz). All DNA plasmid constructs (0.5 mg) were transfected using lipofectamin (Invitrogen) and maintained in culture for 72 h.
Immunofluorescence
After fixation (paraformaldehyde 4%), cells were washed with PBS, permeabilized using triton (0.1%) and incubated 1 h with either the rabbit polyclonal anti-EEA1 antibody (1/200, Cell Signaling) or the sheep polyclonal anti-SOD1 antibody or the mouse monoclonal Flag M2 antibody (Sigma). Alexa-568- or Alexa-488-labelled secondary anti-bodies (Molecular Probes, 1/400) were used to reveal the primary antibody and incubated for 30 min. Images (1024× 1024 pixels) of individual cells were obtained on a Leica TCS NT confocal microscope using a×63, numerical aperture 1.4 oil immersion objective and ×6 zoom. Each picture was obtained from the equatorial cross-section through the cell that maximized nuclear diameter, under signal saturation. Co-detection of Alexa-488 and Alexa-568 fluorescence was done by excitation at 488 and 568 nm, using sequential detec-tion. The zoom was set up to achieve a final pixel resolution of 80 mM.
Protein extraction and immunoblots
Cells were washed twice and proteins were extracted for 2 h in a Tris buffer 0.05Mcontaining 0.1MNaCl, 5 mM
ethylenedia-minetetraacetic acid, 1% Nonidet P-40 and a protease inhibitor cocktail (Roche). Cell debris were removed by centrifugation at 13000g. Protein concentration was determined using the Dc protein assay kit (BIO-RAD). Frozen brains were homoge-nized for western blot analysis, and 50 mg of total protein per lane were loaded on a 4 – 12% gradient Bis – Tris gels under reducing conditions. Proteins were transferred on nitro-cellulose membranes (Whatman) that were hybridized with Rab5a (Santa Cruz), rabbit polyclonal antibody to the C-terminus of SYNJ1 (gift from Dr DeCamilli) or Actin (Abcam) antibodies. After incubation with horseradish peroxidase-conjugated secondary antibodies (Molecular Probes), signal was revealed using Immobilon western chemo-luminescent HRP substrate (Millipore).
RNA extraction and real-time quantitative PCR
One microgram of each RNA was individually reverse-transcribed into cDNAs overnight at 378C using the Verso cDNA kit (ThermoFisher Scientific, Waltham, MA, USA) according to the manufacturer’s instructions. qPCR assays were performed in a Lightcyclerw 480 System (Roche), in the presence of 200 nMof each primer, 100 nMof specific
hy-drolysis probe (designed with Universal Probe Library, Roche Applied Science) and 1× Lightcyclerw 480 Probes Master mix (Roche, France) and normalized using the Lightcyclerw 480 SW 1.5 software and two normalization genes: PolR2A and RNF4. Primers were GATGGTCAAGGTCGCAAG-forward, GAATTTCAAATCCAACAAAGTCTG-reverse and ATCTGGTCCTAGTCACTGG-probe for SYNJ1; CCAAT TTCATGAATTTCAAGAGAG-forward, TCAAACTTTACT GTAGTGTCATC-reverse and AGAAAAGCAGCCCCAA TG-probe for RAB5; TGGACAGGCAAGCAAATC-forward, CAGAGACTTCTTACACAGGATG-reverse and TCTCCAC CACCACCTTG-probe for PolR2A; CTCAGGTACTGTCA GTTGTC-forward, CGATGAGACGTCCATTCTG-reverse and TCTGAGTATCCGTCCATGC-probe for RNF4.
Mapping of partial trisomies 21 using ultra-high resolution CGH
For detailed structural Hsa21 aberration detection, high-resolution array-CGH with NimbleGen HG18 chromosome 21-specific 385K arrays was used (B3752001-00-01; Roche NimbleGen Systems, Madison, WI, USA). The 385K average probe distance was 70 bp. DNA labelling, array hybridization, post-hybridization washes and scanning were essentially per-formed according to the manufacturer’s instructions (Roche NimbleGen). The acquired images were analysed using Nim-bleScan V2.4 extraction software (Roche NimbleGen). For each probe on the array, the log2 Cy3/Cy5 ratio (relative inten-sity of the Cy3 labelled patient DNA versus the Cy5-labeled male DNA reference pool of five healthy male individuals) was calculated using the segMNT algorithm, which also applied an automatic segment detection. A 50× averaging window was generated, resulting in 3500 bp segments for this
array. Previously determined breakpoints (e.g. by cytogentic or other array-CGH means) were re-analysed and fine-mapped using the 3.5 kb averaging window accuracy. Data were visua-lized in SignalMap V1.9 software (Roche NimbleGen).
Immunohistochemistry on brain slices from Tg(SYNJ1) and wild-type mice
Mice were anaesthetized. Two groups of mice were used in this experiment. In the first group, mice [three WT and four Tg(SYNJ1)] were perfused transcardially with 4% paraformal-dehyde in 0.1M Na2HPO4/NaH2PO4 buffer (pH 7.5). Brains
were extracted, post-fixed overnight in the fixative solution used for perfusion and stored at 48C. In the second group (four WT and four Tg(SYNJ1)), brains were extracted and split up into two parts. Half of the brains were incubated in formol, and the other halves were used for biochemical studies. Sections (30 mm thick) were cut with a Vibratome (Leica) and kept at 2208C until use in a solution containing 30% (vol/vol) ethylene glycol, 30% (vol/vol) glycerol and 0.1M phosphate buffer. Floating sections were saturated for
1 h with 10% normal goat serum in Tris – buffered saline (TBS: 25 mM Tris-Cl, 150 mM NaCl, pH 7.4). Sections were
then rinsed three times in TBS and incubated with a rabbit anti-EEA1 antibody (1/200, Cell Signalling) and a MAP2 mouse antibody specific of neuronal cells (60) (1/200, Chemi-con) followed by anti-rabbit-Alexa-488 and anti-mouse-Alexa-568 (Invitrogen) (1/500). Sections were mounted in Vectashield with 4′,6-diamidino-2-phenylindole counterstain (Vector Laboratories). Images (1024× 1024 pixels) of indi-vidual cells were obtained on a Leica TCS NT confocal micro-scope using a ×63, numerical aperture 1.4 oil immersion objective and ×6 zoom. The zoom was set up to achieve a final pixel resolution of 80 mM.
Morphometric analysis of endosomes
Images of individual cells were analysed using the spot detect-or plugin (id ICY-R3M2Y2) of ICY (http://icy.bioimageana lysis.org). The spot detector extracts spots in images using an undecimated wavelet transform (61,62). The number and size of endosomes were measured in 12 – 22 individual cells from mononuclear blood cells of 8 controls and 8 individuals with DS and LCLs of 9 controls and 12 individuals with DS. For SH-SY5Y neuroblastoma cells, analyses were per-formed on 31 non-transfected cells, 32 cells transfected with the GFP plasmid and 34 cells transfected with the SYNJ1 plasmid. For the analysis of mouse brains, the number and size of endosomes was measured in 9 – 15 individual neurons in the prefrontal cortex from WT and Tg(SYNJ1) mice. Finally, for fibroblast cells, analysis was performed on 20 non-transfected cells, and 45 cells transfected with either SYNJ1-shRNA or random-shRNA constructs.
Statistical analysis
For the morphometric analysis of the endosomes, three parameters were taken into consideration: the mean number of endosomes per cell, the mean endosome size and the endosome size distribution. Table 1 summarizes, Human Molecular Genetics, 2012, Vol. 21, No. 14 3169
for each experiment, the conditions that were to be com-pared, and the number of samples analysed (individuals, cells or mice).
Comparison of the mean numbers of endosomes per cell For the mononuclear blood cells, the prefrontal cortical neurons and the LCL experiments, the comparison of the mean numbers of endosomes per cell was performed between two conditions, with a varying number of cells per in-dividual. Assuming constant variance of the endosome number across individuals or mice, the variance of the mean endosome number for each condition is hence inversely proportional to the number of cells from which it is estimated. Thus, the esti-mation of the effects (means) and of the significance of their difference was performed using weighted least squares (WLS), each squared error being weighted by the inverse of the number of cells.
The analysis of the SH SY5Y experiment involved three conditions: non-transfected, GFP transfected and SYNJ1 transfected. Thus, a one-way analysis of variance was per-formed. The latter showing a difference in means, it was fol-lowed by pairwise comparisons (t-tests without corrections for multiple testing).
The primary fibroblast experiments were performed from one individual with DS, and one age-matched euploid (21 years old), with 20 cells for each. Thus, a standard t-test was used to establish the non-significance of the mean endo-some size difference between the two genotypes.
Finally, the fibroblast experiment involving an euploid control and a DS patient, 45 cells of each being transfected with random shRNA, and 45 other cells with SYNJ1-shRNA, a two-way ANOVA was used to establish that the effects of both genotype and treatment were not significant.
Comparison of the mean endosome sizes
For the mononuclear blood cells, the prefrontal cortical neurons and the LCLs experiments, the comparison of the mean endosome size was performed between two conditions, with a varying number of endosomes per cell. Since the mean endosome size sometimes clearly varied from one sample to the other (individual or mouse), we thus systematic-ally added an individual factor (fixed) to the genotype factor, and tested its significance as well. Since the factors are nested, there was no interaction. As before, we used WLS for the ana-lysis but this time, the weighting was performed according to the number of endosomes for each cell. The primary fibroblast experiment involved the same test, except that no individual effect had to be tested.
The analysis of the SH-SY5Y again involved three conditions. There was no individual effect to add, but since the comparison of three means had to take into account the varying number of endosomes per cell, we also used WLS.
Finally, the fibroblast experiments involved four conditions, depending on genotype (euploid or DS) and treatment (random shRNA or SYNJ1-shRNA), without individual effect. We performed the test of genotype, condition and inter-action, taking the varying number of endosomes per cell into account.
Comparison of the endosome size distributions
Although the effect of the individual sometimes proved sig-nificant, we considered the overall distribution of the endo-some size. For each experiment, endoendo-somes were classified into three groups (small, medium and large size) using K-means clustering. The homogeneity of the distributions across conditions was then tested with a x2-test. For some of the experiments, in order to account for the possible individual effect that is neglected when pooling the endosome of all indi-viduals, we also plotted the individual in the plane defined by their (individual) percentages of small (on the x-axis) and large (on the y-axis) endosomes.
Classification of the partial trisomies for the genotype – phenotype correlation
In order to analyse the LCLs from partial trisomies and to clas-sify them as euploids (no endosomal abnormalities) or DS (presence of enlarged endosomes), for each of them we tested the homogeneity of the distribution of their endosome size with that of the euploid and DS LCLs, the criterion for classification into small, medium and large endosomes being the one obtained previously with the K-means on the euploid and DS LCLs. For the majority of the LCLs from partial trisomies, the two x2 tests led to opposite decisions with a type I error risk of 5% (the partial trisomy was homo-geneous with one phenotype and not with the other), thus allowing univocal classification. For some LCLs, the tests failed to reject one of the phenotypes: LCLs with PDS.
Peuploid. 5% were considered to have the enlarged endosome
phenotype, LCLs with Peuploid. PDS. 5% were not.
Correlations of endosomal abnormalities in LCLs from individual with partial T21 with gene expression levels were evaluated using Pearson’s correlation coefficient. Because of the small sample size (n ¼ 8), we avoided the use of non-parametric correlation measures such as Spearman’s or Kendall’s coefficients.
SUPPLEMENTARY MATERIAL
Supplementary Material is available at HMG online.
ACKNOWLEDGEMENTS
The authors wish to thank Drs DeCamilli and Ravassard for their gift of plasmids, and Dr Menten from the Department of Pediatrics and Medical Genetics, Gent University, Belgium for providing material of case 5.
Conflict of Interest statement. None declared.
FUNDING
This work was supported by the Agence Nationale de la Re-cherche (ChoAD to M.-C.P. and C.D.); the European Commu-nities (AnEUploidy to M.-C.P., A.H., Y.G., S.E.A., J.A.V. and J.M.D.); the Fondation ICM and the Fondation Thierry et Annick Desmaret-Institut de France to M.C.P. and C.D.; the National Institutes of Health (R01 HD055457 to G.D.P.); and the Foundation Jerome Lejeune to G.D.P.
REFERENCES
1. Cataldo, A.M., Barnett, J.L., Pieroni, C. and Nixon, R.A. (1997) Increased neuronal endocytosis and protease delivery to early endosomes in sporadic Alzheimer’s disease: neuropathologic evidence for a mechanism of increased beta-amyloidogenesis. J. Neurosci., 17, 6142– 6151.
2. Cataldo, A.M., Peterhoff, C.M., Troncoso, J.C., Gomez-Isla, T., Hyman, B.T. and Nixon, R.A. (2000) Endocytic pathway abnormalities precede amyloid beta deposition in sporadic Alzheimer’s disease and Down syndrome: differential effects of APOE genotype and presenilin mutations. Am. J. Pathol., 157, 277 – 286.
3. Thinakaran, G. and Koo, E.H. (2008) Amyloid precursor protein trafficking, processing, and function. J. Biol. Chem., 283, 29615 – 29619. 4. Delabar, J.M., Goldgaber, D., Lamour, Y., Nicole, A., Huret, J.L., de
Grouchy, J., Brown, P., Gajdusek, D.C. and Sinet, P.M. (1987) Beta amyloid gene duplication in Alzheimer’s disease and karyotypically normal Down syndrome. Science, 235, 1390– 1392.
5. Goldgaber, D., Lerman, M.I., McBride, O.W., Saffiotti, U. and Gajdusek, D.C. (1987) Characterization and chromosomal localization of a cDNA encoding brain amyloid of Alzheimer’s disease. Science, 235, 877 – 880. 6. Kang, J., Lemaire, H.G., Unterbeck, A., Salbaum, J.M., Masters, C.L.,
Grzeschik, K.H., Multhaup, G., Beyreuther, K. and Muller-Hill, B. (1987) The precursor of Alzheimer’s disease amyloid A4 protein resembles a cell-surface receptor. Nature, 325, 733 – 736.
7. Tanzi, R.E., Gusella, J.F., Watkins, P.C., Bruns, G.A., St George-Hyslop, P., Van Keuren, M.L., Patterson, D., Pagan, S., Kurnit, D.M. and Neve, R.L. (1987) Amyloid beta protein gene: cDNA, mRNA distribution, and genetic linkage near the Alzheimer locus. Science, 235, 880 – 884. 8. Cataldo, A.M., Petanceska, S., Peterhoff, C.M., Terio, N.B., Epstein, C.J.,
Villar, A., Carlson, E.J., Staufenbiel, M. and Nixon, R.A. (2003) App gene dosage modulates endosomal abnormalities of Alzheimer’s disease in a segmental trisomy 16 mouse model of down syndrome. J. Neurosci., 23, 6788– 6792.
9. Jiang, Y., Mullaney, K.A., Peterhoff, C.M., Che, S., Schmidt, S.D., Boyer-Boiteau, A., Ginsberg, S.D., Cataldo, A.M., Mathews, P.M. and Nixon, R.A. (2009) Alzheimer’s-related endosome dysfunction in Down syndrome is A{beta}-independent but requires APP and is reversed by BACE-1 inhibition. Proc. Natl Acad. Sci. USA, 107, 1630– 1635. 10. Cataldo, A.M., Petanceska, S., Terio, N.B., Peterhoff, C.M., Durham, R.,
Mercken, M., Mehta, P.D., Buxbaum, J., Haroutunian, V. and Nixon, R.A. (2004) Abeta localization in abnormal endosomes: association with earliest Abeta elevations in AD and Down syndrome. Neurobiol. Aging, 25, 1263 – 1272.
11. Cataldo, A.M., Mathews, P.M., Boiteau, A.B., Hassinger, L.C., Peterhoff, C.M., Jiang, Y., Mullaney, K., Neve, R.L., Gruenberg, J. and Nixon, R.A. (2008) Down syndrome fibroblast model of Alzheimer-related endosome pathology: accelerated endocytosis promotes late endocytic defects. Am. J. Pathol., 173, 370 – 384.
12. Ginsberg, S.D., Alldred, M.J., Counts, S.E., Cataldo, A.M., Neve, R.L., Jiang, Y., Wuu, J., Chao, M.V., Mufson, E.J., Nixon, R.A. et al. (2010) Microarray analysis of hippocampal CA1 neurons implicates early endosomal dysfunction during Alzheimer’s disease progression. Biol. Psychiatry, 68, 885 – 893.
13. Roberts, R.L., Barbieri, M.A., Pryse, K.M., Chua, M., Morisaki, J.H. and Stahl, P.D. (1999) Endosome fusion in living cells overexpressing GFP-rab5. J. Cell Sci., 112, 3667 – 3675.
14. Nixon, R.A. (2005) Endosome function and dysfunction in Alzheimer’s disease and other neurodegenerative diseases. Neurobiol. Aging, 26, 373 – 382.
15. Cataldo, A., Rebeck, G.W., Ghetri, B., Hulette, C., Lippa, C., Van Broeckhoven, C., van Duijn, C., Cras, P., Bogdanovic, N., Bird, T. et al. (2001) Endocytic disturbances distinguish among subtypes of Alzheimer’s disease and related disorders. Ann. Neurol., 50, 661 – 665.
16. Lyle, R., Bena, F., Gagos, S., Gehrig, C., Lopez, G., Schinzel, A., Lespinasse, J., Bottani, A., Dahoun, S., Taine, L. et al. (2009) Genotype-phenotype correlations in Down syndrome identified by array CGH in 30 cases of partial trisomy and partial monosomy chromosome 21. Eur. J. Hum. Genet., 17, 454 – 466.
17. Korbel, J.O., Tirosh-Wagner, T., Urban, A.E., Chen, X.N., Kasowski, M., Dai, L., Grubert, F., Erdman, C., Gao, M.C., Lange, K. et al. (2009) The genetic architecture of Down syndrome phenotypes revealed by high-resolution analysis of human segmental trisomies. Proc. Natl Acad. Sci. USA, 106, 12031 – 12036.
18. Mani, M., Lee, S.Y., Lucast, L., Cremona, O., Di Paolo, G., De Camilli, P. and Ryan, T.A. (2007) The dual phosphatase activity of synaptojanin1 is required for both efficient synaptic vesicle endocytosis and reavailability at nerve terminals. Neuron, 56, 1004– 1018.
19. Chang-Ileto, B., Frere, S.G., Chan, R.B., Voronov, S.V., Roux, A. and Di Paolo, G. (2011) Synaptojanin 1-mediated PI(4,5)P2 hydrolysis is modulated by membrane curvature and facilitates membrane fission. Dev. Cell, 20, 206 – 218.
20. Arai, Y., Ijuin, T., Takenawa, T., Becker, L.E. and Takashima, S. (2002) Excessive expression of synaptojanin in brains with Down syndrome. Brain Dev., 24, 67 – 72.
21. Voronov, S.V., Frere, S.G., Giovedi, S., Pollina, E.A., Borel, C., Zhang, H., Schmidt, C., Akeson, E.C., Wenk, M.R., Cimasoni, L. et al. (2008) Synaptojanin 1-linked phosphoinositide dyshomeostasis and cognitive deficits in mouse models of Down’s syndrome. Proc. Natl Acad. Sci. USA, 105, 9415 – 9420.
22. Rovelet-Lecrux, A., Hannequin, D., Raux, G., Le Meur, N., Laquerriere, A., Vital, A., Dumanchin, C., Feuillette, S., Brice, A., Vercelletto, M. et al. (2006) APP locus duplication causes autosomal dominant early-onset Alzheimer disease with cerebral amyloid angiopathy. Nat. Genet., 38, 24 – 26.
23. Ait Yahya-Graison, E., Aubert, J., Dauphinot, L., Rivals, I., Prieur, M., Golfier, G., Rossier, J., Personnaz, L., Creau, N., Blehaut, H. et al. (2007) Classification of human chromosome 21 gene-expression variations in Down syndrome: impact on disease phenotypes. Am. J. Hum. Genet., 81, 475 – 491.
24. Prandini, P., Deutsch, S., Lyle, R., Gagnebin, M., Delucinge Vivier, C., Delorenzi, M., Gehrig, C., Descombes, P., Sherman, S., Dagna Bricarelli, F. et al. (2007) Natural gene-expression variation in Down syndrome modulates the outcome of gene-dosage imbalance. Am. J. Hum. Genet., 81, 252 – 263.
25. Cremona, O., Nimmakayalu, M., Haffner, C., Bray-Ward, P., Ward, D.C. and De Camilli, P. (2000) Assignment of SYNJ1 to human chromosome 21q22.2 and Synj12 to the murine homologous region on chromosome 16C3 – 4 by in situ hybridization. Cytogenet. Cell Genet., 88, 89 – 90. 26. Kim, W.T., Chang, S., Daniell, L., Cremona, O., Di Paolo, G. and De
Camilli, P. (2002) Delayed reentry of recycling vesicles into the fusion-competent synaptic vesicle pool in synaptojanin 1 knockout mice. Proc. Natl Acad. Sci. USA, 99, 17143 – 17148.
27. Cheon, M.S., Kim, S.H., Ovod, V., Kopitar Jerala, N., Morgan, J.I., Hatefi, Y., Ijuin, T., Takenawa, T. and Lubec, G. (2003) Protein levels of genes encoded on chromosome 21 in fetal Down syndrome brain: challenging the gene dosage effect hypothesis (Part III). Amino Acids, 24, 127 – 134. 28. Moldrich, R.X., Laine, J., Visel, A., Beart, P.M., Laffaire, J., Rossier, J.
and Potier, M.C. (2008) Transmembrane protein 50b (C21orf4), a candidate for Down syndrome neurophenotypes, encodes an intracellular membrane protein expressed in the rodent brain. Neuroscience, 154, 1255 – 1266.
29. Wynn, S.L., Fisher, R.A., Pagel, C., Price, M., Liu, Q.Y., Khan, I.M., Zammit, P., Dadrah, K., Mazrani, W., Kessling, A. et al. (2000) Organization and conservation of the GART/SON/DONSON locus in mouse and human genomes. Genomics, 68, 57 – 62.
30. Epstein, C.J. (1997) 1996 ASHG Presidential Address. Toward the 21st century. Am. J. Hum. Genet., 60, 1 – 9.
31. Cremona, O., Di Paolo, G., Wenk, M.R., Luthi, A., Kim, W.T., Takei, K., Daniell, L., Nemoto, Y., Shears, S.B., Flavell, R.A. et al. (1999) Essential role of phosphoinositide metabolism in synaptic vesicle recycling. Cell, 99, 179 – 188.
32. Di Paolo, G. and De Camilli, P. (2006) Phosphoinositides in cell regulation and membrane dynamics. Nature, 443, 651 – 657.
33. Haffner, C., Di Paolo, G., Rosenthal, J.A. and de Camilli, P. (2000) Direct interaction of the 170 kDa isoform of synaptojanin 1 with clathrin and with the clathrin adaptor AP-2. Curr. Biol., 10, 471 – 474.
34. Chang, K.T. and Min, K.T. (2009) Upregulation of three Drosophila homologs of human chromosome 21 genes alters synaptic function: implications for Down syndrome. Proc. Natl Acad. Sci. USA, 106, 17117 – 17122.
35. Mishra, S.K., Hawryluk, M.J., Brett, T.J., Keyel, P.A., Dupin, A.L., Jha, A., Heuser, J.E., Fremont, D.H. and Traub, L.M. (2004) Dual engagement regulation of protein interactions with the AP-2 adaptor alpha appendage. J. Biol. Chem., 279, 46191 – 46203.
36. Perera, R.M., Zoncu, R., Lucast, L., De Camilli, P. and Toomre, D. (2006) Two synaptojanin 1 isoforms are recruited to clathrin-coated pits at different stages. Proc. Natl Acad. Sci. USA, 103, 19332 – 19337. 37. Micheva, K.D., Kay, B.K. and McPherson, P.S. (1997) Synaptojanin
forms two separate complexes in the nerve terminal. Interactions with endophilin and amphiphysin. J. Biol. Chem., 272, 27239 – 27245. 38. Kim, S., Kim, H., Chang, B., Ahn, N., Hwang, S., Di Paolo, G. and Chang,
S. (2006) Regulation of transferrin recycling kinetics by PtdIns[4,5]P2 availability. FASEB J., 20, 2399– 2401.
39. Di Paolo, G., Moskowitz, H.S., Gipson, K., Wenk, M.R., Voronov, S., Obayashi, M., Flavell, R., Fitzsimonds, R.M., Ryan, T.A. and De Camilli, P. (2004) Impaired PtdIns(4,5)P2 synthesis in nerve terminals produces defects in synaptic vesicle trafficking. Nature, 431, 415 – 422. 40. Slepnev, V.I., Ochoa, G.C., Butler, M.H., Grabs, D. and De Camilli, P.
(1998) Role of phosphorylation in regulation of the assembly of endocytic coat complexes. Science, 281, 821 – 824.
41. Lee, S.Y., Wenk, M.R., Kim, Y., Nairn, A.C. and De Camilli, P. (2004) Regulation of synaptojanin 1 by cyclin-dependent kinase 5 at synapses. Proc. Natl Acad. Sci. USA, 101, 546 – 551.
42. Adayev, T., Chen-Hwang, M.C., Murakami, N., Wang, R. and Hwang, Y.W. (2006) MNB/DYRK1A phosphorylation regulates the interactions of synaptojanin 1 with endocytic accessory proteins. Biochem. Biophys. Res. Commun., 351, 1060 – 1065.
43. Irie, F., Okuno, M., Pasquale, E.B. and Yamaguchi, Y. (2005)
EphrinB-EphB signalling regulates clathrin-mediated endocytosis through tyrosine phosphorylation of synaptojanin 1. Nat. Cell Biol., 7, 501 – 509. 44. Chun, Y.S., Shin, S., Kim, Y., Cho, H., Park, M.K., Kim, T.W., Voronov,
S.V., Di Paolo, G., Suh, B.C. and Chung, S. (2010) Cholesterol modulates ion channels via down-regulation of phosphatidylinositol 4,5-bisphosphate. J. Neurochem., 112, 1286 – 1294.
45. Cossec, J.C., Marquer, C., Panchal, M., Lazar, A.N., Duyckaerts, C. and Potier, M.C. (2010) Cholesterol changes in Alzheimer’s disease: methods of analysis and impact on the formation of enlarged endosomes. Biochim. Biophys. Acta, 1801, 839 – 845.
46. Yu, Y., Chu, P.Y., Bowser, D.N., Keating, D.J., Dubach, D., Harper, I., Tkalcevic, J., Finkelstein, D.I. and Pritchard, M.A. (2008) Mice deficient for the chromosome 21 ortholog Itsn1 exhibit vesicle-trafficking abnormalities. Hum. Mol. Genet., 17, 3281– 3290.
47. Kim, Y., Park, J., Song, W.J. and Chang, S. (2010) Overexpression of Dyrk1A causes the defects in synaptic vesicle endocytosis. Neurosignals, 18, 164 – 172.
48. Israel, M.A., Yuan, S.H., Bardy, C., Reyna, S.M., Mu, Y., Herrera, C., Hefferan, M.P., Van Gorp, S., Nazor, K.L., Boscolo, F.S. et al. (2012) Probing sporadic and familial Alzheimer’s disease using induced pluripotent stem cells. Nature, 482, 216 – 220.
49. Berman, D.E., Dall’Armi, C., Voronov, S.V., McIntire, L.B., Zhang, H., Moore, A.Z., Staniszewski, A., Arancio, O., Kim, T.W. and Di Paolo, G. (2008) Oligomeric amyloid-beta peptide disrupts phosphatidylinositol-4,5-bisphosphate metabolism. Nat. Neurosci., 11, 547 – 554.
50. Landman, N., Jeong, S.Y., Shin, S.Y., Voronov, S.V., Serban, G., Kang, M.S., Park, M.K., Di Paolo, G., Chung, S. and Kim, T.W. (2006) Presenilin mutations linked to familial Alzheimer’s disease cause an imbalance in phosphatidylinositol 4,5-bisphosphate metabolism. Proc. Natl Acad. Sci. USA, 103, 19524– 19529.
51. Di Paolo, G. and Kim, T.W. (2011) Linking lipids to Alzheimer’s disease: cholesterol and beyond. Nat. Rev. Neurosci., 12, 284 – 296.
52. Prasher, V.P., Farrer, M.J., Kessling, A.M., Fisher, E.M., West, R.J., Barber, P.C. and Butler, A.C. (1998) Molecular mapping of Alzheimer-type dementia in Down’s syndrome. Ann. Neurol., 43, 380 – 383.
53. Harold, D., Abraham, R., Hollingworth, P., Sims, R., Gerrish, A., Hamshere, M.L., Pahwa, J.S., Moskvina, V., Dowzell, K., Williams, A. et al. (2009) Genome-wide association study identifies variants at CLU and PICALM associated with Alzheimer’s disease. Nat. Genet., 41, 1088– 1093.
54. Miller, J.A., Horvath, S. and Geschwind, D.H. (2010) Divergence of human and mouse brain transcriptome highlights Alzheimer disease pathways. Proc. Natl Acad. Sci. USA, 107, 12698 – 12703.
55. Baig, S., Joseph, S.A., Tayler, H., Abraham, R., Owen, M.J., Williams, J., Kehoe, P.G. and Love, S. (2010) Distribution and expression of picalm in Alzheimer disease. J. Neuropathol. Exp. Neurol., 69, 1071– 1077. 56. Hollingworth, P., Harold, D., Sims, R., Gerrish, A., Lambert, J.C.,
Carrasquillo, M.M., Abraham, R., Hamshere, M.L., Pahwa, J.S., Moskvina, V. et al. (2011) Common variants at ABCA7, MS4A6A/ MS4A4E, EPHA1, CD33 and CD2AP are associated with Alzheimer’s disease. Nat. Genet., 43, 429 – 435.
57. Ramjaun, A.R., Micheva, K.D., Bouchelet, I. and McPherson, P.S. (1997) Identification and characterization of a nerve terminal-enriched amphiphysin isoform. J. Biol. Chem., 272, 16700 – 16706.
58. Treusch, S., Hamamichi, S., Goodman, J.L., Matlack, K.E., Chung, C.Y., Baru, V., Shulman, J.M., Parrado, A., Bevis, B.J., Valastyan, J.S. et al. (2011) Functional links between Abeta toxicity, endocytic trafficking, and Alzheimer’s disease risk factors in yeast. Science, 334, 1241 – 1245. 59. Collombat, P., Xu, X., Ravassard, P., Sosa-Pineda, B., Dussaud, S.,
Billestrup, N., Madsen, O.D., Serup, P., Heimberg, H. and Mansouri, A. (2009) The ectopic expression of Pax4 in the mouse pancreas converts progenitor cells into alpha and subsequently beta cells. Cell, 138, 449 – 462.
60. Salthun-Lassalle, B., Hirsch, E.C., Wolfart, J., Ruberg, M. and Michel, P.P. (2004) Rescue of mesencephalic dopaminergic neurons in culture by low-level stimulation of voltage-gated sodium channels. J. Neurosci., 24, 5922– 5930.
61. Olivo-Marin, J.C. (2002) Extraction of spots in biologicalimages using multiscale products. Pattern Recognition, 35, 1989– 1996.
62. Avale, M.E., Chabout, J., Pons, S., Serreau, P., De Chaumont, F., Olivo-Marin, J.C., Bourgeois, J.P., Maskos, U., Changeux, J.P. and Granon, S. (2011) Prefrontal nicotinic receptors control novel social interaction between mice. FASEB J., 25, 2145 – 2155.