The Contribution of Mobile Telecommunication Technology to Sustainable
Development in Selected Countries in Africa
by
Alexander Shih
Bachelor of Science, Mechanical Engineering Cornell University, 2005
Submitted to the System Design and Management Program and the Technology and in Partial Fulfillment of the Requirements for the Degrees of
Master of Science in Engineering and Management and Master of Science in Technology and Policy
at the
Massachusetts Institute of Technology June 2011
Policy Program
ARCHIVES
OF TECHNOLOGYLIBRARIES
@ 2011 Massachusetts Institute of Technology. All rights reserved.I1
Signature of Author... ...
System Desig'n and Management Program Technology and Policy Program May 5, 2011
a /I
C e rtifie d by ... j ....t ... ? . .
Nicholas A. Ashford, Thesis Su rvisor Professor of Technology and Policy Direct Technology and Law gram
A cce pted by...-... ..
atrick C. Hale Director, System Design and Management Program
Accepted by... ... DaV-a J. Newman Professor of Aeronautics and Astronautics and ngineering Systems Director, Technology and Policy Program
The Contribution of Mobile Telecommunication Technology to Sustainable
Development in Selected Countries in Africa
by
Alexander Shih
Submitted to the System Design and Management Program and the Technology and Policy Program on May 5, 2011 in Partial Fulfillment of the Requirements for the Degrees of
Master of Science in Engineering and Management and Master of Science in Technology and Policy
Abstract
While most of the world's population resides in countries that are wealthy or developing, the rest reside in low-income and least developed countries (LDCs), left behind and growing more disconnected. At the same time, mobile phones are widely adopted in these underdeveloped areas and demonstrate
potential for economic development. However, technological innovation and policies have often addressed narrow dimensions of poverty and development. Sustainable development, on the other hand, assesses the welfare of a country in its entirety. This then begs the question of how mobile telephony technology, given its pervasiveness, can be beneficial on a systemic and sustainable level. This document presents evidence that mobile phones can contribute to sustainable development in several ways. The focus is on selected countries in the sub-Saharan Africa region: Kenya, Tanzania, Uganda, and Nigeria, each of which is categorized as a LDC. The Sustainable Development framework is used to analyze data from case studies and existing technology, institutional and policy trends in the mobile telecommunication industry.
The evidence from literature demonstrates that mobile initiatives focused on niche areas, such as banking and health, have benefited on the community level and improved operations within firms. Mobile industry policies have created a healthy system of innovation in these countries. However, environmental development has been secondary or even ignored. Thus, the recommendations focus on prioritizing sustainability, specific policies continuing diffusion and adoption, technology transfer mechanisms, increased robustness in data-tracking and countering external economic shocks.
The data presented is not meant to be comprehensive nor complete. Consequently, suggested future work addresses short-term, mid-term, and long-term strategies. Specific areas include examining causal linkages for mobile phone adoption, designing technology initiatives around sustainability goals, and drivers that facilitate technology transfer.
Mobile telecommunication technology offers real opportunities for development and growth in Africa. If the focus of development shifts from mere economic growth to sustainable development, countries can not only transform their economic fortunes but also enhance the quality of their environment.
Thesis Supervisor: Nicholas A. Ashford
Title: Professor of Technology and Policy Director, Technology and Law Program
Acknowledgements
First and foremost, I would like to thank God. It is by no small measure that I am able to complete this journey. All the opportunities I've been given and all that I've achieved are a testimony of His Grace and
not of my own abilities. Thank You.
I would also like to extend my gratitude and appreciation to Professor Nicholas Ashford. As my advisor,
you have been incredibly patient with my intellectual growth and understanding of development. Your mentorship along this journey has been invaluable. I am especially grateful for your accommodations of my schedule in the final semester. Thank you for your continued support despite the unpredictable events that all too often come up in life. I still remember being inspired by your lecture in my thesis seminar course and eagerly waiting to meet with you to discuss potential research topics. I will always appreciate your challenging and thought-provoking questions, and never forget our meetings which were both constructive and encouraging. Thank you.
I would like to express my appreciation for Pat Hale, Director of the System Design and Management
Program and Professor Dava Newman, Director of the Technology and Policy Program, for all your guidance and accommodations to help me through my graduate studies. You both have been incredibly supportive and understanding, which has made a potentially very challenging transition much smoother than it could have been. I am grateful for the guidance you have provided, both professionally and
personally. Thank you.
I would also like to thank the various faculty and staff at the Massachusetts Institute of Technology that
have made my time here an incredibly memorable experience. I am truly grateful for the unique courses (D-Lab, G-Lab, NextLab), initiatives and events (MIT $100K, IDEAS, MISTI), and programs and clubs (Middle East Education through Technology, Graduate Student Council) that have opened up a world of opportunities to me, bringing me to places like as India, Kenya, Tanzania, Uganda and Israel and
introducing me to amazing work done around the world. I have grown tremendously throughout these experiences. Thank you.
My arrival at this point would not be possible without the constant and loving support of my family.
Mom (Chia Li Shih) and Dad (Han Ming Shih): thank you both so much for your prayers and grace throughout this process, for being patient when I'm not, for being loving when I'm not. Grace, even though you were incredibly busy with medical school, your notes of encouragements over the past few years have been extremely helpful. I could not have completed this without all of you. Thank you. To all my friends who have supported me along this journey, there are too many to mention - I am truly thankful for you. Those closest to me have picked me up during my lowest lows and have celebrated with me during my highest highs. It's been an emotional adventure and I could not have endured the ride without all of you. Last but certainly not least, I would also like to thank my dearest partner, Naomi. Naomi, although you joined me towards the end, your encouragements and prayers have been essential for me to end on a high note. Thank you all.
Alex Shih May 2011 Boston, Massachusetts
Table of Contents
1. Introduction ... 13
1.1 Developm ent and Growth: An Overview ... 13
1.1.1. A Tale of Three Worlds: Developed, Developing, and Least Developed ... 13
1.1.2. The Developm ent Experience of the Developing Econom ies... 13
1.1.3. M obile Technology in Sub-Saharan Africa as a Focus of Study ... 14
1.2. Factor Endowments: Innovation Systems and Mobile Technology ... 14
1.3. Sustainable Developm ent in the Underdeveloped Scene... 16
1.4. Risks and Opportunities ... 16
1.5. Structure of Thesis...17
2. Developm ent and Growth ... 19
2.1. Overview of Developm ent and Growth ... 19
2.2. Factor Endow m ents ... 20
2.3. System s of Innovation ... 21
2.3.1. Technology...22
2.3.1.1. China and India ... 23
2.3.2. Institutions ... 24
2.3.2.1. China and India ... 24
2.3.3. Policy...26
2.3.3.1. China and India ... 27
2.4. Im plications for LDCs... 29
2.4.1. Determ inants for Success and Failure ... 30
3. Sustainability...32
3.1 Overview of Sustainability... 32
3.2. Sustainable Developm ent Fram ework ... 32
3.3. Other Perspectives ... 34
3.4. Experiences of Sustainability in China and India ... 36
3.4.1. Sustainability in China ... 38
3.4.2. Sustainability in India ... 39
3.5. Setting the Path for Sub-Saha ran Africa ... 40
4. Regional Analysis and M obile Industry in Sub-Saharan Africa ... 42
4.1 Current Developm ent Experience in Sub-Saharan Africa ... 42
4.2. Current State of Factor Endow m ents... 47
4.3. The M obile Telecom m unication Industry in Sub-Saharan Africa... 47
4.4.1. Technology Options ... 51
4.4.1.1. Kenya ... 52
4.4.1.2. Tanzania ... 53
4.4.1.3. Uganda ... 54
4.4.1.4. Nigeria ... 55
4.4.2. Institutional Organization and Structure... 56
4.4.2.1. Kenya ... 59 4.4.2.2. Tanzania ... 60 4.4.2.3. Uganda ... 60 4.4.2.4. Nigeria ... 61 4.4.3. Policies ... 62 4.4.3.1. Kenya ... 64 4.4.3.2. Tanzania ... 65 4.4.3.3. Uganda ... 65 4.4.3.4. Nigeria ... 65 4.5. Effects of Globalization...66 4.5.1. Balance of Payments... 67 4 .5 .2 . T ra d e ... 6 8 4.5.3. Foreign Assistance ... 68
4.6. Need for Unique Solutions...68
5. M obile Industry Influence on Sustainability in Sub-Saharan Africa... 70
5.1. Overview...70 5 .2 K e ny a ... 7 2 5.2.1 Economy ... 72 5.2.2. Em ployment...80 5.2.3. Environment ... 84 5.3. Tanzania...85 5.3.1. Economy ... 85 5.3.2. Em ployment...89 5.3.3. Environment ... 90 5.4. Uganda ... 91 5.4.1. Economy ... 91 5.4.2. Em ployment...95 5.4.3. Environment ... 99 5 .5 . N ige ria ... 10 0
5.5.1. Econom y ... 100
5.5.2. Em ploym ent... 104
5.5.3. Environm ent ... 108
6. Analysis of Options and Pathways ... 109
6.1. Im pact Based on Assessm ent against Sustainability Indicators ... 110
6.1.1. Econom ic Sustainability ... 110
6.1.2. Em ploym ent Sustainability ... 114
6.1.3. Environm ental Sustainability...117
6.2. Linkages...121
6.2.1. Econom y and Em ploym ent Linkage...121
6.2.2. Em ploym ent and Environment Linkage...124
6.2.3. Econom y and Environm ent Linkage ... 126
6.3. W illingness for Diffusion and Adoption ... .. 130
6.4. M otivation and Opportunity ... 131
6.5. Current Capacity... 132
7. Recom m endations...133
7.1. Focused Recom m endations ... 133
7.2 Barriers and M itigation ... 139
7.3 Future W ork ... 140
7.4 Conclusions...142
List of Figures
Figure 1.1: Share of the World GDP by developed, developing, and least developed countries...14
Figure 1.2: Total mobile phone subscriptions; Figure 1.3: Mobile phone subscriptions/100 inhabitants. 15 Figure 1.4: Mobile subscriptions and penetration in Africa; Figure 1.5: Comm. growth in Africa/100 in ha b ita nts. ... 15
Figure 2.1: GDP of China and India; Figure 2.2: GDP growth rates of China and India (5 yr moving ave rag e ) ... 2 2 Figure 3.1: Sustainable Developm ent Fram ework... 33
Figure 3.2: UN CSD Sustainability Framework Indicators. ... 35
Figure 3.3: Population living in absolute poverty (%
)...
36
Figure 3.4: W orld carbon em issions (1902-2000)... 36
Figure 3.5: W orld carbon em issions (2000-2009)... 37
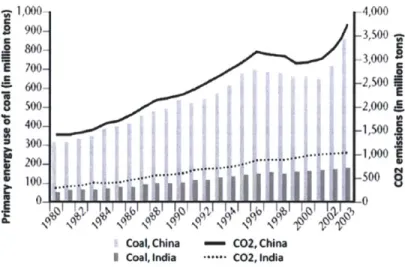
Figure 3.6: Primary Energy Use of Coal and Total C02 Emissions from Fossil Fuel Consumption...37
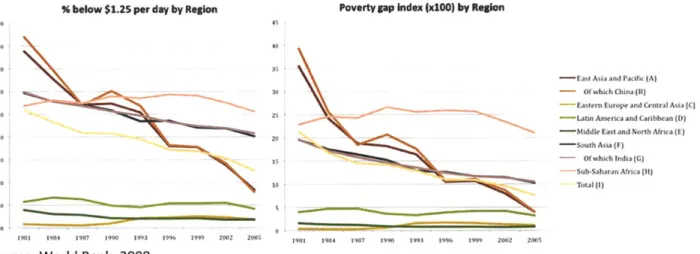
Figure 4.1: % below $1.25 per day around the world and poverty gap index by region...42
Figure 4.2: Kenya - GDP: real growth rate (%) population below poverty line (%)...44
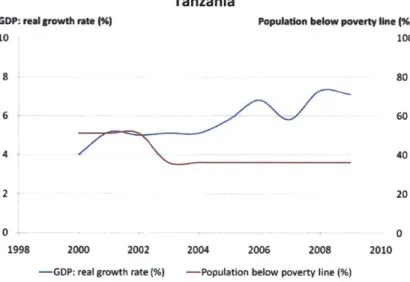
Figure 4.3: Tanzania - GDP: real growth rate (%) and population below poverty line (%)... 45
Figure 4.4: Uganda - GDP: real growth rate
(%)
and population below poverty line (%)...46Figure 4.5: Nigeria - GDP: real growth rate
(%)
and population below poverty line (%)... 46Figure 4.6: Growth in mobile telephone coverage in AICD study countries. ... 49
Figure 4.7: Number of mobile phone subscribers and coverage in Africa. ... 50
Figure 4.8: Stakeholders in mobile telecommunication industry... 57
Figure 4.9: Flow chart of innovation through a mobile innovation system...57
Figure 4.10: Telecom governance score. ... 58
Figure 4.11: State of m obile com petition. ... 59
Figure 4.12: Telecom regulatory score. ... 63
Figure 4.13: Telecom revenue as share of GDP ... 63
Figure 5.1: Overall Sustainability Index Scores by Country, 1975-2000. ... 70
Figure 5.2: Two effects of mobile broadband deployment. ... 71
Figure 5.3: Growth of mobile phone and land line users in Kenya... 75
Figure 5.4: Ranking of the category effects of M-PESA on communities. ... 75
Figure 5.5: Country ratings of the corporate payment default risk, by region... 77
Figure 5.6: Total investment in infrastructure with private participation in SSA, 1990-2001...79
Figure 5.7: Economic impact of mobile communications industry as a percentage of GDP...86
Figure 5.8: GDP and communications sector % growth rates. ... 92
Figure 5.9: Fixed and m obile service revenues in Nigeria. ... 101
Figure 5.10: Mobile service revenue as a percentage of GDP in select African markets, 2009...101
Figure 5.11: Mobile service revenue contribution to GDP in Nigeria...102
Figure 5.12: Total taxes paid by MNOs and their contribution as a % of total tax receipts in select African co u ntries, 20 0 6 . ... 10 3 Figure 5.13: Private investment by telecom operators in Nigeria, 2001-2008...104
Figure 5.14: M TN Nigeria capital expenditures, 2003-2009...104
Figure 5.15: Employment related to mobile sector in Nigeria, 2008...106
Figure 6.1: Economic sustainability index scores by African countries, 1975-2000...113
Figure 6.2: Institutional sustainability index scores by African countries, 1975-2000...117
Figure 6.3: Environmental sustainability index scores by African countries, 1975-2000...120
List of Tables
Table 4.1: Profiles of Selected Countries in Africa... 47
Table 4.2: Internet users, computer ownership and fixed lines. ... 48
Table 4.3: Mobile penetration and growth rate, 2003-08... 49
Table 4.4: Cell Phone Users w ithout access to grid. ... 50
Table 4.5: Summary of Technology Options for Selected Countries. ... 56
Table 4.6: Summary of Institutions for Selected Countries... 62
Table 4.7: Sum mary of Policies for Selected Countries. ... 66
Table 5.1: Selected econom ic indicators. ... 72
Table 5.2: Indicators of Africa's Infrastructure ... 78
Table 5.3: Investment rates and returns on fixed capital in eight countries...80
Table 5.4: Im pact of m obile phones in Tanzania. ... 90
Table 6.1: Assessment of the selected countries on economic sustainability indicators...110
Table 6.2: Assessment of the selected countries on employment sustainability indicators...115
Table 6.3: Assessment of the selected countries on environmental sustainability indicators...118
Table 6.4: Assessment of the selected countries on economy-employment linkage indicators...123
Table 6.5: Assessment of the selected countries on employment-environment linkage indicators...125
Table 6.6: Assessment of the selected countries on economy-environment linkage indicators...127
1. Introduction
1.1 Development and Growth: An Overview
1.1.1. A Tale of Three Worlds: Developed, Developing, and Least Developed
While the world is in many ways connected, there is a population, often called the bottom billion or least developed countries (LDCs), that is becoming increasingly disconnected from the global economy. During the period between 1960 and 2004, real per capita income in the developing world such as India and China grew at an average rate of 2.1% per year - a fairly considerable growth rate (Rodrik, 2007). Rich countries grew at a rate of 2.5% per year during the same period. However, the LDCs1 experienced stagnant growth or even declining growth (UN, 2003), increasing the economic gap between themselves and the rest of the world.
There is a paradox in our world today. Eighty-five percent of the world's population resides in countries that are wealthy or developing with upward growth. The rest reside in low-income and underdeveloped states, left behind and continually falling behind. This interconnected web of our world has high-growth countries and no-growth countries; countries that have grown rapidly throughout and countries that have been declining.
1.1.2. The Development Experience of the Developing Economies
The pattern of economic performance has varied greatly across different time periods. China and India have been major success stories since the late 1970s, with China experiencing a growth rate of 8.0% since 1978 and India roughly doubling its growth rate since the early 1980s (pulling South Asia's growth rate up to 3.3% between 1980 and 2000 from 1.1% between 1960 and 1980). The developing countries that are not part of the bottom billion, the middle four billion, have experienced rapid and accelerating growth in per capita income. During the 1970s, they grew at 2.5% per year. During the 1980s and 1990s, their growth rate accelerated to 4% per year. During the early 2 1s century, it accelerated again to 4.5%
per year (Collier, 2007). Between 1981 and 2005, the number of people in poverty has fallen by around
600 million in China alone.
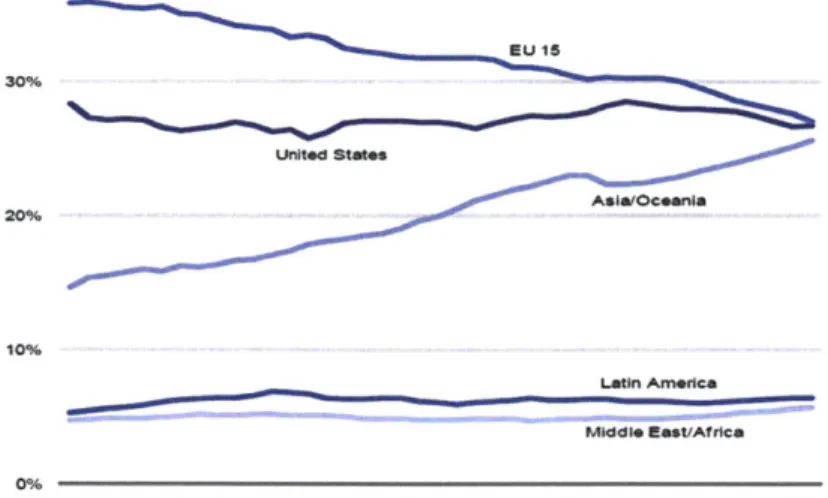
While there has been great progress in reducing poverty, it has been far from uniform. The global picture masks large, regional differences. Figure 1.1 below illustrates the growing gap between the developed and least developed countries during the last four decades (Schill, 2010).
A country is classified as a LDC if it meets three criteria:
e low-income (three-year average GNI per capita of under USD $905, which must exceed $1,086 to exit the list) * human resource weakness (based on indicators of nutrition, health, education and adult literacy)
* economic vulnerability (based on instability of agricultural production, instability of exports of goods and services, economic importance of non-traditional activities, merchandise export concentration, handicap of economic smallness, and the percentage of population displaced by natural disasters)
EU 15 309 Asta(cweanla 20% 10% Latin Amoea MiOWl Eaat/lfrica 0% 1969 1972 1975 1976 1981 1964 1987 1990 1993 1996 1999 2002 2006 2008
Sources: USDA Economic Research Service; World Bank World Development Indicators; International Financial Statistics of the IMF; Global Insight; Oxford Economic Forecasting.
Figure 1.1: Share of the World GDP by developed, developing, and least developed countries. During the 1970s, the bottom billion diverged in growth from the rest of the developing world by 2% a year. This divergence accelerated to 4.4% a year during the 1980s and further to 5% during the 1990s. In sub-Saharan Africa (SSA), the $1.25 a day poverty rate has shown no sustained decline over the whole period since 1981, starting and ending at around 50%. In absolute terms, the number of poor people has nearly doubled, from 200 million in 1981 to 380 million in 2005.
1.1.3. Mobile Technology in Sub-Saharan Africa as a Focus of Study
The geography that this thesis centers on is the sub-Saharan Africa region. Several countries in this geography are categorized as LDCs, according to the United Nations, exhibiting some of the lowest indicators of socioeconomic development and lowest Human Development Index (HDI) ratings of all countries in the world. A detailed regional assessment will be in Chapter 4.
The value of mobile phones is arguably higher for LDCs. The main benefits, which will be expanded on in Chapter 5, are that they overcome systemic constraints, such as unpredictable environments, lack of infrastructure, lack of transport, and high social barriers. While the rural poor are not homogenous, consisting of artisans, farmers, fishermen, migrant workers, and indigenous people, a common element is their lack of affordable access to relevant information and knowledge services. The lack of access to such services can lead to contributors of poverty, such as ignorance of income-earning or market opportunities.
1.2. Factor Endowments: Innovation Systems and Mobile Technology
While many regions in the SSA region are described as least developed or underdeveloped, they also exhibit a baseline of physical, industrial, political, and institutional infrastructure for an emerging economy and for development to ignite and sustain. They exhibit many variables, namely factor endowments, which demonstrate potential for development and growth. Specifically, they have innovation systems and a capacity for technological innovation with mobile telephony. Innovation systems are enabling institutions fostering technological innovation, a complex system of interacting determinants, reflecting different political, social, and economic development cultures and traditions. According to the International Monetary Fund (IMF), development entails a modern infrastructure, and a potential to shift away from low value added sectors such as agriculture and natural resource
extraction (IMF, 2010).
The African mobile market exceeded half a billion subscribers during 2010, hitting about 506 million (Nwankwo, 2010). This is a 20% increase since 2008 and an exponential growth since the 16 million users in 2000. The mobile subscriber base is projected to grow to 842 million by 2015. Figures 1.2 and
1.3 illustrate the rapid growth of mobile telephony in the developing world.
4 140
3
2000 2001 2002 2003 2004 2005 2006 2007 2008 0
2000 01 02 03 0 05 @0 07 03 05 2d10-U Developed countries N Developing countries s Developed counties *to Developing countries :1& World Sources: World Bank; ITU. Sources: ITU; ICT indicators database.
Figure 1.2: Total mobile phone subscriptions; Figure 1.3: Mobile phone subscriptions/100 inhabitants. Figures 1.4 and 1.5 show the growth of mobile phone subscribers in Africa.
00 100% - mobile cela - mensers - Fixed Wephone - Mobile broadband - Fixed broadand subscriptions lines subscribers subscribers 35 800 -0%32 6 30% 400 -0 0 6 0 % 2 30 2 22 120
j
200 40% 100 100 20% 10 + 0% 45 2002'2003'2004 2005 2000 200? 200 2006 2010 2011 2012 - -E E E E E 01-N= Subscrters -- Penetraion 1998 2000 2002 2004 2006 2008Sources: ITU World Telecommunication; ICT indicators database
Figure 1.4: Mobile subscriptions and penetration in Africa; Figure 1.5: Comm. growth in Africa/100 inhabitants. From a wide range of uses, whether it's checking market prices of crops, transferring money, diagnosing medical conditions, or simply making a call, mobile phones are transforming Africa. For example,
productivity gains from mobile telephony operations can be substantial. This can be evaluated through a range of factors, from the number of workers relying on mobile phones to revenue and time savings due
to mobile phones, with benefits including business expansion, employment search, entrepreneurship,
money transfer, and transaction costs (Deloitte and Touche, 2007). Case studies and reports have also
demonstrated GDP per capita increases with the addition of mobile phones into a community, given a
certain baseline, and opportunities have increased due to access to employment and market
information (ITU, 2009). The growth of mobile phone subscribers and associated mobile applications in
Africa has received claims that the technology will be Africa's "silver bullet" for economic growth
(Perkins, 2010).
However, the only way for this technology to have an economic and social impact on the world's developing and least developed populations, the crux of the development challenge, is through appropriate and complementary technological and policy innovations that facilitate entrepreneurship and development initiatives, and ensure distributive benefits. Otherwise, those living in extreme poverty
(under USD $1 a day) will be left out of the benefits reaped from this technological boom.
BRIC countries, specifically India and China, can play an importantly role in the development of the selected LDCs, serving as a role model for lesser developed countries. But India's and China's growing presence may also deprive the latter nations from global integration. As the emergence of energy and mobile technology grows, only with the appropriate policies and careful monitoring will these LDCs truly benefit from innovation.
1.3. Sustainable Development in the Underdeveloped Scene
The problem of a lack in development contains multiple dimensions, with economic development as just one of those dimensions. Solutions that enable economic and social development in all societies, according to economists M. P. Todaro and S. C. Smith should aim (Todaro and Smith, 2009):
e To increase the availability and widen the distribution of basic life-sustaining goods such as food, shelter, health, and protection.
e To raise the quality of life (securing more meaningful jobs and enhancing cultural and human values).
e To expand the range of economic and social choices available to individuals and nations, by freeing them from dependence to other nations, but also from the forces of ignorance and human misery.
Thus, sustainable development incorporates economic and social development and centers on the interdependence and interaction of three dimensions:
* Employment Growth: increasing rewarded and rewarding opportunities e Economic Development: increasing access to capital
e Environmental Protection: increasing quality of life
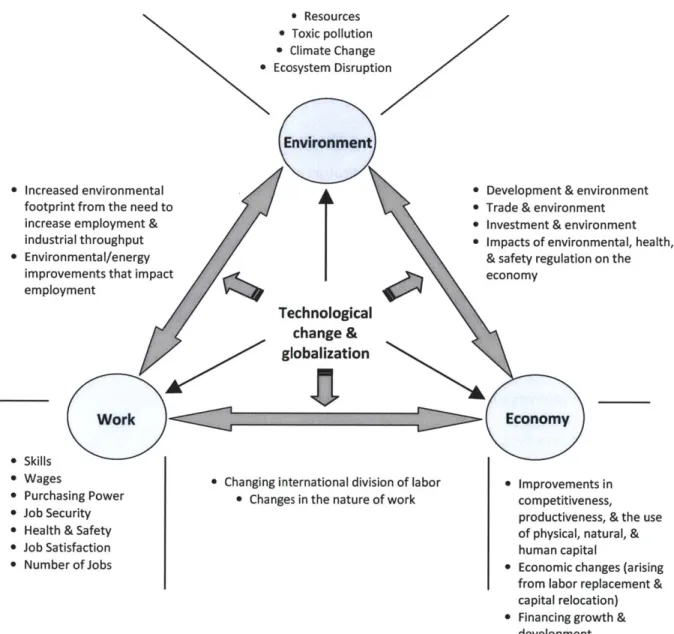
This thesis will use Massachusetts Institute of Technology Professor Nicholas Ashford's Sustainable Development Framework to assess the performance of mobile telephony innovation against the three dimensions of sustainability: Economy, Employment, and Environment.
1.4. Risks and Opportunities
As the adoption of mobile technology increases in sub-Saharan Africa and the supporting infrastructure develops, there will also be a growing costs, namely real costs such as environmental damage and opportunity costs related to equitable wealth and information distribution.
To truly have a positive impact, the mobile technology boom will require complementary access to public infrastructure, such as reliable electricity, with appropriate policies that will not hinder further adoption and use, especially by the poorest. The taxes levied by national governments on these technologies have the power to make their adoption and use cost prohibitive. For Africans living in extreme poverty, cell phones still remain inaccessible and unaffordable. The lack of adequate transportation infrastructure is still a major obstacle. In SSA, only 29% of roads are paved and barely
Thus, the real opportunity is not solely technological. While creative and innovative uses of mobile technology that benefit the economic livelihood of the world's poor can be attractive, complementary policies and institutional arrangements are absolutely necessary. This includes top-level, supply-side policies that ensure market competition to grow the mobile industry, such as designing appropriate antitrust laws for the industry players, as well as demand-side policies to ensure affordability and accessibility for those in need. The rise of mobile telephony usage has led to growing concerns over information and cyber security and environmental dangers due to e-waste. With these new risks, local governments are designing legislation to regulate usage and minimize the potential harmful effects. Collaborations between public, private, and NGO institutions are also forming to address these risks. Both domestic and international policies will need to promote the development of mobile technology and protect users and entrepreneurs from economic disincentives.
The challenges of developing such policies include the capacity to do so, the ability to consult with all the relevant stakeholders, and the communication process. Currently, many policies being developed in these countries do not address the needs of the people, often seen as irrelevant to the society.
International organizations and domestic institutions need to diligently implement, monitor, and evaluate the effectiveness of policies, managing where investments are distributed and ensuring that the incentives are in place to spread mobile penetration to the most rural of villages, and that the economic benefits are distributed appropriately. This is the only way that emerging technology has a chance to positively impact the livelihoods of Africans in the long run.
1.5. Structure of Thesis
Poverty cannot disappear unless the bottom billion grow. They will not grow unless development is ignited and sustained. And it can't be done with a one-size-fits-all solution as previously prescribed with the Washington Consensus. Development strategies must acquire mastery over a broader range of activities, instead of concentrating on what one does best. The most significant instances of productive diversification are indeed the result of concerted government action and of public-private collaboration. Entrepreneurs must experiment with new product lines. They must experiment with technologies from established producers abroad and adapt them to local conditions. The type of discovery that matters in these contexts differ from innovation and R&D as traditionally understood. The development process in LDCs is largely about structural change: it's characterized by economist Dani Rodrik as one in which an economy finds out - or self-discovers - what it can be good at, out of many products and processes that already exist. What is involved is not just inventing new products or processes, but "discovering" a certain good, which can already be established in global markets, that can be produced at home and at low cost (Rodrik, 2009). Each country and each environment needs uniquely tailored solutions that mix top-down frameworks with local knowledge.
The purpose of this thesis is to examine the role of mobile telephony technology and mobile
applications, and institutional and policy instruments within this technology's broader social, economic, and political system for addressing development challenges in least developed countries, focusing on sub-Saharan Africa. The outcome is to propose a systematic but customized approach to identifying innovation opportunities in low-income countries and fashioning appropriate pathways to achieve sustainable development through technology, institutional activity, and policy mechanisms. Integral to the analysis of the system in which these technologies operate would be to investigate any
The research begins with an analysis of the relationship between existing models of economic development and growth in the context of factor endowments (Chapter 2). The discussion then
advances to the effects of economic growth on sustainability (Chapter 3). This includes an analysis of the limits of the GDP growth paradigm, but also of the effects of growth LDCs and the interconnection of economic growth and ecological collapse. The focus of analysis then shifts to the regional analysis of sub-Saharan Africa and its mobile telecommunication industry (Chapter 4). Mobile telephony technology and their effects on sustainable development are examined through case studies and industry reports (Chapter 5). The performance of the technological options, institutions, and policies are presented and analyzed and assessed against the indicators of the Sustainable Development Framework (Chapter 6). Synthesis of the relationship between mobile telephony technology and sustainable development is presented, including options for technology, institutions, and policies that promote sustainability. The discussion is concluded by recommendations on appropriate and effective options and pathways that could be employed so that mobile telephony technology can facilitate sustainability (Chapter 7). Additionally, an examination of current and potential barriers preventing mobile telecommunication technology to contribute to sustainable development in the selected countries along with suggested future work concludes this document.
2. Development and Growth
2.1. Overview of Development and GrowthTheories of development and its challenges has been around for awhile and is most recently associated with the work of development economists like Jeffrey Sachs, who has focused on the consequences of poverty traps such as health problems. For example, malaria keeps countries poor, and because they are poor, the potential market for a vaccine is not sufficiently valuable to warrant drug companies making the huge investment in research that is necessary. Economist and author Paul Collier writes that the failure of the growth process in these least developed countries (LDCs) needs to be our core concern, and curing it the core challenge of development. In other words, economic growth will only occur through the igniting and sustaining of a development process.
Economic growth has been at the center of analysis since the origins of economic theory. Growth, however, should not be considered as an end goal in itself because it does not account for non-traded goods, services, and cultural attributes. Economists have focused their efforts on analyzing the causes of growth for centuries since it has the potential to decrease poverty, increase the standard of living, support goals such as education and healthcare, and substantially affect the quality of life of a country's citizens. The metrics used to measure growth are typically in terms of increased GNP and GDP. However, not all increases in these metrics are necessarily good. There is "good GDP" and "bad GDP" (Ashford and Hall, 2011). For example, the GDP of a region might increase as a result of activities related to disaster and crisis mitigation, but it is clear that this kind of increase in GDP is not the main goal, even if service-providers profited from the activity. Increased economic activity (involving expenditures for goods and services) due to natural or human-made disasters is not part of any deliberate growth strategy of government in its trusteeship role for its people.
Furthermore, economic growth is generally used to describe how already-developed nations further enhance their economies. Development, on the other hand, is not a purely economic phenomenon, but is most necessary and applicable for LDCs. Economists M. P. Todaro and S. C. Smith describe that the objectives of economic and social development in all societies should aim to (Todaro and Smith, 2009):
e To increase the availability and widen the distribution of basic life-sustaining goods such as food, shelter, health, and protection.
e To raise the quality of life (securing more meaningful jobs and enhancing cultural and human values).
e To expand the range of economic and social choices available to individuals and nations, by freeing them from dependence to other nations, but also from the forces of ignorance and human misery.
Thus, development strategies should take on a multidimensional approach, involving the reorganization and reorientation of entire economic and social systems. In addition to improvements in inputs and outputs, development typically involves radical changes in institutional, social and administrative structures, as well as in popular attitudes and even customs and beliefs. Furthermore, while development is usually defined in a national context, its widespread realization may necessitate fundamental modification of the international economic and social system (Todaro and Smith, 2009).
There are also other positive attributes of development that are not captured by GNP and GDP. For this reason, other indexes of human development, such as the Happy Planet Index (HPI)2, such as health and
education, have received increased attention. Many contributions to economic growth are desirable and require a government's economic or industrial policy. However, the role of national governments in the context of economic development is essential. Contrary to the view of many neoclassical economists, this role should not be limited to ensuring the proper functioning of markets and the correction of market failures. They are contributing elements systems that foster innovation, or innovation systems, which often functions on a national level and embody technological, institutional, and policy
components.
2.2. Factor Endowments
A country's factor endowment is commonly referred to as the amount of land, labor, capital - its factors
of production - and entrepreneurship that they might possess to be exploited for economic growth (Ashford and Hall, 2011). Countries with a large endowment of resources tend to be more prosperous than those with a small endowment, with all other variables being equal. When a nation's economy is driven mostly by the agrarian sector, land is the most highly valued factor. After industrialization, material resources, energy, and more skilled labor take on higher importance. This is especially relevant when describing some of the shortcomings of economic development in sub-Saharan Africa (SSA) where there is a lack in building a labor force through education and income-generation (Collier, 2007).
A comprehensive list of factor endowments, which captures the growing importance of services and
knowledge-based work, would generally include (Ashford and Hall, 2011): Land, Material Resources (natural and physical capital), Energy, Labor (capable of performing physical work), Know-How (intellectual human capital), Built capital (i.e., infrastructure such as railways, bridges, roads, ports, airports, dams, etc.), Health and Environment, Structural Capital (knowledge and productive routines held by organizations), Networks and Outsiders (linking organizations, people, and entrepreneurs), Social Capital (knowledge held by consumers and citizens), Systems of Innovation, and Information and Communication Technology (ICT).
Systems of innovation, or innovation systems, and mobile telephony technology (a subset of ICT) are the factor endowments most relevant to this research, but there are certainly other factor endowments important for development and diffusion of technology. Innovation systems are discussed in the context of the institutions fostering technological innovation. It is important to remember that unlike other factors that can be easily acquired, innovation systems describe a complex system of interacting determinants, reflecting different political, social, and economic cultures and traditions. In general, industrialized nations have highly-developed innovation systems, while LDCs differ markedly in their infrastructure, legal institutions, and political systems that could enhance more optimal use their other factor endowments that they possess. Harvard Kennedy School Professor and author Dani Rodrik argues for more "self-discovery," through the experimentation of technology, coordination of government
policies, and government-private sector communication in these less developed nations (Rodrik, 2007).
2 The HPI is an innovative measurement index that combines environment impact with well-being to show
ecological efficiency with which human well-being is delivered (www.happyplanetindex.org).
3 Good human health (both physical and mental) and an unpolluted and preserved environment (what could be
called "environmental capital") are increasingly regarded as essential for maintaining the productiveness of human and natural/physical capital even if they are not factors of production per se (Ashford and Hall, 2011).
The development of institutions to access and equitably distribute these resources is necessary in order for a country to obtain the greatest benefit from its factor endowments.
In neoclassical economics, markets are considered "perfect" and the consumer is perceived as a rational utility-maximizer. The focus is on the most efficient and cost-effective allocation of resources and factor endowments and their optimal growth over time for the production of goods and services (Todaro and Smith, 2009). However, development economics has a more extensive scope. It also deals with the innovation systems (the economic, social, political, and institutional mechanisms) necessary to bring about rapid and large-scale improvements for developing countries (Todaro and Smith, 2009). In this context, market imperfections and limited consumer rationality are widespread and common, leaving the neoclassical assumption invalid, while disequilibria often prevail in the economy, emphasizing the importance of public-private collaborations.
2.3.Systems of Innovation
A system that fosters and nurtures innovation facilitates the flow of technology and information among
people, enterprises and institutions that enables an innovative process. It contains the interaction
between the actors who are needed in order to turn an idea into a process, product or service on the market. Charles Edquist defines a system of innovation as "all important economic, social, political,
organizational, and other
factors
that influence the development, diffusion, and use of innovation"
(Edquist and Johnson, 1997). He observes that while systems of innovation capture the importance of
the political and social aspects of innovative processes, they should also capture the role of the state,
including its physical institutions and the system of laws, rules, and infrastructure (Edquist, 2005).
Innovation is
"seen
as a continuous cumulative process involving not only radical and incremental
innovation but also the diffusion, absorption and use of innovation" (Johnson et al, 2003). According to
Richard Nelson and Nathan Rosenberg, the term "innovation" is the processes by which firms master
and practice product designs and manufacturing processes that are new to them, if not to the universe
or even to the nation (Nelson, 1993). In defining innovation as such, Nelson and Rosenberg reason that
first, the activities and investments associated with becoming the leader in the introduction of a new
product or process, and those associated with staying near the head of the pack, or catching up, are
much less sharply distinguishable than is commonly presumed. Moreover, the strictly Schumpeterian
innovator, the first mover, is frequently not the firm that ultimately captures most of the economic
rents associated with the innovation (Todaro and Smith, 2009/Ashford and Hall, 2011). Second, much of
the interest in innovative capability is tied to concern about economic performance. The definition is not
limited to the behavior of firms at the forefront of world's technology, or to institutions doing the most advanced scientific research, but is more broadly on the factors influencing national technological capabilities.
The concept of "system" in this context is a set of institutions whose interactions determine the
innovative performance of firms or entrepreneurial entities. There is no presumption that the system
was consciously designed, or even that the set of institutions involved works together smoothly and
coherently. Rather, the "system" concept is that of a set of institutions that, together, play the major
role in influencing innovative performance.
The development stories of China and India serve as appropriate examples for applicable experiences
and lessons for LDCs. China and India are generally regarded "success" stories of the developing world in
terms of both domestic development and as a result of globalization. The Chinese economy has grown
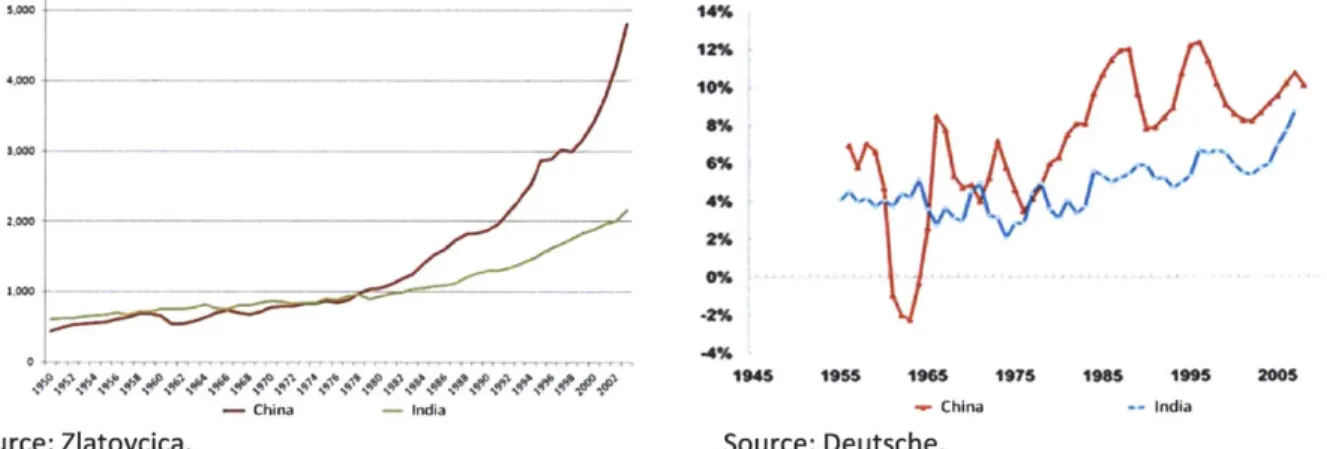
at an average annual rate of 9.8% for two and a half decades, while India's economy has grown at around 5-6% per year over the same period (see Figures 2.1 and 2.2).
s o0o 14% 12% 3.000. -4% -2% "194 1955 1965 1975 1985 1995 2005
- China - India - China - India
Source: Zlatovcica. Source: Deutsche.
Figure 2.1: GDP of China and India ; Figure 2.2: GDP growth rates of China and India (5 yr moving average) This success has been defined by the high and sustained rates of growth of aggregate and per capita national income, and the substantial reduction in income poverty. Furthermore, they both are seen as heralding a major shift in the international division of labor through changes in their own output and employment patterns; China is typically described as becoming the "workshop" or "factory" of the world through the expansion of manufacturing production, and India as becoming the "office" of the world, in particular because of its ability to take advantage of IT-enabled services remotely (Ghosh, 2010). These results, in turn, are viewed as the consequences of a combination of a prudent yet extensive program of global participation and integration, domestic deregulation and sound macroeconomic management. Although there are superficial attributes in common, such as large populations covering substantial geographical areas, regional diversity, relatively high rates of growth over the recent period, etc., the institutional conditions and experiences in the two countries were very different. The presumed success of these two countries can be used to indicate the potential benefits that other developing countries, and especially LDCs, can reap. However, in order to understand how these two countries created systems of innovation to enable development and growth, it is essential to detail how technological advance occurs, and the key institutions and policies involved.
2.3.1. Technology
Technological change is a broad term that encompasses invention, innovation, diffusion, and technology transfer. Innovation is the first commercially successful application of a new technical idea. It should be distinguished from invention, which is the development of a new technical idea, and from diffusion, which is the subsequent widespread adoption of an innovation beyond those who developed it (Ashford and Hall, 2011).
In most industrialized states, R&D facilities attached to business firms, academic institutions, or
government agencies, are the principal vehicles through which technological advance proceeds, in fields such as electrical equipment and systems, chemical products and processes. On the other hand, in developing countries, such institutions do not exist, are not as advanced, or do not receive sufficient capital and resources to facilitate leading edge innovation. Much of the innovative process is carried
through technology transfer from other regions, as well as some cases through both bottom-up/grass-roots and top-down/institutional collaborations.
2.3.1.1. China and India
Since the economic reforms of 1979, China enjoyed high economic growth for three decades. However, this growth has been driven mainly by export-oriented and labor-intensive manufacturing activities. A crucial feature of this growth was agrarian transformation. In 2008, the total value of China's export accounted for over 30% of its GDP, with millions of its citizens employed in the export sector (The Economist, 2008). The recent growth is associated with an increase in the share of the manufacturing sector in both output and employment (Ghosh, 2010). As a result, the Chinese economy is becoming increasingly vulnerable to external shocks such as the 2008 U.S. sub-prime credit crisis, the resulting recession and subsequent decline in demand for Chinese exports.
After India's own independence, the economic development strategy was mostly institution- and policy-based, as opposed to technological innovation, consisting of direct participation of the government in economic activities such as the production, selling and regulation of private sector economic activities through a complex system of controls. The strategy was based primarily on the Mahalanobis model, which gave preference to the investment goods industries sector, with secondary priority for the services and household goods sector (Lai and Clement, 2005). The model placed a strong emphasis on mining, manufacturing and infrastructural development (including electricity generation and
transportation). It downplayed the role of the factory goods sector because it was more capital-intensive and would not address the problem of high unemployment in India. Any increase in planned investments in India required a higher level of savings than that which existed. Because of the low average incomes, the necessary higher levels of savings had to be generated mainly by restrictions on the growth of consumption expenditures. Therefore, the Indian government implemented a progressive tax system not only to generate the higher levels of savings but also to restrict increases in income and wealth inequalities.
To sustain future economic growth, China's policy makers are trying to increase the role of technology and innovation in the country's development, demonstrated by the country's "Medium-to-Long Term Plan of National Science and Technology Development (2006-2020)" (The State Council). Studies have also shown a positive correlation between the growth in technology investment and the overall development and growth of the country. Kraemer and Dedrick performed a study of 43 countries including China from 1985-1995 and found that there was an exceptionally high correlation between growth in Information Technology (IT) investment and GDP growth (Kraemer and Dedrick, 1999). China's IT investment and GDP grew annually at 35% and 10% on average, respectively, with empirical findings of factor inputs to China's economic growth during that period, suggesting IT capital contributed to about 30% of the nation's growth rate (Wong).
Similarly, India's IT industry currently accounts for 5.19% of the country's GDP and export earnings, as of
2009 (Y-Axis). More than 2.3 million people are employed in the sector either directly or indirectly,
making it one of the biggest job creators in India and critical for the national economy. In 2010, annual revenues from outsourcing operations in India amounted to USD $54.33 billion compared to China with
USD $35.76 billion (The Economic Times, 2010). India's outsourcing industry is expected to increase to USD $225 billion by 2020. Technological advance for these two "success" cases are clearly essential for
2.3.2. Institutions
The rise of science-based technology dramatically influenced the nature of the people and institutions involved in technical advance. Universities and academic institutions, in most countries, are the places where much of the basic research in fundamental sciences is undertaken, although the reliance on universities as a locus of basic research, as contrasted with national laboratories, varies across countries. The character and effectiveness of a nation's system of schooling, training, and retraining not only determine the supply of skills from engineer to machine operator, but also influence the perceptions of technical advance.
Industrial research laboratories eventually became the dominant locus of the R&D phase of innovation in most fields. After a technology has been around for a period of time, to orient R&D fruitfully, detailed knowledge of its strengths and weaknesses and areas where improvements would yield large returns is needed. And this knowledge tends to reside with the technology users, generally firms, their customers and suppliers (Ashford and Hall, 2011). Profiting from innovation in many cases requires the integration of activity and planning of R&D, production, and marketing.
Many firms also engage in significant design and development work, yet some do not have a formally designated R&D department or facility; their design and development work may or may not be accounted and reported as R&D. The lines between R&D, and other activities, such as designing products for particular customers, problem solving on production processes, or monitoring a competitor's new products, are inherently blurry.
In LDCs (as well as many developing countries), what is an innovation for an indigenous firm may largely involve learning to produce a product or adapt technology that has been employed for some time by firms in industrialized economies. The development process in LDCs is largely about structural change, where an economy self-discovers what it can excel at by adapting or innovating based on the many
products and processes that already exist, as Rodrik characterizes (Rodrik, 2007). If self-discovery externalities or coordination is at the root of stagnation, the solution is to internalize them through government programs or private sector coordination.
The important interactions, the networks, are not the same in all industries or technologies. There are differences between system technologies and product technologies with respect to inter-industry interactions. In some technologies, universities play a key role (i.e. pharmaceuticals and computers). In others, industrial facilities play a more significant role (i.e. aircraft and steel). Government funding is important in some industries, such as aircraft and agriculture, and unimportant in others. While the shape and character differ, virtually all fields require an understanding of technical advance as proceeding through the work of a community of actors. Moreover, R&D usually is only a small part of the resources and problem solving that go into innovation. The capital that must be invested in new equipment and facilities to produce a new product, or embody a new process, generally exceed the R&D costs in magnitude. New organizations may be born, or a different division of labor, or new skills on the part of the work force, as well as new approaches in marketing (Ashford and Hall, 2011).
2.3.2.1. China and India
In China, the significance of state-owned enterprises and the township and village enterprises (TVEs) in total production freed the state's dependence on fiscal policy to influence aggregate demand in terms of purely budgetary measures, since many "off-budget" expenditures could be increased or reduced (Ghosh, 2010).
Private businesses were banned during the Mao Era for being "capitalist exploiters," but were reinstated in the Deng Era and underwent a period of liberalization and privatization. Citizens could opt to become self-employed households and set up businesses instead of taking on state jobs. They would often quickly become extremely wealthy. In the 1990s, many state-owned enterprises (SOEs) were also privatized, fueled by then Premier Zhu Rongji in an effort to prevent them from losing money. In 1997, the Communist Party declared that state-owned companies were "people-owned companies" and private individuals were allowed to create companies who would be subject to mergers and bankruptcy. Thousands of state companies were privatized or partly floated on the stock exchange. In 1978, more than 90% of GDP was produced in state enterprises, which, up to 1992, dominated China's economy. The Chengbao system, or contracting system, during this period, where state assets were given to private operators, provided the state with necessary funding for expenses as well as a share of the profits (China International Contractors Association). This system was rapidly adopted in other sectors. In the 1980s and 1990s, many schools, hospitals and transport vehicles passed from the state to private operators. However, the Chengbao system was also criticized because felt that the change in operation for these schools and hospitals, now for-profit, was detrimental to the poor. Some private contractors were also accused of gaining their positions solely because of nepotism.
The control over the domestic economy in China has been most significant in the financial sector. The financial system in China still remains heavily under the control of the state, despite the recent
liberalization and the sale of some shares to foreign investors. Four major public sector banks handle the bulk of transactions in the economy, and over the past several decades, the Chinese authorities have used control over the consequent financial flows to regulate the volume of credit (and thus manage the economic cycle) as well as direct credit to priority sectors. In addition, fundraising from firms (or off-budget official finance) has accounted for more than half the capital formation in China even in recent years. This, along with direct budgetary appropriations, has determined nearly two thirds of aggregate investment (Ghosh, 2010).
Monetary policy had minimal affects in China where private financial activity was limited and state-owned banks overwhelmingly dominated the provision of credit. Instead, macroeconomic adjustment were mostly administrative, such as moving to slow down an overheating economy through tightened credit provisions to regional and provincial governments and public and private corporations ensured through administrative fiat, rather than the use of traditional macroeconomic measures. While the Chinese economy is currently transitioning to one where more traditional macroeconomics is applicable, the Chinese government's continuing ability to quickly ensure macroeconomic correction when required is evidence of the limitations of this transition.
India also created a large number of government institutions to meet its growth objectives. Its
development involved strategies to best utilize resources. In India's case, it meant transferring savings from the private to the public sector. Investments were carried out both by the government and the private sector, with the government investing in strategic sectors (such as national defense) and sectors in which private capital would not be available because of lags or the amount of investment required (such as infrastructure). The private sector was required to contribute to India's economic growth as set
by the government planners. Not only did the government determine where businesses could invest in
terms of location, but it also identified what businesses could produce, sell, and prices to set (Lai and Clement, 2005). The size of the government grew substantially as it played an increasingly larger role in the economy in such areas as investment, production, retailing, and regulation of the private sector. For example, in the late 1950s and 1960s, the government established public sector enterprises in areas
such as electricity production and distribution, petroleum, steel, coal, and engineering goods. In the late 1960s, it nationalized the banking and insurance sectors. To alleviate the shortages of food and other agricultural outputs, it provided modern agricultural inputs (i.e. farm machinery, irrigation, high yielding varieties of seeds, chemical fertilizers) to farmers at highly subsidized prices (World Bank, 2001).
Afterwards, India designated exports as a priority sector for active government help and many institutions including a duty drawback system, programs of assistance for market development, and
100% export-oriented entities to help producers export and to increase foreign exchange earnings
(Government of India, 1984). From the late 1970s through the mid-1980s, India liberalized imports, growing those not subject to licensing as a proportion to total imports from 5% in 1980-1981 to 30% in
1987-1988 (Pursell, 1992). However, this partial removal of quantitative restrictions was accompanied by a steep rise in tariff rates.
This active and dominant participation by the government in economic activities resulted in the creation of a protected, highly-regulated, public sector-dominated economic environment. India soon faced not only some major problems in its overall approach to development, particularly in the area of
industrialization, but also a dramatic increase in corruption in its economy (Ahluwalia, 1985). Finally, like any other developing economy, the Indian economy faced a number of serious sectoral imbalances, with shortages in some sectors and surpluses in others.
2.3.3. Policy
The policies and programs of national governments, the laws of a nation, legal institutions and the existence of a common language and a shared culture contribute to a system that broadly affects how technical advance proceeds. In other words, national societies, cultures, differences and boundaries tend to define innovation systems. The concept of innovation systems encompasses the determinants of
innovation and hence provides an enticing framework for policy analysis and design (Nelson and Rosenberg, 1993).
Technological communities have become transnational more than ever. For example, there has been a strong trend for manufacturing business firms to span national boundaries. The globalization of business and technology erodes the extent to which national borders, and citizenship, define boundaries that are
meaningful in analyzing technological capabilities and technical advance.
There is a tension caused by the attempts of national governments to form and implement national technology policies, in a world where business and technology are increasingly transnational. Thus, the innovation process is embedded within an innovation system involving both institutional actors and individuals within and outside firms and even countries themselves. Johnson et al. observed that there are three common themes with innovation systems (Johnson, 2003):
1. National systems differ in terms of specialization in production, trade and knowledge (Archibugi
and Pianta). The focus is here upon the co-evolution between what countries do and what people and firms in these countries know how to do well. Both the production structure and the knowledge structure will change gradually through a co-evolution between what countries do and what people and firms in these countries know, and that such change involves learning as well as structural change.
2. Elements of knowledge important for economic performance are localized and not easily moved from one place to another. Important elements of knowledge, called tacit knowledge, are
embodied in the minds and bodies of agents, in routines of firms and not least in relationships between people and organizations (Dosi, 1999).
3. Relationships may be seen as carriers of knowledge and interaction as processes where new
knowledge is acquired and produced. Neither firms and knowledge institutions nor people alone innovate.
The approach emphasizes interdependence and non-linearity. This is based on the understanding that firms normally do not innovate in isolation but interact more or less closely with other organizations, through complex relations that are often characterized by reciprocity and feedback mechanisms in several loops. This interaction occurs in the context of institutions, as mentioned in section 2.3.2, and policies (i.e. laws, rules, regulations, norms and cultural habits) in an ecosystem of players such as government, regulators, education and training institutions, customers, technology transfer and diffusion agencies, firms, and financial services. This is useful to understand the ecosystem of mobile telephony technology, which will be expanded upon in Chapter 4 in the context of SSA. There are mobile network operators, handset equipment manufacturers, application developers, and end users.
2.3.3.1. China and India
Since 1979, China embarked on comprehensive land reforms that dramatically altered asset distribution in the country and changed the political economic landscape that determined subsequent policies. While land relations have undergone numerous changes since then, from collectivization to more reliance on independent small holder peasants, the dominance of landlordism was eliminated and greater equality of access to land and other assets also affected the conditions of access to other forms of wealth and avenues for economic and social mobility. The economic policies of China had very different results than they would have had in a more economically unequal context.
In terms of economic diversification and structural change, China focused more on manufacturing activities over the past 25 years. The manufacturing sector doubled its share of the workforce and tripled its share of output, which, given the size of the Chinese economy and population, has
increasingly made China "the workshop of the world" (Ghosh, 2010).
For trade policies, Chinese export growth was much more rapid, involving aggressive increases in world market shares. This export growth was largely based on relocative capital which was attracted not only
by cheap labor, but also by heavily subsidized infrastructure, resulting from a high rate of infrastructure
investment. In addition, the Chinese state provision of basic goods (housing, food, and cheap transport facilities) for registered urban dwellers played an important role in reducing labor costs for employers. Until the late 1990s, this rapid export growth generated employment which constituted a net addition to domestic employment. Until its WTO accession, China had undertaken much less trade liberalization than most other developing countries. Thus, manufacturing employment grew rapidly in China until the
mid-1990s, because it was not counterbalanced by major losses of employment due to the effects of displacement of domestic industry because of import competition.
Ultimately, China's growth performance is primarily a reflection of the high investment rates that have characterized the economy over this period. During the period of liberalization, Deng established a series of economic zones in which foreigners could invest in the country and take advantage of lower labor costs. This investment helped the Chinese economy boom. In addition, the Chinese government established a series of joint ventures with foreign capital to establish companies in industries unfamiliar in China at the time. By 2001, China became a member of the WTO, which boosted its overall trade in exports/imports-estimated at USD $851 billion in 2003 by an additional USD $170 billion a year (Donald