HAL Id: inserm-00750958
https://www.hal.inserm.fr/inserm-00750958
Submitted on 12 Nov 2012
HAL is a multi-disciplinary open access
archive for the deposit and dissemination of sci-entific research documents, whether they are pub-lished or not. The documents may come from teaching and research institutions in France or abroad, or from public or private research centers.
L’archive ouverte pluridisciplinaire HAL, est destinée au dépôt et à la diffusion de documents scientifiques de niveau recherche, publiés ou non, émanant des établissements d’enseignement et de recherche français ou étrangers, des laboratoires publics ou privés.
Comparison between two treatment planning systems
for volumetric modulated arc therapy optimization for
prostate cancer.
Caroline Lafond, Frédéric Gassa, Christophe Odin, Gaël Dréan, Justine Even,
Renaud de Crevoisier, Pascal Pommier, Jean-Pierre Manens, Marie-Claude
Biston
To cite this version:
Caroline Lafond, Frédéric Gassa, Christophe Odin, Gaël Dréan, Justine Even, et al.. Compari-son between two treatment planning systems for volumetric modulated arc therapy optimization for prostate cancer.: VMAT with Monaco versus Pinnacle. Physica Medica, Elsevier, 2012, 30 (1), pp.2-9. �10.1016/j.ejmp.2012.10.003�. �inserm-00750958�
Comparison between two treatment planning systems for volumetric modulated arc
therapy optimization for prostate cancer
Caroline Lafond a,b,c,*, Frédéric Gassa d, Christophe Odin e, Gaël Dréan b,c, Justine Even a, Renaud De Crevoisier a, b ,c, Pascal Pommier d, Jean-Pierre Manens a,b,c, Marie-Claude Biston d
a
Radiation Oncology Department, Centre Eugène Marquis, Rennes, France
b
LTSI, France
c
INSERM, U1099, France
d
Radiation Oncology Department, Centre Léon Bérard, Lyon, France
e
Institut of Physics of Rennes IPR/UMR CNRS 6251, University of Rennes I, Rennes, France
Running title: VMAT with Monaco versus Pinnacle
* Corresponding author: C Lafond, Centre Eugène Marquis, Rue de la bataille Flandres Dunkerque, CS44229, 35042 Rennes Cedex, France; Tel: (+33) 2 99 25 31 27; Email: c.lafond@rennes.unicancer.fr
ABSTRACT
Purpose: To investigate the performances of two commercial treatment planning systems (TPS)
for Volumetric Modulated Arc Therapy (VMAT) optimization regarding prostate cancer. The TPS were compared in terms of dose distributions, treatment delivery parameters and quality control results.
Materials and Methods: For ten patients, two VMAT plans were generated: one with Monaco
TPS (Elekta) and one with Pinnacle TPS (Philips Medical Systems). The total prescribed dose was 78 Gy delivered in one 360° arc with a Synergy® linear accelerator equipped with a MLCi2®.
Results: VMAT with Monaco provided better homogeneity and conformity indexes but lower
mean dose to PTVs than Pinnacle. For the bladder wall (p=0.019), the femoral heads (p=0.017), and healthy tissues (p=0.005), significantly lower mean doses were found using Monaco. For the rectal wall, VMAT with Pinnacle provided a significantly (p=0.047) lower mean dose, and lower dose into 50% of the volume (p=0.047) compared to Monaco. Despite a greater number of monitor units (factor 1.5) for Monaco TPS, the total treatment time was equivalent to that of Pinnacle. The treatment delivery parameter analysis showed larger mean MLC area for Pinnacle and lower mean dose rate compared to Monaco. The quality control results gave a high passing rate (> 97.4%) for the gamma index for both TPS but Monaco provided slightly better results.
Conclusion: For prostate cancer patients, VMAT treatment plans obtained with Monaco and
Pinnacle offered clinically acceptable dose distributions. Further investigations are in progress to confirm the performances of the two TPS for irradiating more complex volumes.
INTRODUCTION
Volumetric modulated arc therapy (VMAT) is a new radiotherapy technique which allows to achieve treatment plans of similar or improved quality compared to fixed-field intensity-modulated radiation therapy (IMRT) while reducing the treatment time per fraction [1]. In practice, to obtain highly modulated dose distributions delivered efficiently, a treatment planning system (TPS) with a powerful optimization and segmentation algorithm is required.
While a lot of users are in the process of replacing fixed-field IMRT by VMAT, or directly implementing VMAT in their radiotherapy department, there is a lack of information concerning the relative performances of the mainly used TPS for VMAT planning. To our knowledge, only three studies deal with this topic [2-4]. In Rao et al, ERGO++ (Elekta, Crawley, UK) was compared to Pinnacle (Philips Medical Systems, Madison, WI) direct machine parameter optimization (DMPO) combined with a home-made arc-sequencer and Pinnacle SmartArc inverse planning module [2]. In Masi et al, the performances of Monaco (CMS-Elekta, Crawley, UK) were compared to ERGO++ and Oncentra (Nucletron-Elekta) [3]. Finally, in Wiezorek et al, VMAT plans obtained with Monaco and Eclipse (Varian Medical System, Palo Alto, CA) were evaluated [4]. In these studies, the comparisons were made by fixing common planning objectives on PTVs and OARs and comparing the dosimetric results and treatment delivery efficiency (number of monitor units and treatment time).
The aim of the present study was to investigate the performances of two TPS that have not been compared yet in VMAT mode, both using different approaches for VMAT plan optimization: Monaco based on a two-stage constrained optimization [5] and Pinnacle SmartArc [6]. This work was performed by two institutions. The aim was to compare VMAT plans performed by Monaco and Pinnacle regarding to dosimetric performances and treatment delivery specificities. We therefore fully put in evidence the differences observed in terms of dose distributions, delivery
efficiency, treatment delivery parameters (mean dose rate, mean segment area) and quality control results on 10 prostate cancer cases.
MATERIALS AND METHODS
Patients
Ten prostate adenocarcinoma patients referred to our institutions for a radical external beam irradiation to the prostate and seminal vesicles (SV) were considered for this dosimetric comparative analysis.
Anatomic data acquisition, volumes definition and dose
Organs at risk [rectal wall (5 mm thickness), bladder wall (7 mm thickness), femoral heads (FH)] and target volumes (prostate, SV) were delineated on dedicated 2 mm-thick CT slices.
The first clinical target volume (CTV1) comprised the prostate and SV. The CTV2 was limited to the prostate only. Planning target volumes (PTVs) were automatically generated adding a 3D 1 cm uniform margin around the CTVs, except in the posterior direction, where a 0.5 cm margin was added to protect the rectum.
The total prescription dose was 46 Gy to the PTV1 and an additional 32 Gy to the PTV2 using a standard fractionation (2 Gy per fraction, 5 days a week) for a total dose of 78 Gy using a sequential technique.
A dose objectives set was fixed for PTVs and OARs : for PTV1 : 95% of the PTV covered by 97% of the prescribed dose, and less than 5 % of the PTV receiving more than 107% of the prescribed dose; PTV2: 95% of the PTV covered by 95% of the prescribed dose; Rectum: maximum dose (into 1.8 cc) < 76 Gy, V72 1 25% , V60 1 50% ; Bladder V70 1 25%, V60 1 50%; Femoral heads: V50 1 5%.
Treatment planning
For each patient, two VMAT plans were generated: one with Monaco 3.0 (CMS-Elekta Ltd, Crawley, UK) and one with Pinnacle 9.0 (Philips Medical Systems, Madison, WI).
The irradiation was delivered, using 6-MV photons with an Elekta Synergy® machine equipped with a Cone-Beam Computed Tomography (CBCT) device (XVI®) and with a multi-leaf collimator (MLCi2®) consisting of 40 paired leaves, each measuring 1 cm in width at the isocenter. The possible dose rate values were 25 MUs/min, 50 MUs/min, 100 MUs/min, 200 MUs/min and 400 MUs/min. For each treatment plan a single 360° arc was used.
MONACO PLANNING
For Monaco planning, the optimization constraints were established on the basis of biological cost functions (i.e. Serial or parallel complication model for OARs and Poisson cell kill function for the PTVs). The prescription template applied to all patients is given in Table 1. The optimisation was first performed in a constrained mode, meaning that all constraints to the OARs are treated as hard constraints and all optimization criteria must be met. Conversely, the constraints to the targets are considered as objectives. The pareto mode which gives priority to PTV coverage was used secondarily to achieve the PTV coverage detailed above.
Sequencing parameters used for PTV1 and PTV2 irradiation were: 124 control points (CP) to achieve in practice 120 CP; target dose rate 300 MUs/min; minimum segment width 0.5 cm; fluence smoothing: low.
For final Monte Carlo dose calculations, a calculation grid of 3 mm and a 3 % variance were used. With these parameters, the time needed for final dose calculation was about 10 min on an Intel Xeon CPU 3 GHz and 12 GB RAM platform. The time for optimisation stage and adjusting the prescription parameters was about 20 min.
For Pinnacle planning, inverse optimization was performed using the SmartArc algorithm (6). The optimization objectives were defined with physical dose points. The template is shown in Table 1. The arc sampling parameter was fixed at 3 degrees to obtain 120 CP for the full arc. The delivery time parameter was fixed at 180 s firstly; then was eventually increased to 240 s to allow more dose modulation for the most complex cases. Final dose was computed with a collapsed cone algorithm using a dose grid resolution of 3 mm. With these parameters, the time needed for optimization and final dose calculation was about 13 min on an Intel quadruple-Core (Xeon) 2.8 GHz and 16 GB RAM platform. Time for parameters adjustment was 10 min.
Preliminary work
Although this study was performed by two institutions, an important number of constraints were set to limit the influence of the planners and planning philosophy of the two hospitals. First, a preliminary comparison study was performed on a water-equivalent cylindrical phantom with a C-Shape target surrounding a central avoidance structure (data not shown) as described by the AAPM task group 119 [7]. This preliminary work allowed to harmonize both planning methods and to verify that for a simple geometry both institutions were able to produce plans of similar quality regarding dose distribution and delivery efficiency.
Treatment plans comparisons
DOSE DISTRIBUTION
In order to limit the uncertainties on DVHs calculations between both TPS, the results were evaluated in the ARTiView 1.12 software (Aquilab, Lille, France) by comparing DVHs for targets and OARs (mean dose and doses at selected points of the DHVs). Patient-averaged DVHs were compared. In addition, several quality indexes for PTV1 and total plans were assessed: homogeneity index (HI) was calculated as (D5% - D95%)/Dmean within the PTV; D5% and D95%
the ratio between the volume of the reference isodose (V95%) and the PTV volume (VPTV)
[V95%/VPTV] [9]; healthy tissue coverage index (HCO) evaluates the percentage of reference
isodose which is outside the PTV volume. HCO was calculated as [100*(1-(VPTV, 95%/V95%))]; V PTV, 95% was the volume of PTV covered by the reference isodose.
Statistical analysis used two-sided Wilcoxon-signed rank test, a nonparametric test, calculated with PASW Version 18.0.0 (SPSS Inc., Chicago, IL). A value of p<0.05 was considered statistically significant.
To underscore the spatial localization differences between the two TPS, a patient-averaged dose distribution was performed. To obtain the averaged dose distribution, the anatomy of all the patients was registered to a typical patient anatomy. After an initialization done by an affine registration, we used an organ-driven non-rigid registration method using the demons algorithm between the CTs and between each considered organ (prostate, bladder, rectum). The final deformation field was computed by merging the different deformation fields by weighting them according to the distance between voxels and organs [10-12]. The transformation was then applied to the dose distribution.
ROBUSTNESS
In case of daily CBCT, we assume to have a geometric accuracy better than 2 mm as mentioned in the AAPM recommendations [13]. To investigate the robustness of Monaco and Pinnacle dose distributions, an isocenter shift of 2 mm was applied on one representative prostate case in unfavorable directions for the main OARs (i.e. in anterior and posterior direction). The impact on dose distribution was judged with the quality indexes described previously for PTV2, rectum wall and bladder wall.
DELIVERY EFFICIENCY
The delivery time, MU per fraction, mean dose rate and time-average MLC aperture area were used to evaluate the VMAT delivery efficiency.
Quality assurance
In order to evaluate the dose algorithm accuracy of Monaco and Pinnacle, the consistency between calculated and delivered dose was verified for one typical plan with EBT3 radiochromic films (Ashland, Covington, USA) in a pelvis anthropomorphic phantom (CIRS, Norfolk, USA). A dosimetric validation was then performed for all plans with the Octavius phantom (PTW, Freiburg, Germany). The dose delivery was measured using the PTW 2D-array Seven29 (PTW) ionization chamber matrix. The dose was measured in coronal and sagittal planes.
Comparisons were performed with Verisoft software (PTW). The 3D gamma method was used to compare the measured dose distributions with the calculated 3D dose distribution. The dose criterion was 3% of the local dose and the distance criterion was 3 mm. The evaluated areas were areas with doses higher than 30% of the maximum dose.
RESULTS
Dose distribution
The patient-averaged differences in the dose distributions for the two TPS are shown in Figure 1. Large differences are observed. First, Monaco favoured the dose delivery on gantry angles that allowed crossing a minimum volume of healthy tissue to reach the PTV. Therefore, the volume of healthy tissue receiving higher doses was more important with Pinnacle than with Monaco. Furthermore, we observed that Pinnacle solutions result in more dose delivered on the left-right direction (i.e. around the FH), whereas Monaco solutions result in more doses delivered on the antero-posterior direction (i.e. around the bladder and the rectum).
The averaged dose-volume histograms (DVHs) of total plans are shown in Figure 2. The continuous lines represent the mean values and are surrounded by two dashed curves representing the 2.5th percentiles of the data for the lower dashed curves and the 97.5th percentiles for the upper dashed curves. DVHs data for PTVs and OARs and conformal indexes are reported in Table 2 as averages for the investigated patients. Figure 2 shows that Pinnacle plans resulted in more dose into the PTVs than Monaco but with a more important scattering. While the mean dose to PTV1 was significantly different between both modalities (p=0.008), the difference was not statistically significant on PTV2 (p=0.241) (Table 2).
Furthermore, Monaco plans had higher conformality with significantly better CI and HCO at the expense of significantly lower dose homogeneity into the PTV than Pinnacle. Regarding the dose distribution to the OARs, Monaco provided a significantly lower mean dose to the bladder wall (p=0.019), to the FH (p=0.017) and to the healthy tissue (p=0.005) while Pinnacle provided a significantly lower mean dose (p=0.047) and a lower D50% value (p=0.047) for the rectal wall
Robustness
Details of dose with and without isocentre shift for the main organs are shown Table 3. For the rectal wall, the 2-mm posterior shift resulted in an increase of the Dmax of 1.3 Gy for both TPS,
and an increase of the Dmean of 1.9 and 1.7 Gy for Monaco and Pinnacle plans, respectively. The
D95% to PTV2 was the same for Monaco plans and resulted in an increase of 0.3 Gy for Pinnacle
plans. For the bladder wall, the 2-mm anterior shift resulted in an increase of the Dmax of 0.3 Gy
and 0.2 Gy and an increase of the Dmean of 0.8 and 0.7 Gy, for Monaco and Pinnacle plans,
respectively. The D95% to PTV2 was decreased of 0.7 and 1.3 Gy for Monaco and Pinnacle plans,
respectively.
Treatment delivery evaluation
Details of efficiency parameters are shown in Table 4; Figure 3 shows the variations of MLC aperture area and dose rate as a function of gantry angle during typical VMAT delivery. Monaco plans needed one and a half more MUs than Pinnacle plans. Nevertheless we noticed similar delivery times because the time-averaged dose rates were higher with Monaco (230 MUs/min) than with Pinnacle (160 MUs/min).
The better efficiency of Pinnacle plans was due to a larger MLC aperture area (Fig. 3, Table 4). On average, total MUs to MLC aperture area ratio was 265 MUs/cm² for Monaco plans and 110 MUs/cm² for Pinnacle plans.
The variation of the area according to the gantry angle (Fig. 3) shows that the segmentation is based on an alternative Sliding Window pattern for Monaco VMAT (i.e. all the leaves moves first on one way and then on the other way alternatively for the full arc) .
The analysis of the films placed inside an anthropomorphic phantom showed that 99.1% and 98.4% of the points passed the 3%/3 mm criterion with mean gamma values of 0.34 and 0.31 for Monaco and Pinnacle respectively. Central area encompassing the PTV showed high consistency between calculated and delivered dose for Pinnacle and Monaco; the mean gamma values were 0.29 for both TPS.
The results obtained with the 2D matrix ionisation chamber showed a high passing rate (> 97.4%) for the gamma index for both TPS (Table 4). Nevertheless, Monaco provided better dosimetric agreement than Pinnacle. To explain the QA results differences, we investigated the dose-gradient values [14] in the two measurement plans of the Octavius phantom (Table 4). For coronal planes, mean dose-gradients were similar for both TPS but maximum dose-gradient was higher with Pinnacle. For sagittal planes, all reported dose-gradient values were higher with Pinnacle.
DISCUSSION
The aim of the present study was to investigate the performances of Monaco and Pinnacle TPS for VMAT plan optimization. To our knowledge, this is the first study yielding a global comparison of two TPS for VMAT planning, from the prescription phase and dose distribution evaluation to the delivery efficiency. We also included beam geometry, treatment delivery parameters and quality control results.
For prostate cancer, VMAT solutions proposed by both TPS offered good PTV coverage and OARs sparing, with similar delivery time. Note that the lowest doses to the OARs were achieved with Monaco, except for the rectal wall. Regarding dose distribution and delivery parameters large differences were observed. First on dose distribution, we noticed that Monaco favoured the dose delivery from gantry angles that allowed crossing a minimum volume of healthy tissue to reach the PTV. As a consequence, much lower doses were delivered to the FH in comparison with Pinnacle, despite the fact that contrarily to Pinnacle, no constraint was assigned to the FH on Monaco prescription. Likewise, healthy tissue contained in the CT area received less dose with Monaco than with Pinnacle. However, this result must be taken with care since the uncertainties in TPS dose calculation are generally larger in the lower dose regions. Indeed, the uncertainty in Monte Carlo calculation is influenced by the variance reduction techniques and inversely proportional to the square root of the number of histories used for dose calculation. The uncertainty of the entire plan is always less than the variance value for dose calculation since that value is per segment (i.e. 3 % in our case, for Monaco TPS). Therefore the noise which can be observed is substantially reduced in high dose area where a more important number of segments contribute to the dose (superposition effect) [15] .
Furthermore, it is well known that the main part of out-of-field doses are due to the linac-head scatter and leakage radiation, proportional to MUs [16;17]. In this case Monaco could provide a
higher out-of-field dose. Hence, both TPS provide different irradiation patterns regarding low doses without superiority of one TPS was clearly demonstrated.
Finally, higher doses were delivered in the antero-posterior direction, above the bladder or below the rectum with Monaco compared to Pinnacle. Therefore, with Monaco TPS, an anatomical deformation of the rectum or bladder will probably have more consequences on the delivered dose to these organs. In particular, it has been shown that the relative volume of the rectum can vary by more than 150% from one day to another [18]. Thus in this case, the risk of rectal toxicity is increased and it is of importance to make a daily imaging control. The robustness investigation of dose distributions showed that the impact of 2 mm isocentre shifts provided very low and similar dose deviations for Monaco and Pinnacle plans : Table 3 showed that the dose deviations were always less than 5% of the prescribed dose and the dose deviations differences were less than 1% of the prescribed dose between the both TPS. Therefore both TPS provided robust plans.
To conclude on this part, most of the differences observed may be closely linked to the objective functions used for optimizing the dose distribution. Whereas on both TPS biological and physical cost functions are available, Monaco planner chose to use biological in combination with physical cost functions while Pinnacle planner used only physical cost functions. In one study IMRT plans performed with Pinnacle and Monaco biological-dose based prescriptions were compared to Pinnacle physical-dose based prescriptions [19]. Biological prescription led to improve OARs sparing compared to physical dose based prescription with a similar performance for Monaco and Pinnacle. Contrarily to Qi et al, another study comparing VMAT plans performed with Pinnacle biological, physical and mixed prescriptions reported that, in some particular cases, the physical prescriptions result in superior treatment plans [20]. Therefore, there is still an open debate on the question of the superiority of the biological against physical cost functions.
In practice, it is possible to get the same results using physical or biological cost functions even though physical cost functions are not as easy to control since one constraint only controls one dose point. Therefore one single biological cost function will always lead to a better dosimetric solution than one single physical cost function, but is this true for one biological cost function against 3 physical cost functions? There will always be a high proportion of subjectivity concerning all the studies performed on this subject since the results highly depend:
1/ on the planner and his degree of experience with either physical or biological cost functions 2/ on how many physical and biological cost functions are used in the prescription
The above papers did not give any details about the prescription templates the authors used to get their results. In the present study, the planners had to use the prescription template that they had found to be best suitable for treating prostate cancer. Monaco planner chose to combine biological and physical cost functions, since from their practices, the best results were obtained with mixed prescriptions, whereas Pinnacle planner preferred physical cost functions, since they did not get better results with biological prescriptions.
Regarding the treatment delivery efficiency, the treatment control system of the Elekta accelerator adjusts the dose rate, the gantry and leaves speeds to offer the lowest delivery time possible for VMAT plans. This adjustment is efficient since despite different numbers of MUs, Monaco and Pinnacle plans were delivered with similar times. We noticed this adjustment particularly with the dose rate variation; Monaco plans were delivered with time–average dose rate 44% higher than Pinnacle plans. Previous studies compared VMAT performed with Monaco or other TPS [3;4]. Similarly to our results they found that Monaco provided more MUs than other TPS.
Concerning QA analysis, many precautions have been taken. First, to limit the impact of the beam-modeling, one set of beam data was used for the commissioning of both TPS [15;21]. Previous QA results showed that TPS commissioning are consistent for Monaco and Pinnacle. We found similar dosimetric agreement for static fields for both TPS: for 3×3 cm² and 20×20 cm² field sizes the mean gamma values were 0.208 and 0.238, and 0.163 and 0.265 in a homogeneous phantom for Monaco and Pinnacle, respectively.
Then to avoid uncertainties with QA implementation, the same operator performed the measurements simultaneously for both TPS on the linear accelerator. Our results demonstrated a high passing rate for VMAT plan QA for both TPS. Nevertheless, Monaco provided better dosimetric agreement than Pinnacle. However, the lowest dosimetric agreement results were obtained for the planes where the highest dose-gradients were observed (i.e. sagittal Pinnacle planes).
In addition to this data , film analysis in an anthropomorphic phantom showed that for both TPS more than 98 % of points passed the (3%, 3 mm) gamma index criterion. Therefore, the dose algorithm accuracy of both TPS was verified in inhomogeneous conditions for pelvis cases thus proving that that there is no advantage to use Monaco at the expense of Pinnacle regarding to dosimetric accuracy for the studied case.
CONCLUSION
For prostate cancer patients, VMAT planned with Monaco and Pinnacle TPS offered clinically acceptable dose distributions. Monaco plans showed enhanced OAR sparing but lower doses into the PTV compared to Pinnacle plans. Similar delivery times were found for both TPS but Pinnacle solution required less MUs. Finally, a good dosimetric agreement with measured doses was achieved with both TPS, but Monaco offered a slightly higher passing rate in the gamma index analysis. Further investigations are in progress to confirm the performances of both TPS on more complex volumes (head and neck cancer or prostate with pelvic node involvement).
Conflicts of interest: Caroline Lafond’ contribution is part of a PhD thesis supported by a grant from Elekta.
Reference List
[1] Otto K. Volumetric modulated arc therapy: IMRT in a single gantry arc. Med Phys 2008;35:310-317.
[2] Rao M, Yang W, Chen F, Sheng K, Ye J, Mehta V, et al. Comparison of Elekta VMAT with helical tomotherapy and fixed field IMRT: plan quality, delivery efficiency and accuracy. Med Phys 2010;37:1350-1359.
[3] Masi L, Casamassima F, Doro R, Menichelli C, Bonucci I, Masciullo S. Comparison of 3 TPS for VMAT Plans Optimization. International Journal of Radiation Oncology, Biology, Physics [78, 3, Supplement], S846. 2010. Ref Type: Generic
[4] Wiezorek T, Brachwitz T, Georg D, Blank E, Fotina I, Habl G, et al. Rotational IMRT techniques compared to fixed gantry IMRT and tomotherapy: multi-institutional planning study for head-and-neck cases. Radiat Oncol 2011;6:20.:20.
[5] Semenenko VA, Reitz B, Day E, Qi XS, Miften M, Li XA. Evaluation of a commercial biologically based IMRT treatment planning system. Med Phys 2008;35:5851-5860. [6] Bzdusek K, Friberger H, Eriksson K, Hardemark B, Robinson D, Kaus M. Development
and evaluation of an efficient approach to volumetric arc therapy planning. Med Phys 2009;36:2328-2339.
[7] Ezzell GA, Burmeister JW, Dogan N, LoSasso TJ, Mechalakos JG, Mihailidis D, et al. IMRT commissioning: multiple institution planning and dosimetry comparisons, a report from AAPM Task Group 119. Med Phys 2009;36:5359-5373.
[8] Claus F, Mijnheer B, Rasch C, Bortfeld T, Fraass B, De GW, et al. Report of a study on IMRT planning strategies for ethmoid sinus cancer. Strahlenther Onkol 2002;178:572-576.
[9] Shaw E, Scott C, Souhami L, Dinapoli R, Bahary JP, Kline R, et al. Radiosurgery for the treatment of previously irradiated recurrent primary brain tumors and brain metastases: initial report of radiation therapy oncology group protocol (90-05). Int J Radiat Oncol Biol Phys 1996;34:647-654.
[10] Thirion JP. Image matching as a diffusion process: an analogy with Maxwell's demons. Med Image Anal 1998;2:243-260.
[11] Drean G, Acosta O, Simon A, de Crevoisier R, Haigron P. Inter-individual organ-driven CT registration for dose mapping in prostate cancer radiotherapy. Proc IEEE Int Symp Biomed Imaging 2012.
[12] Ourselin S, Roche A, Subsol G, Pennec X, Ayache N. Reconstructing a 3D structure from series histological section. Image and Vision Computing 2011;19:25-31.
[13] Bissonnette JP, Balter PA, Dong L, Langen KM, Lovelock DM, Miften M, et al. Quality assurance for image-guided radiation therapy utilizing CT-based technologies: a report of the AAPM TG-179. Med Phys 2012;39:1946-1963.
[14] Moran JM, Radawski J, Fraass BA. A dose gradient analysis tool for IMRT QA. J Appl Clin Med Phys 2005;6:62-73.
[15] Fotina I, Winkler P, Kunzler T, Reiterer J, Simmat I, Georg D. Advanced kernel methods vs. Monte Carlo-based dose calculation for high energy photon beams. Radiother Oncol 2009;93:645-653.
[16] Hall EJ. Intensity-modulated radiation therapy, protons, and the risk of second cancers. Int J Radiat Oncol Biol Phys 2006;65:1-7.
[17] Ruben JD, Davis S, Evans C, Jones P, Gagliardi F, Haynes M, et al. The effect of intensity-modulated radiotherapy on radiation-induced second malignancies. Int J Radiat Oncol Biol Phys 2008;70:1530-1536.
[18] Cazoulat G, Lesaunier M, Simon A, Haigron P, Acosta O, Louvel G, et al. [From image-guided radiotherapy to dose-image-guided radiotherapy.]. Cancer Radiother 2011.
[19] Qi XS, Semenenko VA, Li XA. Improved critical structure sparing with biologically based IMRT optimization. Med Phys 2009;36:1790-1799.
[20] Mihaylov IB, Fatyga M, Bzdusek K, Gardner K, Moros EG. Biological optimization in volumetric modulated arc radiotherapy for prostate carcinoma. Int J Radiat Oncol Biol Phys 2012;82:1292-1298.
[21] Yan G, Fox C, Liu C, Li JG. The extraction of true profiles for TPS commissioning and its impact on IMRT patient-specific QA. Med Phys 2008;35:3661-3670.
Figures and Tables legends:
Figure 1. Patient-averaged dose distribution differences for axial (A), coronal (B) and sagittal (C) views. Data are presented as Pinnacle dose distribution minus Monaco dose distribution: Areas where Pinnacle delivered more dose than Monaco are in red color. Areas where Monaco delivered more dose are in purple color.
Figure 2. Average composite DVHs for VMAT performed either with Monaco (continuous grey lines) or Pinnacle (continuous black lines) for the rectal wall (A), the bladder wall (B), the femoral heads (C), PTV2 (C), healthy tissue (D) and PTV1 (D). The dashed curves (in grey or black, for Monaco and Pinnacle TPS respectively) delineate the 95% confidence interval for each TPS.
Figure 3. Area and dose rate variation as a function of gantry angle during VMAT delivery for a representative patient
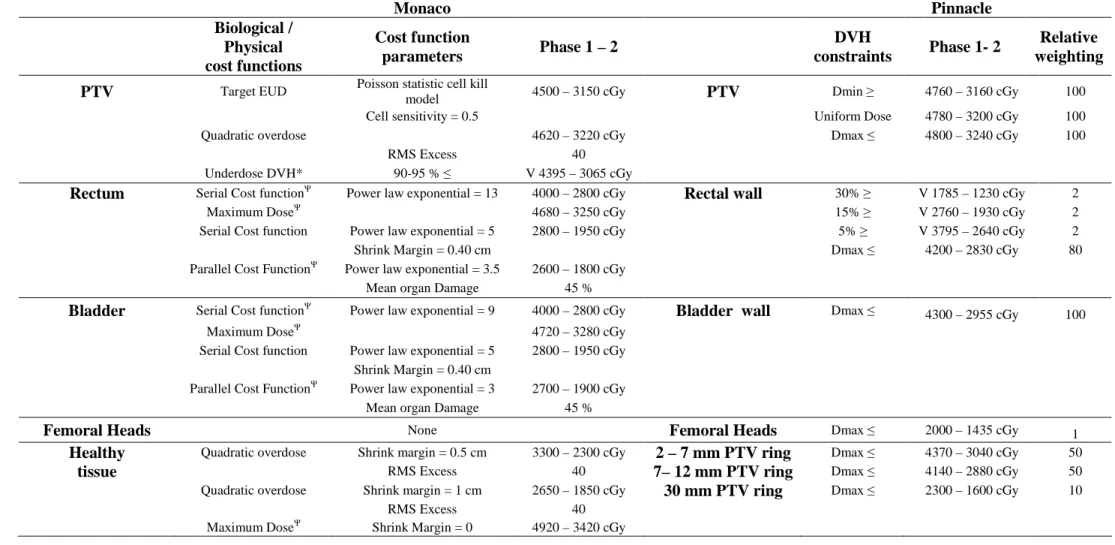
Table 1. Objective functions and parameters used in Monaco and Pinnacle. Phase 1 and phase 2 dose values are mentioned as starting value for the optimization stage.
Abbreviations: X-Y mm PTV Ring = Volume from X to Y mm of PTV, 30 mm PTV Ring = Volume from 30 mm of PTV to external contour. *This function is turned on only after the segmentation stage to optimize the PTV coverage. 2These functions have the “optimized over all
voxels in volume” option activated (i.e: gives priority to this constraint compared to others).
Table 2. Average dosimetric indices of bladder wall, rectum wall, femoral heads, healthy tissue, PTV1 and PTV2 from VMAT with Monaco or Pinnacle. P<0.05 was considered significant for Wilcoxon test.
Abbreviations: PTV = planning target volume; D mean (Gy) = mean dose to the volume; D max (Gy) =
max dose to the volume; Vx% = percentage structure volume of x% prescription dose; Dx% = Dose
received by x% percent of structure volume; HI = homogeneity index; CI = conformity index; HCO = healthy tissue coverage index. Data in parentheses are standard deviations.
Table 3. Dosimetric indices of PTV2, bladder wall and rectum wall with and without 2 mm isocenter shift in anterior and posterior directions for Monaco and Pinnacle.
Abbreviations: PTV = planning target volume; D mean (Gy) = mean dose to the volume; D max (Gy) =
max dose to the volume; Vx% = percentage structure volume of x% prescription dose; Dx% = Dose
received by x% percent of structure volume
Table 4. Patient-average QA results and efficiency. Data presented as mean [minimal - maximal] values.
Table 1 Monaco Pinnacle Biological / Physical cost functions Cost function parameters Phase 1 – 2 DVH constraints Phase 1- 2 Relative weighting PTV Target EUD Poisson statistic cell kill
model 4500 – 3150 cGy PTV Dmin 3 4760 – 3160 cGy 100 Cell sensitivity = 0.5 Uniform Dose 4780 – 3200 cGy 100
Quadratic overdose 4620 – 3220 cGy Dmax 1 4800 – 3240 cGy 100
RMS Excess 40 Underdose DVH* 90-95 % 1 V 4395 – 3065 cGy Rectum Serial Cost function2
Power law exponential = 13 4000 – 2800 cGy Rectal wall 30% 3 V 1785 – 1230 cGy 2 Maximum Dose2
4680 – 3250 cGy 15% 3 V 2760 – 1930 cGy 2 Serial Cost function Power law exponential = 5 2800 – 1950 cGy 5% 3 V 3795 – 2640 cGy 2
Shrink Margin = 0.40 cm Dmax 1 4200 – 2830 cGy 80
Parallel Cost Function2
Power law exponential = 3.5 2600 – 1800 cGy Mean organ Damage 45 %
Bladder Serial Cost function2 Power law exponential = 9 4000 – 2800 cGy Bladder wall Dmax 1 4300 – 2955 cGy 100
Maximum Dose2 4720 – 3280 cGy
Serial Cost function Power law exponential = 5 2800 – 1950 cGy Shrink Margin = 0.40 cm
Parallel Cost Function2 Power law exponential = 3 2700 – 1900 cGy Mean organ Damage 45 %
Femoral Heads None Femoral Heads Dmax 1 2000 – 1435 cGy 1
Healthy Quadratic overdose Shrink margin = 0.5 cm 3300 – 2300 cGy 2 – 7 mm PTV ring Dmax 1 4370 – 3040 cGy 50
tissue RMS Excess 40 7– 12 mm PTV ring Dmax 1 4140 – 2880 cGy 50
Quadratic overdose Shrink margin = 1 cm 2650 – 1850 cGy 30 mm PTV ring Dmax 1 2300 – 1600 cGy 10 RMS Excess 40
Maximum Dose2
Table 2
Monaco Pinnacle Wilcoxon test Monaco Pinnacle Wilcoxon test
Rectal wall PTV1
Dmax (Gy) 75.1 (0.5) 74.7 (0.8) 0.385 Dmean (Gy) 73.2 (2.8) 74.9 (3) 0.008
Dmean (Gy) 46.1 (5.7) 43.4 (7.2) 0.047
D25% (Gy) 61.7 (7.6) 60.5 (8.5) 0.093
D50% (Gy) 45.4 (8.4) 41.5 (9.9) 0.047
Bladder wall PTV2
Dmax (Gy) 77.9 (0.7) 78.1 (1.1) 0.541 Dmean (Gy) 78.4 (0.4) 78.9 (0.8) 0.241
Dmean (Gy) 31.9 (7.3) 33.9 (8.3) 0.019 Dmax (Gy) 81.7 (0.7) 81.1 (1.1) 0.102
D25% (Gy) 52.1 (12.6) 54.5 (11.5) 0.221 D5% (Gy) 81.1 (0.6) 80.8 (1) 0.260
D50% (Gy) 22.4 (9.4) 24.7 (10.9) 0.202 D95% (Gy) 74.7 (0.2) 75.4 (0.6) 0.005
Femoral heads
Dmean (Gy) 19.6 (3.5) 25.3 (2.7) 0.017
D5% (Gy) 33.1 (5.3) 37.1 (2.5) 0.059
Patient Quality indexes
Dmean (Gy) 8.3 (1.2) 9.2 (1.4) 0.005 HI 0.08 (0.01) 0.07 (0.01) 0.027
Dmax (Gy) 82.1 (0.7) 81.2 (1.1) 0.047 CI 1.19 (0.08) 1.30 (0.08) 0.036
V5% (cc) 34.8 (4.3) 36.4 (4.7) 0.008 HCO 18.10 (4.40) 25.37 (6.04) 0.028
V10% (cc) 29.4 (3.7) 30.5 (4.1) 0.053
Table 3
Without shift 2 mm shift
in anterior direction
2 mm shift in posterior direction
Monaco Pinnacle Monaco Pinnacle Monaco Pinnacle
PTV2 Dmean (Gy) 78.8 78.5 78.6 78.3 78.8 78.7 Dmax (Gy) 83.0 81.1 82.8 81.0 82.9 81.2 D5% (Gy) 81.9 80.6 81.8 80.6 81.9 80.8 D95% (Gy) 74.8 74.9 74.1 73.6 74.8 75.2 Rectum wall Dmax (Gy) 74.0 74.4 72.7 73.2 75.3 75.7 Dmean (Gy) 46.4 47.4 44.7 45.8 48.3 49.1 D25% (Gy) 65.3 65.3 61.9 61.5 68.3 68.5 D50% (Gy) 46.9 47.9 45.3 46.7 48.8 49.3 Bladder wall Dmax (Gy) 77.2 77.8 77.5 78.0 76.9 77.6 Dmean (Gy) 27.6 26.8 28.4 27.5 27.2 26.2 D25% (Gy) 44.8 41.8 46.1 43.1 43.5 40.6 D50% (Gy) 20.7 19.2 21.5 19.6 20.3 18.7
Table 4
Monaco Pinnacle
Coronal Sagittal Coronal Sagittal
γγγγ index test: criterion 3% / 3mm, dose level: 30%
% accepted point 100 98.5 98.2 97.4
γγγγ mean 0.24 0.31 0.38 0.40
γγγγ max 0.78 1.22 1.37 1.33
Dose gradient
Mean gradient (cGy/mm) 4.6 4.6 4.3 5.1
Maximum gradient (cGy/mm) 25.6 28.3 29.4 32.8
Efficiency
Delivery time (s) 169 [130-237] 165 [139-203]
MU 688 [477-902] 452 [322-614]
Mean Dose Rate (MU/min) 230 160
Mean Area (cm²) 2.6 [2.0-3.9] 4.1 [2.6-6.7]
Minimum Area (cm²) 0.5 [0.2-1.0] 1.3 [0.7-3.0]