*Corresponding author: John E. Schneider, PhD, CEO, Avalon Health Economics, 20 South Street, Suite 2B; Morristown, NJ 07960, USA, Phone: +1 862 260 9191, E-mail: John.Schneider@avalonecon.com Philipp Schuetz, Alexander Kutz and Beat Mueller: University Department of Medicine, Kantonsspital Aarau, Aarau, Switzerland Robert Balk: Pulmonary and Critical Care Medicine, Rush University Medical Center, 1653 W. Congress Parkway, Chicago, IL, USA Matthias Briel and Heiner C. Bucher: Basel Institute for Clinical Epidemiology and Biostatistics, University Hospital Basel, Basel, Switzerland
Mirjam Christ-Crain and Neera Bhatnagar: Division of Endocrinology, Diabetology and Clinical Nutrition, University Hospital Basel, Basel, Switzerland
Daiana Stolz and Michael Tamm: Clinic of Pneumology and Pulmonary Cell Research, University Hospital Basel, Basel, Switzerland
Lila Bouadma and Michel Wolff: Service de Réanimation Médicale, Université Paris 7-Denis-Diderot, Hôpital Bichat-Claude-Bernard, Assistance Publique-Hôpitaux de Paris (AP-HP), Paris, France Kristina B. Kristoffersen: Department of Infectious Diseases, Aarhus, University Hospital, Skejby, Aarhus, Denmark
Long Wei: Department of Internal and Geriatrics Medicine, Shanghai Jiao Tong University Affiliated Sixth People’s Hospital, Shanghai, P.R. China
Olaf Burkhardt and Tobias Welte: Medizinische Hochschule Hannover, Department of Pulmonary Medicine, Hannover, Germany Stefan Schroeder: Department of Anesthesiology and Intensive Care Medicine, Krankenhaus Dueren, Dueren, Germany
Vandack Nobre: Intensive Care, Universidade Federal de Minas Gerais, Belo Horizonte, Brazil
Matthias Briel: Department of Clinical Epidemiology and Biostatistics, McMaster University, Hamilton, Canada
Charles-Edouard Luyt and Jean Chastre: Service de Réanimation Médicale, Université Paris 6-Pierre-et-Marie-Curie, Hôpital Pitié-Salpêtrière, AP-HP, Paris, France
Florence Tubach: AP-HP, Hôpitaux Universitaires Paris Nord Val de Seine, Département d’Epidémiologie Biostatistique et Recherche Clinique, Paris, France, Université Paris Diderot, Sorbonne Paris Cité, UMR 738, Paris, France INSERM, UMR 738, Paris, France INSERM, CIE801, Paris, France
Michael J. Lacey, Robert L. Ohsfeldt and Cara M. Scheibling: Avalon Health Economics, Morristown, NJ, USA
Philipp Schuetz, Robert Balk, Matthias Briel, Alexander Kutz, Mirjam Christ-Crain,
Daiana Stolz, Lila Bouadma, Michel Wolff, Kristina B. Kristoffersen, Long Wei,
Olaf Burkhardt, Tobias Welte, Stefan Schroeder, Vandack Nobre, Michael Tamm,
Neera Bhatnagar, Heiner C. Bucher, Charles-Edouard Luyt, Jean Chastre, Florence Tubach,
Beat Mueller, Michael J. Lacey, Robert L. Ohsfeldt, Cara M. Scheibling and John E. Schneider*
Economic evaluation of procalcitonin-guided
antibiotic therapy in acute respiratory infections:
a US health system perspective
DOI 10.1515/cclm-2014-1015
Received October 17, 2014; accepted December 9, 2014; previously published online January 10, 2015
Abstract
Background: Whether or not antibiotic stewardship
proto-cols based on procalcitonin levels results in cost savings
remains unclear. Herein, our objective was to assess the
economic impact of adopting procalcitonin testing among
patients with suspected acute respiratory tract infection
(ARI) from the perspective of a typical US integrated
deliv-ery network (IDN) with a 1,000,000 member catchment
area or enrollment.
Methods: To conduct an economic evaluation of
procal-citonin testing versus usual care we built a cost-impact
model based on patient-level meta-analysis data of
ran-domized trials. The meta-analytic data was adapted to
the US setting by applying the meta-analytic results to US
lengths of stay, costs, and practice patterns. We estimated
the annual ARI visit rate for the one million member
cohort, by setting (inpatient, ICU, outpatient) and ARI
diagnosis.
Results: In the inpatient setting, the costs of
procalcitonin-guided compared to usual care for the one million member
cohort was $2,083,545, compared to $2,780,322, resulting
in net savings of nearly $700,000 to the IDN for 2014. In
the ICU and outpatient settings, savings were $73,326
and $5,329,824, respectively, summing up to overall net
savings of $6,099,927 for the cohort. Results were robust
for all ARI diagnoses. For the whole US insured
popula-tion, procalcitonin-guided care would result in $1.6 billion
in savings annually.
Conclusions: Our results show substantial savings
asso-ciated with procalcitonin protocols of ARI across
com-mon US treatment settings mainly by direct reduction
in unnecessary antibiotic utilization. These results are
robust to changes in key parameters, and the savings can
be achieved without any negative impact on treatment
outcomes.
Keywords: antibiotic stewardship; cost saving; economic
evaluation; procalcitonin; respiratory infection.
Introduction
Improved diagnostics and clinical biomarkers have been
shown to be an important part of cost-effective medical
care in acute care settings [1–8]. Biomarkers have shown
to be very effective in aiding diagnosis and management
of hospital patients with suspected systemic bacterial
infections, including community-acquired pneumonia
(CAP) and sepsis [9–28]. Procalcitonin (PCT) is a novel
and effective marker of assumed bacterial infections that
safely helps guide antibiotic therapy in acute respiratory
tract infections (ARI) and sepsis in hospitals [5, 29–40].
The use of PCT supplies caregivers with added
infor-mation, which, in principle, enables them to improve the
selection of patients for treatment, the timing of treatment
initiation, and the overall duration of treatment [21, 28, 32,
33, 35, 41–47]. Insofar as caregivers change their care
man-agement and treatment strategies in response to the new
information (relative to the usual standard course of action),
there are implications for changes in outcomes, both in
terms of treatment costs and health status [14, 33, 35].
There is strong evidence that PCT-guided care
man-agement results in reductions in antibiotic exposure and
possibly costs [33, 35, 37, 38, 48–53]. For example, a
com-parative effectiveness summary report from the US Agency
for Healthcare Research and Quality (“AHRQ”; 2012)
con-cluded that there was high strength of evidence in support
of PCT reducing antibiotic usage, with relative reductions
ranging from 21% to 38% [53]. According to the AHRQ
report, some studies have shown differences in hospital
intensive care unit (ICU) length of stay (LOS) and overall
hospital LOS between usual care and PCT-guided care
[48]. In most studies, the PCT-guided arm of the study was
associated with LOS reductions between 0 and 2.5 days
(0%–11%) [53]. Many of these studies did not show
sta-tistically significant results, although the one study with
significant results found a 43% reduction in ICU LOS
asso-ciated with PCT testing.
Recently, Schuetz et al. (2012) performed a
meta-anal-ysis of patient-level data from 4221 adults with ARIs from
14 clinical trials [33]. In addition to a marked reduction
in antibiotic exposure, they found significant differences
in treatment failure (defined as “death,
hospitaliza-tion, ARI-specific complications, recurrent or worsening
infection, and discomfort at 30 days”) overall between
the PCT group and the control group (19.1% and 21.9%,
respectively). Among sub-groups, these differences were
also observed in the emergency department (ED) and for
patients with CAP. A meta-analysis of five studies found
that PCT-guided treatment results in a 0.4 percentage
point reduction in mortality [53].
Economic evaluations have shown that the clinical
advantages associated with PCT-guided care also result
in net savings of healthcare resources. PCT has the
poten-tial to improve the management of health care resources
a number of ways, including: 1) reducing unnecessary
antibiotic prescriptions and supporting improved
antibi-otic stewardship; 2) reducing hospital LOS; 3) improving
the timing of diagnosis and treatment; and 4) improving
the ability of clinicians to optimally match diagnosis and
treatment [5, 34, 51, 54–60].
Based on published randomized trials of PCT-guided
treatment in Canadian hospital intensive care units,
Heyland et al. conducted a cost-minimization analysis
based on the costs of PCT testing and antibiotic acquisition
and administration [51]. PCT-guided strategies were
asso-ciated with a significant reduction in antibiotic use, and
PCT-guided care was not associated with any differences
in hospital mortality. Michaelidis et al. assessed the
cost-effectiveness of PCT-guided antibiotic therapy (vs. usual
care) in outpatient management of ARI in adults, based on
the results of two published European clinical trials [56].
In the cohort including all adult ARIs judged to require
antibiotics by their physicians, the costs of PCT-guided
care was $31 per antibiotic prescription safely avoided and
the likelihood of PCT use being favored (compared to usual
care) was 58.4% in a probabilistic sensitivity analysis – an
amount well below the willingness-to-pay. PCT-guided
care also appears to have cost-saving effects in sepsis care.
Deliberato et al. assessed patients with suspected sepsis,
severe sepsis, or septic shock in a hospital ICU, and found
that in the PCT-guided group median antibiotic duration
was 9 days vs. 13 days in the non-PCT group [50].
The existing economic literature on PCT has several
important gaps. First, none of the existing studies
examine the cumulative economic effects of PCT in all
of the clinical settings in which it can be employed (i.e.,
hospital wards, hospital ICUs, and outpatient clinics and
EDs). Second, the existing economic studies do not make
full use of recent meta-analyses of clinical trials, such as
Schuetz et al. [33, 34]. Third, none of the economic studies
pertain to the US market. Our study fills these three gaps in
the current PCT economic literature by examining effects
across all the different clinical settings in which PCT may
be used, making use of recent meta-analytic studies of
PCT clinical effectiveness, and focusing on the US health
system, including US cost structure and practice patterns.
The objective of this study is to assess the clinical
and economic impact of adopting PCT testing and
moni-toring versus usual care among patients with suspected
lower respiratory tract infection from the perspective of
a typical US integrated delivery network (IDN) or payer
with a 1,000,000 member catchment area or enrollment.
Our study fills the aforementioned gaps in the current PCT
economic literature by examining effects across all the
dif-ferent clinical settings in which PCT may be used, making
use of recent meta-analytic studies of PCT clinical
effec-tiveness, and focusing on the US health system.
Materials and methods
For this analysis we used patient-level data from a recently published comprehensive meta-analysis of available clinical trial data [33]. The protocol for this meta-analysis is published in the Cochrane Library [61]. In brief, 4221 patients with different types of respiratory infec-tions of varying severity, including upper respiratory infecinfec-tions, acute bronchitis (AB), exacerbation of chronic obstructive pulmo-nary disease (ECOPD), CAP and ventilator-associated pneumonia
(VAP) from 14 randomized trials were included in this analysis. The main variables used from the meta-analytic database were days of antibiotic exposure by diagnosis and setting.
To conduct the economic evaluation of PCT testing and moni-toring versus usual care we built a cost-impact model in MS Excel®.
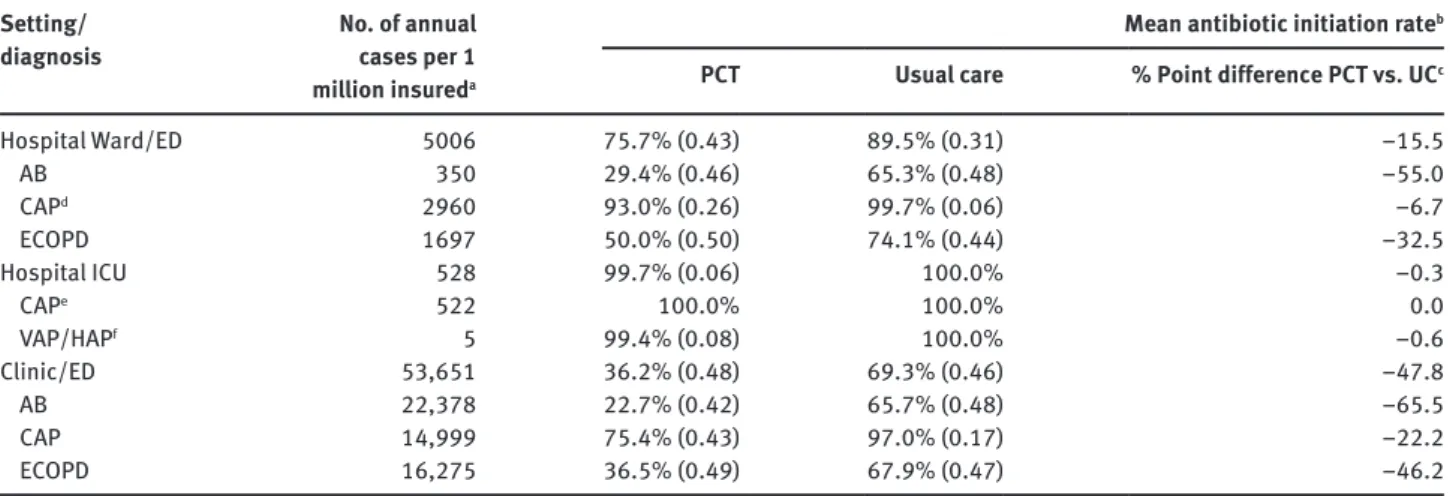
The patient population in this study is patients with suspected ARI infection diagnoses seen in one of three settings: inpatient hospital setting (not in the ICU); hospital ICU; outpatient clinic or ED based on the meta-analysis data. We first estimated the annual ARI visit rate per 100,000 population, by setting and diagnosis (Table 1). The numerator (number of visits) is based on recent US national inpa-tient and outpainpa-tient population surveys [63, 64]. Rates were then calculated based on population estimates from the US Census. The expected number of annual visits was then estimated by multiplying plan size by the estimated rate (Table 1).
We modeled PCT testing differently for each treatment setting. For inpatient stays we assumed that there would be an initial PCT test upon initial presentation (e.g., ED admitted to ward or ICU) and sub-sequent monitoring tests every other day until discharge. For partial days we rounded to the nearest whole day of stay (i.e., 5.2 LOS – tests on Days 1, 3 and 5). Outpatient care (e.g., ED discharged home, hos-pital outpatient or office visit) assumed a single PCT test to support antibiotic initiation.
Cohort patients are assumed to enter the “usual care” arm or the PCT arm. To model the effect of routine PCT utilization we compare the same number of patients in each treatment protocol. The treat-ment algorithm is adapted to setting of care as described above. For example, we assume no PCT follow-up monitoring in the outpatient setting. Based on the clinical studies included in the meta-analytic data, the costs and outcomes of each ARI episode is assessed over a 30-day period. Total costs and events are annualized based on the incidence of each condition and likelihood of treatment success and intensity. Depending on which arm of the decision tree a patient trav-els, the costs of antibiotic therapy and monitoring, PCT testing, total number of patients on antibiotic therapy, and total days of antibiotic Table 1 Acute lower respiratory infection rates and estimated number of annual cases in a typical US integrated health system and patient-level mean antibiotic initiation, by treatment protocol, setting and diagnosis.
Setting/
diagnosis No. of annual cases per 1 million insureda
Mean antibiotic initiation rate
b
PCT Usual care % Point difference PCT vs. UCc
Hospital Ward/ED 5006 75.7% (0.43) 89.5% (0.31) –15.5 AB 350 29.4% (0.46) 65.3% (0.48) –55.0 CAPd 2960 93.0% (0.26) 99.7% (0.06) –6.7 ECOPD 1697 50.0% (0.50) 74.1% (0.44) –32.5 Hospital ICU 528 99.7% (0.06) 100.0% –0.3 CAPe 522 100.0% 100.0% 0.0 VAP/HAPf 5 99.4% (0.08) 100.0% –0.6 Clinic/ED 53,651 36.2% (0.48) 69.3% (0.46) –47.8 AB 22,378 22.7% (0.42) 65.7% (0.48) –65.5 CAP 14,999 75.4% (0.43) 97.0% (0.17) –22.2 ECOPD 16,275 36.5% (0.49) 67.9% (0.47) –46.2
See text. aBased on data from the US Census [62], US HCUP [63] and US NAMCS-NHAMCS [64], per 1,000,000 insured lives in a US
inte-grated delivery system; bStandard deviations in brackets; cpercentage point difference; dassumes 85% of all CAP discharges are treated
in hospital ward; 100% of COPD and AB cases treated in ward; eassumes 15% of all CAP discharges are admitted to ICU; f100% of VAP/HAP
admitted to hospital ICU. AB, acute bronchitis; CAP, community acquired pneumonia; ECOPD, exacerbations of chronic obstructive pulmo-nary disease; UC, usual care; VAP/HAP, ventilator-associated pneumonia, also referred to as hospital-acquired pneumonia.
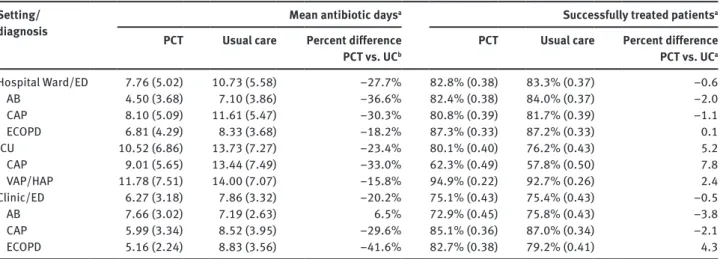
exposure are summed. Differences in antibiotic initiation rates, anti-biotic therapy days among those initiated on antianti-biotic therapy and percent successfully treated are based on the Schuetz et al. meta-analysis [33] (Tables 1 and 2).
Baseline US hospitalization LOS and overall costs of care for selected ARI inpatient care are shown in Table 3, based on an analy-sis of the US Health Care Cost and Utilization Project (HCUP) National Inpatient Sample [63]. The table also shows weighted mean costs per episode for these diagnoses; these data are provided as background and not used in subsequent analyses. In the model, we assumed that the mean baseline number of antibiotic days corresponds to the aver-age LOS for a typical hospitalization (Table 3).
The perspective of the model is that of a US IDN or payer assum-ing full or partial financial risk for all sites of care. We therefore developed the cost-impact model to capture the current burden of managing suspected ARI and the potential impact of implementing routine PCT testing. The model describes the expected annual rate of visits, site of service and diagnosis mix across the plans catchment area or enrolled population. The cohort enters the model at risk for an ARI episode and may present for care at one of three sites of ser-vice described earlier. The likelihood of presentation at each site and with each diagnosis is based on US annual incidence rates [63, 64].
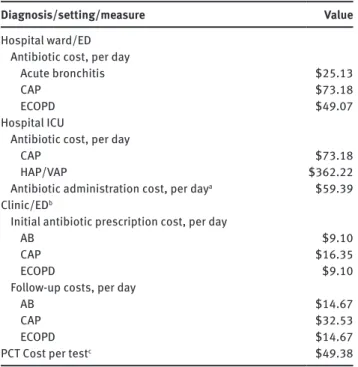
The primary outcome measure was total antibiotic-related costs by setting (hospital ward/ED, hospital ICU, or clinic/ED) attribut-able to PCT-guided care versus usual care. Daily costs of antibiotic therapy for inpatient stays were estimated based on typical daily dosage multiplied by the wholesale acquisition cost of each drug. Typical dosages and mix of expected therapy were derived from published clinical treatment guidelines [65–75]. Guidelines outline multiple treatment options and patients may require more than one antibiotic administered concurrently. In these cases we estimated the weighted average cost of a prototypical representative of a given drug class weighted by the likelihood of receiving multiple drugs during a typical stay (Table 4). Daily cost of antibiotic administration was estimated based on a recently published cost analysis [76].
The cost of PCT testing (HCPCS 84145) was estimated based on the average Medicare laboratory payment in 2014. Physician time
Table 2 Patient-level mean antibiotic days among those initiated on antibiotic treatment, and percent successfully treated: by treatment protocol, setting and diagnosis.
Setting/
diagnosis Mean antibiotic days
a
Successfully treated patients
a PCT Usual care Percent differencePCT vs. UCb PCT Usual care Percent differencePCT vs. UCa Hospital Ward/ED 7.76 (5.02) 10.73 (5.58) –27.7% 82.8% (0.38) 83.3% (0.37) –0.6 AB 4.50 (3.68) 7.10 (3.86) –36.6% 82.4% (0.38) 84.0% (0.37) –2.0 CAP 8.10 (5.09) 11.61 (5.47) –30.3% 80.8% (0.39) 81.7% (0.39) –1.1 ECOPD 6.81 (4.29) 8.33 (3.68) –18.2% 87.3% (0.33) 87.2% (0.33) 0.1 ICU 10.52 (6.86) 13.73 (7.27) –23.4% 80.1% (0.40) 76.2% (0.43) 5.2 CAP 9.01 (5.65) 13.44 (7.49) –33.0% 62.3% (0.49) 57.8% (0.50) 7.8 VAP/HAP 11.78 (7.51) 14.00 (7.07) –15.8% 94.9% (0.22) 92.7% (0.26) 2.4 Clinic/ED 6.27 (3.18) 7.86 (3.32) –20.2% 75.1% (0.43) 75.4% (0.43) –0.5 AB 7.66 (3.02) 7.19 (2.63) 6.5% 72.9% (0.45) 75.8% (0.43) –3.8 CAP 5.99 (3.34) 8.52 (3.95) –29.6% 85.1% (0.36) 87.0% (0.34) –2.1 ECOPD 5.16 (2.24) 8.83 (3.56) –41.6% 82.7% (0.38) 79.2% (0.41) 4.3
See text. aStandard deviations in brackets; bPercent difference. AB, acute bronchitis; CAP, community acquired pneumonia; ECOPD,
exacer-bations of chronic obstructive pulmonary disease; UC, usual care; VAP/HAP, ventilator-associated pneumonia, also referred to as hospital-acquired pneumonia.
Table 3 National average length of stay and inpatient costs among ARI patients in the US, 2014.
Condition/
disease ICD9 code ranges length of Mean hospital stay (2011)a Mean total hospital costs per episode (2014)b Mean total hospital costs per day (2014)c AB 466.0, 466.19 3.0 $5086 $1695 CAP 485, 486, 481,482, 483 5.1 $9925 $1946 ECOPD 491.21–491.21 4.4 $8202 $1864 HAP/VAP 997.31 13.0 $34,481 $2652 Meand 5.9 $12,790 $2067
aBased on calculations using the 2011 public-use inpatient sample
data from HCUP; bBased on 2011 HCUP calculations, trended forward
to 2014 using the consumer price index inflation adjuster; cTotal
hospital costs per episode divided by mean length of stay per episode; dWeighted by case volume. AB, acute bronchitis; CAP,
community acquired pneumonia; ECOPD, exacerbations of chronic obstructive pulmonary disease; VAP/HAP, ventilator-associated pneumonia, also referred to as hospital-acquired pneumonia. associated with interpreting the PCT test was not included in the model because the associated costs have been found to be negligi-ble [56]. Outpatient clinic treatment costs were estimated based on a recent study that examined the economic impact of antibiotic utiliza-tion incorporating estimates of the cost of initial antibiotic therapy but also induced follow-on costs associated with a new antibiotic prescription [56]. Costs are expressed per episode and were converted to per day costs using a typical average length of antibiotic therapy.
Daily costs attributable to antibiotic resistance were derived from a recent economic study of antibiotic use in the clinic setting [56]. This analysis used recent US national estimates of excess cost attributed to resistance and derived antibiotic cost per prescription
IDN. The ICU setting also resulted in savings ($73,326), but
the savings were smaller than other settings because US
protocols heavily favor empirical prescribing of
antibiot-ics in hospital ICUs [73].
The outpatient clinic and ED are where PCT has
its largest effect. In the clinic and ED, the costs of
PCT-guided care for the cohort was $5,624,532, compared to
$10,954,356, resulting in net savings of $5,329,824 to the
IDN. Across all three settings, PCT-guided care is
associ-ated with a total cost of $8,033,338 for the one million
member cohort, compared to $14,133,265 for the usual
care group, resulting in an overall net savings to the IDN
of $6,099,927.
Sensitivity analysis
To test the impact of model assumptions we conducted a
series of one-way deterministic sensitivity analyses. Key
model parameters were increased or decreased by 20% to
assess the effect of each assumption on model results. The
key output measure was the total cost difference across all
three clinical settings (–$6,099,927). We conducted
analy-ses on the following model inputs: 1) percentage
reduc-tion in antibiotic days in the PCT group; 2) daily cost of
antibiotics and monitoring; 3) type of PCT protocol (i.e.,
frequency of testing) followed in hospital settings; and 4)
antibiotic resistance costs.
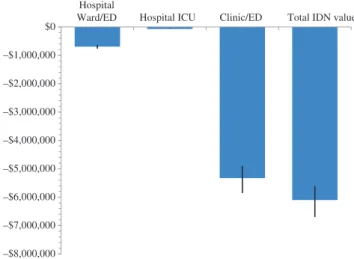
Model results are most sensitive to estimates of
the daily cost of antibiotic treatment, ranging from
$4.8 million savings to $7.4 million savings.
Percent-age reduction in antibiotic days in the PCT group is the
next most important factor, with savings ranging from
$5.6 million at the lower bound to $6.7 million at the
upper bound of the range (Figure 1). The costs of
antibi-otic resistance had only a modest impact on the results,
ranging from $5.8 million to $6.3 million at the lower
and upper bounds, respectively. PCT test frequency
among hospitalized patients had the smallest impact,
ranging from $5.7 million in savings if the test is
admin-istered once a day versus $6.1 million in the base case
protocol where testing was assumed to occur every
other day (Figure 1).
We also tested the sensitivity of the model with respect
to baseline antibiotic initiation rates. For this analysis we
focused on CAP, because in the US the vast majority of
CAP patients are started on antibiotics in all three settings
(see Table 5). However, the sensitivity analysis showed
that PCT-guided care resulted in savings even with CAP
antibiotic initiation rates as low as 65%, holding all other
variables constant.
Table 4 Cost parameters by setting and diagnosis.
Diagnosis/setting/measure Value
Hospital ward/ED
Antibiotic cost, per day
Acute bronchitis $25.13
CAP $73.18
ECOPD $49.07
Hospital ICU
Antibiotic cost, per day
CAP $73.18
HAP/VAP $362.22
Antibiotic administration cost, per daya $59.39
Clinic/EDb
Initial antibiotic prescription cost, per day
AB $9.10
CAP $16.35
ECOPD $9.10
Follow-up costs, per day
AB $14.67
CAP $32.53
ECOPD $14.67
PCT Cost per testc $49.38
See text. aBased on Van Zanten et al. [76]; bPer episode costs,
including induced follow-on costs such as office visits (based on Monte et al. [77]; cCMS HCPCS 84145 – National Medicare Midpoint
2014. AB, acute bronchitis; CAP, community acquired pneumonia; ECOPD, exacerbations of chronic obstructive pulmonary disease; VAP/HAP, ventilator-associated pneumonia, also referred to as hospital-acquired pneumonia.
and allocated costs based on the volume of antibiotic prescriptions annually for ARI in the US. The estimated cost per prescription was $43. We estimated the daily costs of antibiotic resistance by dividing the cost per prescription by the average duration (number of days) of a typical antibiotic prescription.
We conducted one-way deterministic sensitivity analyses on selected measures, including: 1) percentage reduction in antibiotic days in the PCT group; 2) daily cost of antibiotics and monitoring; 3) type of PCT protocol followed in hospital settings; and 4) antibiotic resistance costs.
Results
Overall results
Results of the cost impact model by clinical setting are
shown in Table 5. In all three settings, PCT-guided care
was shown to be cost saving across all treatment settings
and diagnoses. In the hospital ward and ED, the costs of
PCT-guided care for the one million member cohort was
$2,083,545, compared to $2,780,332 for the usual care
group, resulting in net savings of nearly $700,000 to the
As the model was most sensitive to the daily costs of
antibiotics, we also conducted a break-even analysis. For
this analysis we considered only the direct cost impact
comparing cost of PCT testing to cost savings associated
with reduced antibiotic use. Our analysis suggests that
PCT testing would maintain cost savings even when
anti-biotic treatment costs are assumed to be only 22% of our
base model assumption. Put differently, this suggests
that daily antibiotic costs could be nearly one-fifth of our
assumed value for a strategy of PCT testing to remain at
least cost neutral to a typical US IDN.
Discussion
Our results show substantial savings associated with the
use of PCT to guide antibiotic treatment of ARI across
common US treatment settings. Across all three settings,
PCT-guided care is associated with a total of $5,887,535,
compared to $12,296,714 for usual care, resulting in an
overall net savings to the IDN of $6,099,927 based on
a population of 1,000,000 insured lives. These results
are robust to changes in key parameters. In the
sensitiv-ity analysis, most parameter variations resulted in only
Table 5 IDN budget impact of PCT versus usual care in treatment of ARI in US hospitals, by setting, 2014. Protocol/diagnosis Na Initiated
on ABxb
Reduction
days ABx PCT Testing Costc
Number of
ABx days Daily ABx costs ABx resistance cost Total cost of ABx Hospital ward/emergency departmentd
PCT AB 350 29.4% –36.6% $5077 195 $85 $1173 $22,769 CAP 2960 93.0% –30.3% $271,797 9783 $133 $58,698 $1,627,391 ECOPD 1697 50.0% –18.2% $83,793 3054 $108 $18,326 $433,385 Total 5006 13,033 $78,197 $2,083,545 Usual care AB 350 65.3% NA $0 685 $85 $4111 $62,023 CAP 2960 99.7% NA $0 15,049 $133 $90,294 $2,085,285 ECOPD 1697 74.1% NA $0 5531 $108 $33,184 $633,013 Total 5006 21,265 $127,589 $2,780,322
PCT Value to IDN (Hospital/ED) –8232 –$49,392 –$696,777
Hospital ICUd PCT CAP 522 100.0% –33.0% $51,586 1786 $133 $10,716 $299,064 VAP/HAP 5 99.4% –15.8% $1560 58 $422 $346 $26,197 Total 528 1844 $11,062 $325,261 Usual care CAP 522 100.0% NA $0 2664 $133 $15,983 $369,126 VAP/HAP 5 100.0% NA $0 69 $422 $413 $29,462 Total 528 2733 $16,397 $398,588
PCT value to IDN (Hospital ICU) –889 –$5335 –$73,326
Clinic/ED PCT AB 22,378 22.7% 6.5% $250,312 37,790 $24 $226,739 $1,375,260 CAP 14,999 75.4% –29.6% $558,725 55,751 $49 $334,508 $3,618,678 ECOPD 16,275 22.7% –41.6% $182,039 15,068 $24 $90,409 $630,595 Total 53,651 108,609 $651,655 $5,624,532 Usual care AB 22,378 65.7% NA $0 102,918 $24 $617,509 $3,063,725 CAP 14,999 97.0% NA $0 101,796 $49 $610,773 $5,587,120 ECOPD 16,275 67.9% NA $0 77,381 $24 $464,284 $2,303,511 Total 53,651 282,094 $1,692,566 $10,954,356
PCT value to IDN (Clinic/ED) –173,485 –$1,040,910 –$5,329,824
Total PCT value to IDN –182,606 –$1,095,637 –$6,099,927
See text & Table 1. aSee Table 1; cohorts based on 1,000,000 covered lives in a US integrated delivery system; bBased on Schuetz et al.
[33, 34]; cSee Table 4; assumes one test on the first day of admission and follow-up tests every other day while in hospital in the PCT cohort; dincludes $59 per day antibiotic administration costs (see Table 4). AB, acute bronchitis; ABx, antibiotics; CAP, community acquired
pneu-monia; ECOPD, exacerbations of chronic obstructive pulmonary disease; VAP/HAP, ventilator-associated pneumonia, also referred to as hospital-acquired pneumonia.
small changes in total savings. The results were
sensi-tive to daily antibiotic treatment costs, which are likely to
vary to some degree regionally and among different IDNs,
but the ± 20% variation still results in savings of at least
$5 million to the IDN.
These results are similar to those of Heyland et al.
and Michaelidis et al., both of which found substantial
savings attributable to PCT-guided treatment protocols
[51, 56]. Interesting, those studies reached similar
conclu-sions but relied on methods substantially different than
ours. This adds to the robustness of the results.
We modeled the cost differential that would be
real-ized within a US IDN with 1,000,000 covered lives. In the
US, there are 262,246,800 individuals with some form of
health insurance. Extrapolating to this larger
popula-tion, based on our model PCT-guided care would result
in approximately $1.6 billion in savings nationally. If we
assume that, to some extent, the recently passed
Afford-able Care Act (ACA) in the US will extend insurance to the
entire population, the total savings attributable to
PCT-guided care would be about $1.9 billion nationally.
It is important to emphasize that the savings
asso-ciated with PCT-guided care is not assoasso-ciated with any
meaningful differences in quality, which has been a
con-sistent finding of clinical effectiveness studies of PCT to
date [5, 30, 34, 38, 52, 78, 79]. Moreover, our calculations
take into account the costs of the tests and the
adminis-tration of the tests. The implication is that the savings
are “real” savings to an IDN – the tests more than pay for
themselves without negatively affecting treatment
out-comes. In addition, it is important to stress that our
esti-mate of the daily costs of antibiotic resistance is likely very
conservative, as increasingly the literature and reports on
–$8,000,000 –$7,000,000 –$6,000,000 –$5,000,000 –$4,000,000 –$3,000,000 –$2,000,000 –$1,000,000 $0 Hospital
Ward/ED Hospital ICU Clinic/ED Total IDN value
Figure 1 IDN budget impact and confidence intervals based on days of antibiotic exposure: PCT versus usual care in treatment of ARI in US hospitals, by setting, 2014.
antibiotic resistance suggests that the amount might be
substantially higher [80].
Previous studies have not directly assessed
differ-ences in outcomes in quality of life and functioning
dimen-sions following PCT-guided treatment [53]. However, given
that time spent in-hospital generally is associated with a
lower level of health-related quality of life (HRQoL) than
time spent out of hospital, PCT-guided treatment would
be likely to translate into improvements in HRQoL if it
reduces hospital LOS. Similarly, adverse effects of
antibi-otic treatment may reduce HRQoL; thus the reduction in
antibiotic exposure resulting from PCT-guided treatment
also may translate into improvements in HRQoL.
A key assumption is whether PCT testing correlates
with actual change in care management; that is, to what
extent do physicians react to the results of PCT testing?
Put differently, to what extent do physicians weigh PCT
results versus other forms of clinical information? In
economic models of diagnostics, a common challenge
is determining whether the existence of new or
differ-ent information actually changes physician behavior.
In a randomized study design, where patients are
ran-domized to PCT-guided care versus usual care, this
problem may not be too serious because, in theory, any
differences in endpoints can be attributed to the
inter-vention. However, the extent of this causal relationship
is dependent on the overall quality of the study design.
Moreover, any given hospital could argue that their
phy-sicians and care management teams “tend to do things
differently.” For example, Dusemund et al. found
con-siderable variation in how physicians react to PCT test
results [35].
Another potential limitation of our study is that the
meta-analytic data used pertain primarily to European
settings. The model was designed to account for these
dif-ferences in two ways – by using US data on LOS,
utiliza-tion rates, and costs, and by applying US practice patterns
as reflected in clinical practice guidelines. Although this
approach is likely to provide a reasonable approximation
of the cost impact of PCT in US clinical settings, a more
definitive approach would have been to use US trial data
analogous to the meta-analytic data compiled by Schuetz
et al. Such data, however, were not available for this study.
Conclusions
Our results show substantial savings associated with
the use of PCT to guide antibiotic treatment of ARI in
common US treatment settings. Across all three settings,
PCT-guided care is associated with net savings ranging
from $73,326 in the ICU to > $5 million in the outpatient
clinic and ED setting, for total savings to the IDN of more
than $6 million. These results are robust to changes in key
parameters, and the savings can be achieved without any
negative impact on treatment outcomes.
Acknowledgments: We thank Blandine Pasquet (Institut
national de la santé et de la recherche médicale (INSERM),
Paris) for assisting with data queries. We thank Qing
Wang, PhD (Basel Institute for Clinical Epidemiology and
Biostatistics, University Hospital Basel, Basel,
Switzer-land), for her help with the translation of an article
pub-lished in Chinese. We thank Dr. Jeffrey Greenwald, Mass
General Hospital (MGH), Boston (MA) for scientific
discus-sion. None of these persons received any compensation
for their help with this study.
Author contributions: PS and MB had full access to all
of the data in the study and take responsibility for the
integrity of the data and the accuracy of the data
analy-sis. All the authors have accepted responsibility for the
entire content of this submitted manuscript and approved
submission.
Financial support: This study was supported by
BioMer-ieux as well as by unrestricted research grants from
BRAHMS/Thermo fisher Scientific, the Gottfried and
Julia Bangerter-Rhyner-Foundation, the Swiss
Founda-tion for Grants in Biology and Medicine (SSMBS,
PASMP3-127684/1) and Santésuisse to cover salary time related to
this study.
Employment or leadership: None declared.
Honorarium: Drs. Schuetz, Kutz, Christ-Crain and Mueller
received support from BRAHMS and bioMérieux to attend
meetings and fulfilled speaking engagements. Dr. Mueller
has served as a consultant and received research support.
Dr. Bucher received research support from BRAHMS. Drs.
Stolz, Burkhardt and Tamm received research support
from BRAHMS. Drs. Welte and Schroeder received lecture
fees and research support from BRAHMS. Dr. Luyt received
lecture fees from Brahms and Merck Sharp &
Dohme-Chi-bret. Dr. Chastre received consulting and lecture fees from
Pfizer, Brahms, Wyeth, Johnson & Johnson, Nektar-Bayer,
and Arpida. Dr. Wolff received consulting and lectures
fees from Merck Sharp & Dohme-Chibret, Janssen-Cilag,
Gilead and Astellas. Dr. Tubach received research grants
from Abbott, Astra-Zeneca, Pfizer, Schering Plough. Dr.
Balk has served as a consultant and received research
support from bioMerieux and BRAHMS. All other authors
declare that the answer to the questions on the
compet-ing interest form are all “No” and therefore have nothcompet-ing
to declare.
Competing interests: The funding organization(s) played
no role in the study design; in the collection, analysis, and
interpretation of data; in the writing of the report; or in the
decision to submit the report for publication.
References
1. Assasi N, Schwartz L, Tarride JE, Goeree R, Xie F. Economic evaluations conducted for assessment of genetic testing technologies: a systematic review. Genet Test Mol Biomark 2012;16:1322–35.
2. Beaulieu M, de Denus S, Lachaine J. Systematic review of phar-macoeconomic studies of pharmacogenomic tests. Pharmacog-enomics 2010;11:1573–90.
3. Chowdhury P, Kehl D, Choudhary R, Maisel A. The use of biomarkers in the patient with heart failure. Curr Cardiol Rep 2013;15:372.
4. Diop D. Maximizing the quality and cost-effectiveness of cardiac care with laboratory technology and process improvements. J Cardiovasc Manage 2003;14:19–23.
5. Schuetz P, Amin DN, Greenwald JL. Role of procalcitonin in managing adult patients with respiratory tract infections. Chest 2012;141:1063–73.
6. Shen B, Hwang J. The clinical utility of precision medicine: properly assessing the value of emerging diagnostic tests. Clin Pharmacol Therapeut 2010;88:754–6.
7. Wong W. A health plan’s integration of molecular diagnostics and the impact on treatment pathways for quality care. Manage Care 2008;17(7 Suppl 7):13–6; discussion 7–8.
8. Wong WB, Carlson JJ, Thariani R, Veenstra DL. Cost effectiveness of pharmacogenomics: a critical and systematic review. Pharma-coeconomics 2010;28:1001–13.
9. Barbier F, Andremont A, Wolff M, Bouadma L. Hospital-acquired pneumonia and ventilator-associated pneumonia: recent advances in epidemiology and management. Curr Opin Pulmon Med 2013;19:216–28.
10. Christ-Crain M, Muller B. Biomarkers in respiratory tract infec-tions: diagnostic guides to antibiotic prescription, prognostic markers and mediators. Eur Respir J 2007;30:556–73. 11. Christ-Crain M, Opal SM. Clinical review: the role of
biomark-ers in the diagnosis and management of community-acquired pneumonia. Crit Care 2010;14:203.
12. Faix JD. Biomarkers of sepsis. Crit Rev Clin Lab Sci 2013;50:23–36. 13. File TM, Jr. New diagnostic tests for pneumonia: what is their
role in clinical practice? Clin Chest Med 2011;32:417–30. 14. Gerber JS, Prasad PA, Fiks AG, Localio AR, Grundmeier RW,
Bell LM, et al. Effect of an outpatient antimicrobial steward-ship intervention on broad-spectrum antibiotic prescribing by primary care pediatricians: a randomized trial. J Am Med Assoc 2013;309:2345–52.
15. Gjelstad S, Hoye S, Straand J, Brekke M, Dalen I, Lindbaek M. Improving antibiotic prescribing in acute respiratory tract infec-tions: cluster randomised trial from Norwegian general practice (prescription peer academic detailing (Rx-PAD) study). Br Med J 2013;347:f4403.
16. Lippi G, Meschi T, Cervellin G. Inflammatory biomarkers for the diagnosis, monitoring and follow-up of community-acquired
pneumonia: clinical evidence and perspectives. Eur J Intern Med 2011;22:460–5.
17. Luyt CE, Combes A, Trouillet JL, Chastre J. Biomarkers to optimize antibiotic therapy for pneumonia due to multidrug-resistant pathogens. Clin Chest Med 2011;32:431–8.
18. Mira JP, Max A, Burgel PR. The role of biomarkers in community-acquired pneumonia: predicting mortality and response to adjunctive therapy. Crit Care 2008;12(Suppl 6):S5.
19. Mitsuma SF, Mansour MK, Dekker JP, Kim J, Rahman MZ, Tweed-Kent A, et al. Promising new assays and technologies for the diagnosis and management of infectious diseases. Clin Infect Dis 2013;56:996–1002.
20. O’Brien DJ, Gould IM. Maximizing the impact of antimicrobial stewardship: the role of diagnostics, national and international efforts. Curr Opin Infect Dis 2013;26:352–8.
21. Reinhart K, Hartog CS. Biomarkers as a guide for antimicrobial therapy. Int J Antimicrob Agents 2010;36(Suppl 2):S17–21. 22. Schuetz P, Christ-Crain M, Muller B. Biomarkers to improve
diagnostic and prognostic accuracy in systemic infections. Curr Opin Crit Care 2007;13:578–85.
23. Schuetz P, Haubitz S, Mueller B. Do sepsis biomarkers in the emergency room allow transition from bundled sepsis care to personalized patient care? Curr Opin Crit Care 2012;18:341–9. 24. Schuetz P, Litke A, Albrich WC, Mueller B. Blood biomarkers
for personalized treatment and patient management deci-sions in community-acquired pneumonia. Curr Opin Infect Dis 2013;26:159–67.
25. Seligman R, Ramos-Lima LF, Oliveira Vdo A, Sanvicente C, Pacheco EF, Dalla Rosa K. Biomarkers in community-acquired pneumonia: a state-of-the-art review. Clinics 2012;67:1321–5. 26. Upadhyay S, Niederman MS. Biomarkers: what is their benefit
in the identification of infection, severity assessment, and man-agement of community-acquired pneumonia? Infect Dis Clinic N Am 2013;27:19–31.
27. Ventetuolo CE, Levy MM. Biomarkers: diagnosis and risk assessment in sepsis. Clin Chest Med 2008;29:591–603, vii. 28. Vincent JL, Beumier M. Diagnostic and prognostic markers in
sepsis. Expert Rev Anti Infect Ther 2013;11:265–75.
29. Aabenhus R, Jensen JU. Procalcitonin-guided antibiotic treat-ment of respiratory tract infections in a primary care setting: are we there yet? Prim Care Respir J 2011;20:360–7.
30. Fazili T, Endy T, Javaid W, Maskey M. Role of procalcitonin in guiding antibiotic therapy. Am J Health Syst Pharm 2012;69:2057–61.
31. Foushee JA, Hope NH, Grace EE. Applying biomarkers to clinical practice: a guide for utilizing procalcitonin assays. J Antimicrob Chemother 2012;67:2560–9.
32. Riedel S. Procalcitonin and the role of biomarkers in the diag-nosis and management of sepsis. Diagn Microbiol Infect Dis 2012;73:221–7.
33. Schuetz P, Briel M, Christ-Crain M, Stolz D, Bouadma L, Wolff M, et al. Procalcitonin to guide initiation and duration of antibiotic treatment in acute respiratory infections: an individual patient data meta-analysis. Clin Infect Dis 2012;55:651–62.
34. Schuetz P, Muller B, Christ-Crain M, Stolz D, Tamm M, Bouadma L, et al. Procalcitonin to initiate or discontinue antibiotics in acute respiratory tract infections. Cochrane Database Syst Rev 2012;9:CD007498.
35. Dusemund F, Bucher B, Meyer S, Thomann R, Kühn F, Bassetti S, et al. Influence of procalcitonin on decision to start antibiotic
treatment in patients with a lower respiratory tract infection: insight from the observational multicentric ProREAL surveil-lance. Eur J Clin Microbiol Infect Dis 2013;32:51–60. 36. Geiser MM. Procalcitonin testing in the puzzle of sepsis:
bioMerieux, 2013.
37. Soni N, Samson D, Galaydick J, Vats V, Huang ES, Aronson N, et al. Procalcitonin-guided antibiotic therapy: a systematic review and meta-analysis. J Hosp Med 2013;8:530–40. 38. Wacker C, Prkno A, Brunkhorst FM, Schlattmann P. Procalcitonin
as a diagnostic marker for sepsis: a systematic review and meta-analysis. Lancet Infect Dis 2013;13:426–35.
39. Wu MH, Lin CC, Huang SL, Shih HM, Wang CC, Lee CC, et al. Can procalcitonin tests aid in identifying bacterial infections associated with influenza pneumonia? A systematic review and meta-analysis. Influenza Other Respir Viruses 2013;7: 349–55.
40. Yu CW, Juan LI, Wu MH, Shen CJ, Wu JY, Lee CC. Systematic review and meta-analysis of the diagnostic accuracy of pro-calcitonin, C-reactive protein and white blood cell count for suspected acute appendicitis. Br J Surg 2013;100:322–9. 41. Berg P, Lindhardt BO. The role of procalcitonin in adult patients
with community-acquired pneumonia – a systematic review. Dan Med J 2012;59:A4357.
42. Briel M, Christ-Crain M, Young J, Schuetz P, Huber P, Périat P, et al. Procalcitonin-guided antibiotic use versus a standard approach for acute respiratory tract infections in primary care: study protocol for a randomised controlled trial and baseline characteristics of participating general practitioners [ISRCTN73182671]. BMC Fam Pract 2005;6:34.
43. Briel M, Schuetz P, Mueller B, Young J, Schild U, Nusbaumer C, et al. Procalcitonin-guided antibiotic use vs a standard approach for acute respiratory tract infections in primary care. Arch Intern Med 2008;168:2000–7; discussion 7–8.
44. Schuetz P, Albrich W, Christ-Crain M, Chastre J, Mueller B. Procalcitonin for guidance of antibiotic therapy. Expert Rev Anti Infect Ther 2010;8:575–87.
45. Schuetz P, Chiappa V, Briel M, Greenwald JL. Procalcitonin algo-rithms for antibiotic therapy decisions: a systematic review of randomized controlled trials and recommendations for clinical algorithms. Arch Intern Med 2011;171:1322–31.
46. Tang H, Huang T, Jing J, Shen H, Cui W. Effect of procalcitonin-guided treatment in patients with infections: a systematic review and meta-analysis. Infection 2009;37:497–507. 47. Wolff M, Bouadma L. What procalcitonin brings to management
of sepsis in the ICU. Crit Care 2010;14:1007.
48. Agarwal R, Schwartz DN. Procalcitonin to guide duration of anti-microbial therapy in intensive care units: a systematic review. Clin Infect Dis 2011;53:379–87.
49. Albrich WC, Dusemund F, Bucher B, Meyer S, Thomann R, Kühn F, et al. Effectiveness and safety of procalcitonin-guided antibi-otic therapy in lower respiratory tract infections in “real life”: an international, multicenter poststudy survey (ProREAL). Arch Intern Med 2012;172:715–22.
50. Deliberato RO, Marra AR, Sanches PR, Martino MD, Ferreira CE, Pasternak J, et al. Clinical and economic impact of procalcitonin to shorten antimicrobial therapy in septic patients with proven bacterial infection in an intensive care setting. Diagn Microbiol Infect Dis 2013;76:266–71.
51. Heyland DK, Johnson AP, Reynolds SC, Muscedere J. Procalci-tonin for reduced antibiotic exposure in the critical care setting:
a systematic review and an economic evaluation. Crit Care Med 2011;39:1792–9.
52. Schuetz P, Muller B, Christ-Crain M, Stolz D, Tamm M, Bouadma L, et al. Procalcitonin to initiate or discontinue antibiotics in acute respiratory tract infections. Evid Based Child Health 2013;8:1297–371.
53. Soni N, Samson D, Galaydick J, Vats V, Pitrak D, Aronson N. Pro-calcitonin-guided antibiotic therapy. Comparative effectiveness review No. 78. AHRQ Publication No. 12(13)-EHC124-EF. Rockville, MD: Agency for Healthcare Research and Quality: Blue Cross and Blue Shield Association Technology Evaluation Center Evidence-based Practice Center under Contract No. 290-2007-10058-I, 2012. 54. Assink-de Jong E, de Lange DW, van Oers JA, Nijsten MW,
Twisk JW, Beishuizen A. Stop Antibiotics on guidance of Proc-alcitonin Study (SAPS): a randomised prospective multicenter investigator-initiated trial to analyse whether daily measure-ments of procalcitonin versus a standard-of-care approach can safely shorten antibiotic duration in intensive care unit patients – calculated sample size: 1816 patients. BMC Infect Dis 2013;13:178.
55. Haubitz S, Mueller B, Schuetz P. Streamlining antibiotic therapy with procalcitonin protocols: consensus and controversies. Expert Rev Respir Med 2013;7:145–57.
56. Michaelidis CI, Zimmerman RK, Nowalk MP, Fine MJ, Smith KJ. Cost-effectiveness of procalcitonin-guided antibiotic therapy for outpatient management of acute respiratory tract infections in adults. J Gen Intern Med 2014;29:579–86.
57. Schuetz P, Christ-Crain M, Wolbers M, Schild U, Thomann R, Falconnier C, et al. Procalcitonin guided antibiotic therapy and hospitalization in patients with lower respiratory tract infec-tions: a prospective, multicenter, randomized controlled trial. BMC Health Serv Res 2007;7:102.
58. Smith KJ, Wateska A, Nowalk MP, Raymund M, Lee BY, Zim-merman RK, et al. Cost-effectiveness of procalcitonin-guided antibiotic use in community acquired pneumonia. J Gen Intern Med 2013;28:1157–64.
59. Tokman S, Schuetz P, Bent S. Procalcitonin-guided antibiotic therapy for chronic obstructive pulmonary disease exacerba-tions. Expert Rev Anti Infect Ther 2011;9:727–35.
60. Wilke MH, Grube RF, Bodmann KF. The use of a standard-ized PCT-algorithm reduces costs in intensive care in septic patients – a DRG-based simulation model. Eur J Med Res 2011;16:543–8.
61. Schuetz P, Briel M, Christ-Crain M, Wolbers M, Stolz D, Tamm M, et al. Procalcitonin to initiate or withhold antibiotics in acute respiratory tract infections (Protocol). Cochrane Database Syst Rev 2008;(Issue 4. Art. No.: CD007498).
62. US Census. Current population esimates. Washington, DC: US Bureau of the Census, 2014.
63. AHRQ. Health Care Cost and Utilization Project (HCUP) National (US) 20% inpatient sample from all participating community hospitals. Rockville, MD: Agency for Health Care Research and Quality, 2012.
64. NAMCS-NHAMCS. National Ambulatory Medical Care Survey (NAMCS) and National Hospital Ambulatory Medical Care Survey (NHAMCS), Public-Use Datasets (2011 data). 2014.
65. Flanders SA, Halm EA. Guidelines for community-acquired pneumonia: are they reflected in practice? Treat Respir Med 2004;3:67–77.
66. Bodi M, Rodriguez A, Sole-Violan J, Gilavert MC, Garnacho J, Blanquer J, et al. Antibiotic prescription for community-acquired pneumonia in the intensive care unit: impact of adherence to Infectious Diseases Society of America guidelines on survival. Clin Infect Dis 2005;41:1709–16.
67. Soo Hoo GW, Wen YE, Nguyen TV, Goetz MB. Impact of clini-cal guidelines in the management of severe hospital-acquired pneumonia. Chest 2005;128:2778–87.
68. Shorr AF, Bodi M, Rodriguez A, Sole-Violan J, Garnacho-Montero J, Rello J. Impact of antibiotic guideline compliance on duration of mechanical ventilation in critically ill patients with commu-nity-acquired pneumonia. Chest 2006;130:93–100.
69. Barben J, Kuehni CE, Trachsel D, Hammer J. Management of acute bronchiolitis: can evidence based guidelines alter clinical practice? Thorax 2008;63:1103–9.
70. Sethi S. Antibiotics in acute exacerbations of chronic bronchitis. Expert Rev Anti Infect Ther 2010;8:405–17.
71. Niederman MS, Luna CM. Community-acquired pneumonia guidelines: a global perspective. Semin Respir Crit Care Med 2012;33:298–310.
72. Webb BJ, Dangerfield BS, Pasha JS, Agrwal N, Vikram HR. Guideline-concordant antibiotic therapy and clinical out-comes in healthcare-associated pneumonia. Respir Med 2012;106:1606–12.
73. Bordon J, Aliberti S, Duvvuri P, Wiemken T, Peyrani P, Natividad I, et al. Early administration of the first antimicrobials should be considered a marker of optimal care of patients with commu-nity-acquired pneumonia rather than a predictor of outcomes. Int J Infect Dis 2013;17:e293–8.
74. Moran GJ, Rothman RE, Volturo GA. Emergency manage-ment of community-acquired bacterial pneumonia: what is new since the 2007 Infectious Diseases Society of America/ American Thoracic Society guidelines. Am J Emerg Med 2013;31:602–12.
75. Viasus D, Garcia-Vidal C, Carratala J. Advances in antibiotic therapy for community-acquired pneumonia. Curr Opin Pulmon Med 2013;19:209–15.
76. van Zanten AR, Engelfriet PM, van Dillen K, van Veen M, Nuijten MJ, Polderman KH. Importance of nondrug costs of intravenous antibiotic therapy. Crit Care 2003;7:R184–90.
77. Monte SV, Paolini NM, Slazak EM, Schentag JJ, Paladino JA. Costs of Treating Lower Respiratory Tract Infections in Outpatients. Am J Managed Care 2008;14:190–96. 78. Lee M, Snyder A. The role of procalcitonin in
community-acquired pneumonia: a literature review. Advanced Emerg Nurs J 2012;34:259–71.
79. Bishop BM, Bon JJ, Trienski TL, Pasquale TR, Martin BR, File TM, Jr. Effect of introducing procalcitonin on antimicrobial therapy duration in patients with sepsis and/or pneumonia in the inten-sive care unit. Ann Pharmacother 2014;48:577–83.
80. Cohen B, Larson EL, Stone PW, Neidell M, Glied SA. Factors associated with variation in estimates of the cost of resistant infections. Med Care 2010;48:767–75.