*Corresponding author: Franziska Baensch, ETH Zurich – Institute for Building Materials, CH-8093 Zürich, Switzerland,
e-mail: [email protected]
Markus G.R. Sause: University of Augsburg – Institute for Physics, Experimental Physics II, D-86135 Augsburg, Germany
Andreas J. Brunner: Swiss Federal Laboratories for Materials Science and Technology – Laboratory for Mechanical Systems Engineering, CH-8600 Dübendorf, Switzerland
Peter Niemz: ETH Zurich – Institute for Building Materials, CH-8093 Zürich, Switzerland
Franziska Baensch*, Markus G.R. Sause, Andreas J. Brunner and Peter Niemz
Damage evolution in wood – pattern recognition
based on acoustic emission (AE) frequency
spectra
Abstract: Tensile tests on miniature spruce specimens
have been performed by means of acoustic emission (AE) analysis. Stress was applied perpendicular (radial direction) and parallel to the grain. Nine features were selected from the AE frequency spectra. The signals were classified by means of an unsupervised pattern recogni-tion approach, and natural classes of AE signals were identified based on the selected features. The algorithm calculates the numerically best partition based on sub-set combinations of the features provided for the analy-sis and leads to the most significant partition including the respective feature combination and the most probable number of clusters. For both specimen types investigated, the pattern recognition technique indicates two AE signal clusters. Cluster A comprises AE signals with a relatively high share of low-frequency components, and the oppo-site is true for cluster B. It is hypothesized that the signa-ture of rapid and slow crack growths might be the origin for this cluster formation.
Keywords: acoustic emission, crack growth, damage
evo-lution, frequency spectrum, microscopic damage mecha-nisms, Spruce, unsupervised pattern recognition
DOI 10.1515/hf-2014-0072
Received March 10, 2014; accepted August 15, 2014; previously pub-lished online Janaury 20, 2015
Introduction
Research results are not yet available concerning the tracking back the evolution of a wood fracture zone to
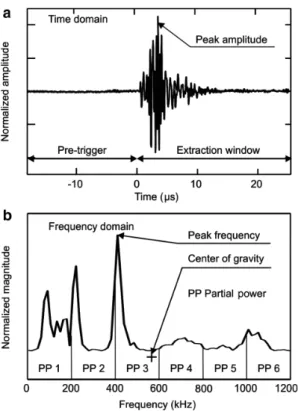
its origin. Such research should determine the temporal-spatial occurrence of damage mechanisms and their interactions at different length scales, i.e., in the cell wall at the microscale and in the tissue at the mesoscale and macroscale. However, damage mechanisms have been frequently studied (Ashby et al. 1985; Frühmann et al. 2003), and failure scenarios have also been investigated in model analyses (Hofstetter et al. 2008; Saavedra Flores and Friswell 2013). The synchronous monitoring of multi-scaled damage evolution, as a result of load exposure, is difficult because of the limited observable length scales. The acoustic emission (AE) method facilitates the detec-tion of damage events at the microscopic and macroscopic scale. Additionally, the high time resolution in the range of μs allows detailed monitoring of the damage evolu-tion. Nevertheless, the most challenging task is to assign features of the detected AE signals to their sources. A multitude of approaches focuses on this issue. The con-ventional AE analysis investigates the parameters of the AE signals in the time domain (Figure 1a) by means of AE signal amplitudes (Debaise et al. 1966; Ansell 1982; Ando et al. 1992a; Cunderlik et al. 1996; Lee et al. 1996; Aicher et al. 2001; Kim et al. 2005; Rosner 2012). Other studies focused on the AE frequency features (frequency domain, see Figure 1b) (Ogino et al. 1986; Tyree and Sperry 1989; Reiterer et al. 2000; Jakiela et al. 2008).
The present contribution introduces an approach based on frequency spectra of the detected AE events fol-lowed by pattern recognition. To the best of the authors’ knowledge, this approach to AE analysis of wood materi-als is unprecedented. The AE frequency spectra contain the main characteristics of the signal’s origin (Stephens and Pollock 1971), and thus, similar source mechanisms are assumed to generate similar AE frequency features near the source location. The propagation of AE through the material is accompanied by reflection processes, which induce intrinsic similarities to the AE signal. To classify the AE signals properly, these similarities have to be identified and weighted for their significance. Therefore, the method of unsupervised pattern recog-nition (UPR) is a useful tool. It is a purely mathemati-cal approach to obtain dataset partitions by means of multivariate data analysis. The approach for signal
classification applied in the present study was originally developed for failure identification in hybrid materials (Sause et al. 2012a). Its applicability is well established in the field of failure mechanism studies of fiber-rein-forced composites (Sause et al. 2012b). Because these composites and wood have distinct microstructures with anisotropic elastic properties (Fratzl et al. 2004), the implementation of the UPR method for AE signal classi-fication of failing wood seems to be straightforward and promising.
Materials and experimental design
The specimens were cut from clear spruce wood [Picea
abies (L.) Karst.] grown in the canton of Grisons
(Switzer-land) at altitudes above 1000 m (age approximately 250 years). The mechanical properties of that wood stock, which is characterized by a low average raw density of approximately 340 kg m-3, have already been described by
Sonderegger et al. (2008).
Figure 1 Parameters of AE signals in time domain (a) and frequency domain (b).
A pretrigger of 18 μs was chosen, the frequency spectra were calculated from the first 25.6 μs of the detected signal (extraction window) (a). The unsupervised pattern recognition was performed by using nine frequency features: PF, CGF [Eq. (1)], WPF [Eq. (2)], and PP1–6 [Eq. (3)] (b).
Figure 2 Design of the radial specimens (a) and longitudinal speci-mens (b) glued into the specimen holders; the experimental setup (c) is also shown.
The tests presented here were carried out on minia-ture specimens to allow the implementation of the testing setup into a synchrotron computed microtomography (SR-μCT) for further investigations. Two sets of specimens were manufactured regarding the applied fiber-load angle (Figure 2a, b). The specimens prepared for load applica-tion in the radial (R) direcapplica-tion will be denoted as R speci-mens, and those prepared for load application parallel to the grain will consequently be denoted as longitudinal (L) specimens.
The first step in sample preparation was cutting blanks of dimension 30 × 5.7 × 2.3 mm3 (length × width × thickness),
whereby the most important step was the preparation of a plane cut of one specimen surface by a microtome blade. The created surface has the sufficient quality for coupling the piezoelectric AE sensors. Failure in the R specimens is expected mainly within the earlywood (EW) (Müller et al. 2003). Thus, L specimens were selected for comparability also from EW, resulting in the low density of 280 kg m-3
(Table 1). To ensure crack initiation between both AE sensors, the specimen’s geometry is tapered. The R speci-mens have only a two-sided taper of approximately 4 mm2
test cross-section, whereby approximately five to six growth rings are within the tapered volume. In contrast, the L specimens are taper shaped at all four sides, yield-ing a test cross-section down to 1 mm2. The specimens
were transferred into the specimen supports made of alu-minum with a single component polyurethane adhesive, which enabled an interlocking mount of the specimens in the testing device by a connection thread (Figure 2).
Tensile tests were performed with a loading device for miniature specimens (Zauner et al. 2012) with a load cell
of 1 kN, which was designed to be implemented at the syn-chrotron beam line. The load application was performed under displacement control. Tests were continued up to the ultimate failure of the specimen. The R specimens were loaded with a cross-head speed of 0.005 mm s-1, whereas
the L specimens were tested at 0.01 mm s-1 to prevent
pos-sible creeping in the fixing adhesive within the specimen supports. In total, seven specimens of each type were tested. Despite their low densities (Table 1) and taking into account the size effect yielding heightened strengths due to the tiny test cross-sections, the tensile strengths of the specimens are in good agreement with values determined by Wagenführ (2000). The high standard deviation of the strength measured for the L specimens might be due to different density profiles within the growth rings located in the cross-sections (Lanvermann et al. 2013).
The AE monitoring was performed with a digital AE equipment (AMSY-6, Vallen Systeme GmbH, Icking, Germany). Two miniature piezoelectric sensors [type M31 (Fuji Ceramics Corp., Shizuoka, Japan)] with a cou-pling area of 3 mm in diameter were mounted single sided on the surface of the specimen (Figure 2c). The even mounting of the AE sensors’ piezoelectric bearing face was facilitated by precisely machined sensor sup-ports. Silicone-free vacuum grease was used as couplant (Pöllath J.P. Labortechnik, Bamberg, Germany) between sensor and specimen surface. The M31 AE sensors are sensitive to a frequency range of 300 kHz–800 kHz, in which the sensor response is almost constant ( ± 3 dB; see Figure 3). Below 300 kHz, the sensor response
Table 1 Characterization of the investigated radial (R) and longitudinal (L) spruce wood specimens (mean ± SD). Type Na Density (kg/m3) MC
b
(%) Cross-section (mm2) Growth ring width (mm) Traverse velocity (mm/s) Test duration (s) Strength (N/mm2)
R 7 337 ± 6 8.5 4.1 ± 0.2 1.49 ± 0.10 0.005 54 ± 6 8 ± 1
L 7 280 ± 11 8.3 1.2 ± 0.2 – 0.010 18 ± 6 54 ± 11
aNumber of specimens. bMoisture content.
Figure 3 Averaged frequency response curve of the miniature AE sensors.
steeply decreases by approximately -30 dB. Because the sensors are positioned quite close to the specimen’s failure zone, far field attenuation effects are assumed to be negligible (approximately 0.25 dB cm-1; Bucur and
Böhnke 1994), but higher attenuation in the near field zone around the source cannot be excluded. However, regarding the different cell compositions of both speci-men types (L specispeci-mens of EW tracheids, R specispeci-mens containing growth rings), the AE detection of the R specimens might be affected by a higher damping due to the differences in density within the growth rings (growth ring width of approximately 1.5 mm; Table 1). The frequency range of the preamplifiers (AEP3, gain of 34 dB into 50 Ω; AMSY-6, Vallen Systeme GmbH, Icking, Germany) was limited between 30 kHz and 960 kHz. The detection of the AE waveforms was performed with a sampling rate of 10 MHz, yielding a signal duration of 409.6 μs including an 18-μs pretrigger. The threshold was set to 32.1 dBAE (≈0.04 mV). The chosen rearm time of 1 ms is based on empirical values.
The AE measurement performed with two sensors enables the localization of AE events. However, tracking the source position is not considered in this investigation, but exclusively AE events localized between both sensors (max. 10 mm distance) are selected for AE analysis. The acoustic propagation velocity through spruce wood is ca. 6000 m s-1 in the L direction and ca. 2200 m s-1 in the
R direction (Sonderegger et al. 2008), and based on this, the AE events can be separated by means of AE detection by both sensors (Kurz et al. 2008) within the maximum possible difference in arrival times ( ≤ 10 μs). The wave-forms from the first signal of each AE event provide the basis for all analyses presented here. Hence, in the fol-lowing, these first signals of the AE event are denoted as AE signals. The number of detected AE signals during one single tensile test is quite low (on average 16 AE events for each test). To ensure a suitable statistical database for pattern recognition processing, the extracted AE feature datasets of all seven tests are analyzed simultaneously for each specimen type.
Method of UPR: The UPR technique was applied
frequency domain. To this purpose, the AE signal frequency spectra were calculated via Fourier transformation (Hamm-ing window function, 256 samples) applied to the first 256 samples of the AE signal in the time domain (0–25.6 μs) excluding the 18-μs pretrigger (Figure 1a). The limitation in the time domain was set with regard to the rise time of the AE events ranging from < 1 μs up to 10 μs to ensure the proper selection of signal features only from the first part of the signal burst. Because the lifetime of an AE source event is in the range of some ns to a few μs (Pardee and Graham 1978), the most significant effects of the source mechanism are expected at the beginning of the signal’s arrival at the sensor. The propagation of AE through the material structure is accompanied by reflection processes causing intrinsic similarities in the AE signals. Especially in tiny specimen sizes, as investigated here, these self-sim-ilarities must be considered in AE frequency analysis.
The input features for the cluster algorithm are selected exclusively from the AE signal’s frequency spectra. Besides the peak frequency (PF) (Figure 1b) and center of gravity frequency (CGF) [Eq. (1)], the weighted PF (WPF) [Eq. (2)] is also introduced as an AE feature. The WPF combines the PF and the CGF for an improved representation of the AE signal frequency spectra. Addi-tionally, the total frequency range is divided into six dif-ferent partial power levels (PP) [Eq. (3), Figure 1b]. To yield comparable frequency spectra, these features were normalized by their maximum magnitude for eliminat-ing the influence of different source excitation energies. Altogether, these nine frequency features are chosen as input parameters for the pattern recognition approach.
⋅
∫
∫
( ) CGF: ( ) f U f df U f df (1) ⋅ PF CGF WPF: f f (2)∫
∫
2 1 end start 2 2 ( ) PP: ( ) f f f f U f df U f df (3)The UPR algorithm used in the current study tries to find the best possible partition by investigating subset combinations of the features given. Partitions are com-pared based on cluster validity measures, and the optimum partition that includes the respective feature combination and the number of clusters is returned. The details of this algorithm have been described by Günter and Bunke (2003) and Sause et al. (2012a).
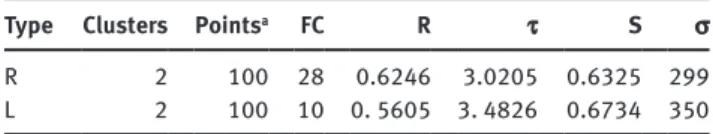
Table 2 Results of clustering of the radial (R) and longitudinal (L) specimens.
Type Clusters Pointsa FC R τ S σ
R 2 100 28 0.6246 3.0205 0.6325 299
L 2 100 10 0. 5605 3. 4826 0.6734 350 Feature combination no. 10: PF, WPF, CGF, PP2 (200–400 kHz). Feature combination no. 28: PF, WPF, CGF, PP4 (600–800 kHz). FC, feature combination; R, Davies-Bouldin index; τ, Tou index; S, Rousseeuw’s Silhouette value; σ, Calinski and Harabasz index.
aMaximal possible points: 100.
In the present study, all possible subset feature com-binations are evaluated, ranging from the predefined minimum number of four features to the maximum nine previously defined features. Thus, in total, 382 possible feature sets are investigated. Another limitation of the algorithm is related to the expected number of signal clus-ters. Generally, the expected number of clusters should be within the range of the number of actual physical damage phenomena or mechanisms and possibly additional noise sources. The discrimination of different emission phenom-ena is difficult, although intrinsic damage phenomphenom-ena are provoked by the applied fiber-load angles because of the complex hierarchical structure of wood and the spectral sensitivity of the AE sensors. Hence, the cluster algorithm is applied to seek for 2, 3, …, 10 possible clusters, which yields 3438 partitions to investigate in total.
The Euclidean distance is the basis for the distance measurement of the dataset inputs. Based on this metric, as cluster validity indices, the Davies-Bouldin index R (Davies and Bouldin 1979), the Tou index τ (Tou 1979), the Rousseeuw’s silhouette value S (Rousseeuw 1987), and Gamma statistic σ (Calinski and Harabasz 1974) are cal-culated to obtain a measure for the cluster separation. A voting scheme combining the rankings of these individual indices yields the partition with the optimal performance based on points, whereby the best possible performance is rated by a maximum of 100 points (Sause et al. 2012a).
Results and discussion
The UPR technique was performed separately for the R and L specimen types. In both cases, a feature combina-tion (rated with 100 points) was found to be the numeri-cally best separation of the AE signals into two clusters (Table 2). For the R specimens, the obtained feature com-bination consists of the PF, the CGF, and the WPF as well as PP4. For the L specimens, the feature combination also
Figure 4 The clustering of the AE signals yields the two clusters A and B.
PP4 (range of 600–800 kHz) vs. WPF are presented for AE signals detected during tensile testing of the spruce specimens in the radial (a) and longitudinal (b) directions.
comprises the PF, CGF, and the WPF, but it is based on PP2 instead. For comparison of the pattern recognition result, the PP4 and the WPF were chosen to present the cluster results of both specimen types (Figure 4) as the sig-nificance of the clusters is reflected most clearly by their WPFs.
Table 3 Cluster characteristics.
Cluster N PF (kHz) CGF (kHz) WPF (kHz) PP1 (%) PP2 (%) PP3 (%) PP4 (%) PP5 (%) PP6 (%)
AR 60 278 (85/376) 399 (286/491) 332 (181/399) 23 ± 10 35 ± 8 16 ± 5 23 ± 7 3 ± 2 0 ± 0
BR 55 671 (583/723) 495 (412/616) 572 (518/648) 15 ± 7 22 ± 6 16 ± 5 43 ± 11 4 ± 2 0 ± 0
AL 42 276 (269/290) 439 (300/500) 346 (286/374) 17 ± 8 40 ± 8 11 ± 4 27 ± 9 5 ± 2 1 ± 0
BL 80 687 (593/737) 524 (383/650) 595 (514/674) 12 ± 6 23 ± 7 12 ± 5 46 ± 10 7 ± 3 1 ± 0
Data are presented as median (min/max) or mean ± SD. (Compare Figure 1b). N, number of signals.
For both specimen types, the signals of cluster AR (R tests) and AL (L tests) contain WPFs below 500 kHz, while those of cluster BR and BL contain WPFs above 500 kHz. Furthermore, signals of the B clusters show a larger share of high-frequency content (compared to the A clusters) due to an average PP4 of approximately 40% (Table 3). Hence, the clusters can roughly be differentiated into signals with a relatively high share of low-frequency (A clusters) and high-frequency (B clusters) contents, respectively.
For the R tests, 60 signals are assigned to cluster AR and 55 signals to cluster BR (Table 3), which is more or less a ratio of 1:1. Within the damage history (Figure 5), the brittle failure behavior of the R specimens is reflected, as the AE starts just shortly before the ultimate failure (above 70% of maximum load). Furthermore, a clear trend in AE onset is not observable, as the cluster AR matches with the AE onset in 3 of 7 cases. During load progression, the AE amplitudes of both clusters increase, mainly ranging from 40 dBAE up to 80 dBAE. Near and during the ultimate failure of the R specimens, the maximum AE amplitudes reach values above 80 dBAE in both clusters AR (Figure 5a) and BR (Figure 5b). Hence, for tensile loading in the R direction, both clusters and their origin mechanisms are assumed to have a rather equal standing in damage evolution.
The normalized average AE signals of clusters AR and BR in the time domain are clearly different (Figure 6a, b). In comparison to the average waveform of cluster AR, that of cluster BR is more similar to a characteristic burst signal with fast oscillations vs. time. Furthermore, in the fre-quency domain, both clusters reveal broadband spectra with three distinct peaks at approximately 100 kHz, 280 kHz, and 670 kHz (Figure 6c, d). Consistently, the plot of PP4 vs. WPF (Figure 4a) indicates a possible separa-tion of cluster AR (with low-frequency components) into AE signals with a WPF close to 200 kHz and AE signals close to 330 kHz. The available miniature sensor is limited to frequencies between 300 kHz and 800 kHz (Figure 3), and therefore, a low significance in difference of the low-frequency components (compared to that of the high-frequency domain) might be caused by this limitation. Additional research is needed to clarify the role of several
Figure 5 Stress and AE signal amplitudes vs. test duration of two specimens tensile loaded in the radial direction; distinction between both clusters AR and BR is included.
parameters (e.g., material properties and specimen geom-etry) influencing these frequency peaks. However, the cluster AR is characterized mainly by low-frequency com-ponents below 600 kHz, which is also reflected in PP1– PP3 containing ca. 75% of the signals’ frequency content (Table 3). The signals of cluster BR contain more high-fre-quency components. The normalized average magnitude at the PF of 670 kHz is not significantly larger than the comparable peak in cluster AR (Figure 6c, d). The more sig-nificant difference, compared to the cluster AR, is found in the lower normalized average magnitude at 280 kHz. This implies a lower relative share of low-frequency content, which thus results in a relative increase in PP4. To sum up the R tests, both clusters AR and BR are essentially differ-entiated by their relative share of low-frequency content.
The ratio of signals attributed to clusters AL and BL differs when tensile load is applied in the L direction (42:80), which is different to the R load results (60:55).
Moreover, in contrast to the linear behavior of the R speci-mens (Figure 5), the stress curves while loading parallel to the grain show premature, transient load drops (Figure 7), which are also accompanied by AE signals for both AL and BL. The deviations in the stress curves reveal predamages, probably of truncated tracheids on the tapered edges. Anal-ogously to the R tests, the AE onset was generated either by cluster AL (Figure 7a) or by cluster BL (Figure 7b). With pro-gressive load application, there is a consistent and corre-sponding increase in the AE amplitude values (40–80 dBAE) in both signal clusters. Moreover, cluster BL solely generates the maximum AE amplitudes during the ultimate failures, and thus, cluster B possibly indicates the L specimens’ total destruction. Contrary to the R specimens, the generated maximum AE amplitudes generated here generally remain below the 80 dBAE (Ando et al. 1992b).
Comparing the normalized average waveform of both clusters in the time domain, the signals of cluster AL start with a short term of fast oscillations (0–10 μs) and level off in slower oscillations (Figure 8a). The average signal of cluster BL (Figure 8b) shows a burst signal similar to that of cluster BR. Both clusters reveal broadband spectra, but only two distinctive peaks at approximately 280 kHz and 690 kHz (Figure 8c, d). Cluster AL is characterized mainly by low-frequency components, which are most notably reflected in the contribution of PP2 with approximately 40% of the signals’ frequency content (Table 3). In con-trast, the relative share of high-frequency components in cluster BL is reflected in PP4–PP6, which yields about 54% of the frequency content beyond 600 kHz. Compared to cluster AL, the magnitude of the peak at 690 kHz in cluster BL shows a significant increase (Figure 8c, d). This leads to the pronounced differences in PP2 and PP4 between both clusters. Consequently, in contrast to clusters AR and BR, clusters AL and BL are differentiated by their relative share of high-frequency content.
Clusters A and B are almost of similar nature for the R and the L tested specimens (Figure 4), as indicated by the averaged WPF of approximately 340 kHz (cluster AR and AL) and 580 kHz (cluster BR and BL), respectively. Thus, it is assumed that the source mechanisms are similar in both specimen types. The peaks at approximately 670–690 kHz, observed in all clusters (Figure 6c, d, Figure 8c, d), might be caused by L waves propagating parallel to tracheid axes and thus correspond to the frequency response of the structural vibration (600 kHz up to 700 kHz) (Bucur 2006). Tyree and Sperry (1989) suggested that cellulose induces the high-frequency components. At microscopic scale, the transcellular fracture yields rapid crack growths (Debaise et al. 1966). With respect to the characteristic WPFs of the AE clusters, it is worth considering that the signature of
Figure 6 Averaged normalized AE signals of cluster AR (a, c) and cluster BR (b, d) detected during tensile testing of the spruce specimens in
the radial direction.
AE signals are presented in time domain (a, b) and frequency domain (c, d).
Figure 7 Stress and AE signal amplitudes vs. test duration of two specimens tensile loaded in the longitudinal direction; distinction between both clusters AL and BL is included.
such rapid crack growths might well be reflected within both B clusters, especially with regard to the ultimate failure of all seven L specimens generating the maximum amplitudes seen solely in cluster BL (Figure 7).
For interpreting the low-frequency A clusters (Figure 4), the 1:1 ratio of the AE signals observed in clusters AR and BR for R tests gives a first hint. Following Ashby et al. (1985) a ratio of the material density (Table 1) to the cell wall density (1500 kg m-3) above 0.2 indicates the phenomena of cell wall
cracks as well as cell separation, which also applies to the tested material. Thus, since the B clusters are assigned to rapid cell wall cracks, the formation of the A clusters could tentatively be attributed to slow cell separation phenomena.
Since the AE amplitude values for both signal clusters increase more or less alike, the attributed damage mech-anisms are not restricted to certain amplitude values as expected by Ando et al. (1992a) or Romhány et al. (2003). Instead, this might reflect the complexity in failure behav-ior due to the cellular composition resulting from the strong interaction between both cellulose fibrils and the lignin matrix.
Conclusions
This preliminary study introduces a new approach of UPR to identify clusters of AE signals detected on wood under tensile stress. For each loading case, tensile loading spruce specimens in the R and L directions, the two clusters A
and B of AE signals were detected: AE signals of cluster A are characterized by WPFs of approximately 340 kHz, whereby those of cluster B yield WPFs of approximately 580 kHz. A first working hypothesis assumes the A clus-ters to indicate slow crack growths such as cell separation mechanisms, whereas the B clusters are attributed to tran-scellular cracks. To provide a substantial evidence of the cluster’s origin, subsequent experiments combining this setup with synchronous SR-μCT monitoring are continued in another study.
Acknowledgments: The authors acknowledge the
finan-cial support of the Swiss National Science Founda-tion under grant SNF-Project 127134. The authors thank Michaela Zauner, ETH Zürich, Institute of Building Mate-rials, for designing the experimental equipment, and Thomas Schnider, ETH Zürich, Institute for Building Mate-rials, for helping with the specimen preparation.
References
Aicher, S., Höfflin, L., Dill-Langer, G. (2001) Damage evolution and acoustic emission of wood at tension perpendicular to fiber. Holz Roh Werkst. 59:104–116.
Ando, K., Ohta, M., Sato, K., Okano, T. (1992a) Mechanical Behavior of Materials – VI. Fracture Mechanism and Acoustic Emission Characteristics of Wood. Pergamon Press Ltd., Oxford, 1992. pp. d129–d134.
Ando, K., Sato, K., Fushitani, M. (1992b) Fracture-toughness and acoustic-emission characteristics of wood. 2. Effects of grain angle. Mokuzai Gakkaishi 38:342–349.
Ansell, M.P. (1982) Acoustic emission from softwoods in tension. Wood Sci. Technol. 16:35–57.
Ashby, M.F., Easterling, K.E., Harrysson, R., Maiti, S.K. (1985) The fracture and toughness of woods. Proc. R. Soc. Lond. A 261–280.
Bucur V. (2006). 4.3 System measurment. In: Acoustics of Wood. Eds. T.E. Timell and R. Wimmer. Springer, Berlin. pp. 71–81. Bucur, V., Böhnke, I. (1994) Factors affecting ultrasonic
measure-ments in solid wood. Ultrasonics 32:385–390.
Calinski, R., Harabasz, J. (1974) A dendrite method for cluster analy-sis. Commun. Stat. 3:1–27.
Cunderlik, I., Molinski, W., Raczkowski, J. (1996) The monitoring of drying cracks in the tension and opposite wood by acoustic emission and scanning electron microscopy methods. Holz-forschung 50:258–262.
Davies, D.L., Bouldin, D.W. (1979) A cluster separation measure. IEEE Trans. Pattern Anal. Mach. Intell. 1:224–227.
Debaise, G.R., Porter, A.W., Pentoney, R.E. (1966) Morphology and mechanics of wood fracture. Mater. Res. Standard. 6:493– 499.
Fratzl, P., Burgert, I., Gupta, H.S. (2004) On the role of interface polymers for the mechanics of natural polymeric composites. Phys. Chem. Chem. Phys. 6:5575–5579.
Figure 8 Averaged normalized AE signals of cluster AL (a, c) and cluster BL (b, d) detected during tensile testing of the spruce specimens in the longitudinal direction.
Frühmann, K., Burgert, I., Stanzl-Tschegg, S. (2003) Detection of fracture path under tensile loads through in situ tests in an ESEM chamber. Holzforschung 57:326–332.
Günter, S., Bunke, H. (2003) Validation indices for graph clustering. Pattern Recognit. Lett. 24:1107–1113.
Hofstetter, K., Hellmich, Ch., Eberhardsteiner, J., Mang, H.A. (2008) Mechanics of advanced materials and structures. Mech. Adv. Mater. Struct. 15:474–484.
Jakiela, S., Bratasz, L., Kozlowski, R. (2008) Acoustic emission for tracing fracture intensity in lime wood due to climatic varia-tions. Wood Sci. Technol. 42:269–279.
Kim, K.B., Kang, H.Y., Yoon, D.J., Choi M.Y. (2005) Pattern clas-sification of acoustic emission signals during wood drying by principal component analysis and artificial neural network. Key Eng. Mater. 297–300:1962–1967.
Kurz, H., Köppel, S., Linzer, L., Schechinger, B., Grosse, C. (2008) In: Acoustic Emission Testing in Engineering – Basics and Applications. Eds. Grosse, C., Ohtsu, M. Springer Publ., Heidel-berg, pp. 101–147.
Lanvermann, C., Evans, R., Schmitt, U., Hering, S., Niemz, P. (2013) Distribution of structure and lignin within growth rings of Nor-way spruce. Wood Sci. Technol. 47:627–641.
Lee, S.-H., Quarles, S.L., Schniewind, A.P. (1996) Wood fracture, acoustic emission, and drying process. Part 2. Acoustic emission pattern recognition analysis. Wood Sci. Technol. 30:283–292. Müller U, Gindl, W., Teischinger, A. (2003) Effects of cell wall
anatomy on the plastic and elastic behaviour of different wood species loaded perpendicular to grain. IAWA J. 24:117–128. Ogino, S., Kaino, K., Suzuki, M. (1986) Prediction of lumber
check-ing durcheck-ing drycheck-ing by means of acoustic emission technique. J. Accoust. Emission 5:61–65.
Pardee, W.J., Graham, L.J. (1978) Frequency analysis of two types of simulated acoustic emissions. J. Acoust. Soc. Am. 63:793– 799.
Reiterer, A., Stanzl-Tschegg, S.E., Tschegg, E.K. (2000) Mode I frac-ture and acoustic emission of softwood and hardwood. Wood Sci. Technol. 34:417–430.
Romhány, G., Karger-Kocsis, J., Czigany, T. (2003) Tensile fracture and failure behavior of technical flax fibers. J. Appl. Polym. Sci. 90:3638–3645.
Rosner, S. (2012) Waveform features of acoustic emission provide information about reversible and irreversible processes during spruce sapwood drying. BioResources 7:1253–1263.
Rousseeuw, P.J. (1987) Silhouettes: a graphical aid to the interpreta-tion and validainterpreta-tion of cluster analysis. J. Comput. Appl. Math. 20:53–65.
Saavedra Flores, E.I., Friswell, M.I. (2013) Ultrastructural mecha-nisms of deformation and failure in wood under tension. Int. J. Solids Struct. 50:2050–2060.
Sause, M.G.R., Gribov, A., Unwin, A.R., Horn, S. (2012a) Pattern recognition approach to identify natural clusters of acoustic emission signals. Pattern Recognit. Lett. 33:17–23. Sause, M.G.R., Müller, T., Horoschenkoff, A., Horn, S. (2012b)
Quantification of failure mechanisms in mode-I loading of fiber reinforced plastics utilizing acoustic emission analysis. Compos. Sci. Technol. 72:167–174.
Sonderegger, W., Alter, P., Niemz, P. (2008) Investigations on selected properties of tonal wood of spruce from Grisons. Holz Roh Werkst. 66:345–354.
Stephens, R.W.B., Pollock, A.A. (1971) Waveforms and frequency spectra of acoustic emission. J. Acoust. Soc. Am. 50:904–910. Tou, J.T. (1979) DYNOC – a dynamic optimal cluster-seeking
tech-nique. Int. J. Comput. Inform. Sci. 8:41–547.
Tyree, M.T., Sperry, J.S. (1989) Characterization and propaga-tion of acoustic emission signals in woody plants: towards an improved acoustic emission counter. Plant Cell Environ. 12:371–382.
Wagenführ, R. Holzatlas. Fachbuchverlag, Leipzig, 2000. pp. 177–178.
Zauner, M., Keunecke, D., Mokso, R., Stampanoni, M., Niemz, P. (2012) Synchrotron-based tomographic microscopy (SbTM) of wood: development of a testing device and observation of plastic deformation of uniaxially compressed Norway spruce samples. Holzforschung 66:973–979.