Spatial scaling, proportional thinking, and numerical understanding in 5- to 7-year-old children Wenke Möhringa, Andrea Frickb, and Nora S. Newcombec
University of Basel
NOTICE: This is the author's version of a work that was accepted for publication in Cognitive
Development. Changes resulting from the publishing process, such as peer review, editing,
corrections, structural formatting, and other quality control mechanisms may not be reflected in this document. Changes may have been made to this work since it was submitted for publication.
A definitive version is published as:
Möhring, W., Frick, A., & Newcombe, N. S. (2018). Spatial scaling, proportional thinking, and numerical under-standing in 5- to 7-year-old children. Cognitive Development, 45, 57-67.
DOI: 10.1016/j.cogdev.2017.12.001
Author Note
a Corresponding author: Wenke Möhring, University of Basel, Department of Psychology, Missionsstrasse 62, 4055 Basel, Switzerland; Email:
b Andrea Frick, University of Fribourg, Department of Psychology, Rue P.A. de Faucigny 2, 1700 Fribourg, Switzerland; Email: [email protected];
c Nora S. Newcombe, Temple University, Department of Psychology, 318 Weiss Hall, 1701 N. 13th Street, Philadelphia, PA, 19122, USA; Email: [email protected].
Correspondence concerning this article should be addressed to Wenke Möhring, Department of Psychology, University of Basel, Missionsstrasse 62, 4055 Basel, Switzerland.
Abstract
The present study investigated the role of spatial scaling and proportional-reasoning skills in children’s number-line estimations. Proportional strategies in number-line
estimations might suggest that correlations between number-line knowledge and scaling are driven by proportional thinking. However, analyses of data on spatial scaling, proportional reasoning, counting skills, and number-line knowledge from 5- to 7-year-old children (N = 65) showed significant correlations between spatial-scaling performance and number-line knowledge, even after age, counting skills, common method variance, and proportional reasoning were accounted for. Thus, spatial scaling is related to variance in number-line estimations due to mechanisms beyond proportional reasoning. The ability to mentally transform magnitudes may be the additional common underlying process.
Keywords: Spatial scaling, Proportional reasoning, Number line, Map use, Spatial cognition, Cognitive development
Spatial scaling, proportional thinking, and numerical understanding in 5- to 7-year-old children
1. Introduction
Numerous studies have indicated that spatial thinking and numerical reasoning are closely related (for reviews, see Mix & Cheng, 2012; Newcombe, Levine, & Mix, 2015). This link has been shown in several cross-sectional studies (e.g., Casey, Nuttall, Pezaris, & Benbow, 1995; Hegarty & Kozhevnikov, 1999; Kyttälä, Aunio, Lehto, Van Luit, &
Hautamäki, 2003; Mix et al., 2016; Reuhkala, 2001). Furthermore, several longitudinal studies have demonstrated that spatial skills predicted young children’s performance on mathematical tasks (e.g., Gunderson, Ramirez, Beilock, & Levine, 2012; Lauer & Lourenco, 2016; Verdine, Golinkoff, Hirsh-Pasek, & Newcombe, 2017) as well as adolescents’ later career choices and success in the STEM (Science, Technology, Engineering, and
Mathematics) disciplines (Kell, Lubinski, Benbow, & Steiger, 2013; Shea, Lubinski, & Benbow, 2001; Wai, Lubinski, & Benbow, 2009).
Much of this research on associations between spatial skills and mathematical performance has focused on mental rotation, showing that children’s and adults’ ability to rotate objects in their minds is related to their math scholastic assessment test (SAT) scores (Casey et al., 1995), number-line estimations (Gunderson et al., 2012), geometry concepts (Kyttälä & Lehto, 2008), arithmetic (Reuhkala, 2001), and early numeracy (Kyttälä et al., 2003). However, there are of course many spatial skills other than mental rotation. Yet to date, surprisingly little is known about them and their specific relations to mathematical reasoning.
One spatial skill that deserves a closer look is spatial scaling, or the ability to relate distances in one space to distances in another space (Frick & Newcombe, 2012; Huttenlocher, Newcombe, Vasilyeva, 1999; Vasilyeva & Huttenlocher, 2004). Scaling is an important
component of map reading, and children and adults seem to use analog mental transformation strategies for spatial scaling (Möhring, Newcombe, & Frick, 2014, 2016) akin to mental rotation (Shepard & Metzler, 1971). That is, they mentally shrink or expand spatial
information in the sense of zooming in or out (of the map), thereby internally transforming magnitude information. Such transformation can be thought of as a holistic strategy that changes the entire image, rather than transforming and comparing image-internal distances and their spatial relations. Importantly, this ability to zoom in or out of a space may be crucial for understanding and mentally transforming other kinds of magnitudes as well, such as numerical magnitudes. That is, children with higher abilities in visualizing and flexibly transforming spatial information (i.e., zooming) may be at advantage when they have to transform numerical magnitudes. These transformations of numerical magnitudes are relevant for several mathematical procedures such as when being asked to divide a number by 4 in a division problem.
Support for the notion that spatial scaling may be relevant for mathematical reasoning comes from previous studies that have shown that scaling and proportional thinking are closely related (Boyer & Levine, 2012; Möhring, Newcombe, & Frick, 2015). An understanding of scale relations may be similar to an understanding of proportional equivalence. That is, just as the relations of internal distances within a map and within the real-world space are the same despite differences in absolute size between the map and the real-world space, the relations of components in equivalent proportions (e.g., 3/5 and 6/10) are the same, despite differences in absolute sizes. Thus, the ability to comprehend the relation of two magnitudes regardless of their absolute sizes may be driving the correlation between spatial-scaling and proportional-reasoning tasks. However, it is still an open question whether spatial scaling is also related to magnitude processing other than
proportional reasoning, or how this relation extends to the processing of numerical magnitudes.
Therefore, in the present study, we assessed whether and how spatial scaling is related to performance in tasks that require thinking about numerical magnitudes and involve
proportional judgments. In one of these tasks, we presented participants with different
relative amounts of water and cherry juice and asked them to judge the taste of these mixtures on a rating scale. Thus, the task did not involve numerical entities; however, it required to encode proportional relations, and to reproduce equivalent relations in a different spatial format. This task had been successfully used in 4- to 10-year-olds in previous studies (Möhring et al., 2015; Möhring, Newcombe, Levine, & Frick, 2016).
In another task, participants were presented with a physical line and asked to indicate where different numbers belong on this line. This number-line task has often been used in previous studies with children and adults (e.g., Barth & Paladino, 2011; Booth & Siegler, 2006; Landy, Silbert, & Goldin, 2013; Opfer & Siegler, 2007; Siegler & Opfer, 2003; Slusser, Santiago, & Barth, 2013; Thompson & Opfer, 2010; Rips, 2013) and children’s accuracy in locating the numbers was found to be a strong predictor for mathematical performance and learning (Booth & Siegler, 2008; Geary, Hoard, Byrd-Craven, Nugent, & Numtee, 2007; Gunderson et al., 2012, LeFevre et al., 2013; Siegler & Booth, 2004). If participants locate the numbers correctly with respect to the magnitude each number stands for, their responses would be a linear function of number size. However, young children’s estimations typically show a non-linear relation to the normative positions. Some studies have indicated logarithmic response patterns (e.g., Siegler & Opfer, 2003). Other studies have indicated patterns suggesting that children’s familiarity with numbers (Ebersbach, Luwel, Frick, Onghena, & Verschaffel, 2008) or knowledge of the decimal system (Möller, Pixner, Kaufman, & Nuerk, 2009) influenced their responses. Yet, other research has suggested that
even seemingly linear patterns may in fact be best described by one- and two-cycle power models, suggesting a proportional judgment or mental subdivision of the number line (Barth & Paladino, 2011; Slusser et al., 2013).
These latter findings are of crucial importance for the present study because they show that solving this number-line task may require similar proportional judgments as required in the proportional-reasoning and spatial-scaling tasks. Thus, in the present study, we analyzed individual children’s response patterns to clarify the role of proportional thinking in the number-line task, and to further investigate its potential contribution to the correlation between scaling and number-line performance. To this end, we tested whether children would indeed use proportional judgments in the number-line task (as indicated by one- or two-cycle functions) or produce patterns in accordance to a linear or logarithmic number representation, or an unbounded power function (which would indicate that children focus on the origin of the number line only).
To measure spatial-scaling abilities, we used a spatial-localization task similar to the ones that had been used in previous research (Frick & Newcombe, 2012; Huttenlocher et al., 1999; Vasilyeva & Huttenlocher, 2004). The task consisted of two conditions. In one
condition (non-scaled), children had to simply reproduce a target location presented on a map in a same-sized referent space. In another condition (scaled), the same referent space was presented, but the maps were smaller, such that children had to mentally scale spatial magnitudes to match the referent space. This manipulation was implemented to investigate the specificity of possible correlations. If correlations were due to scaling abilities, we expected them to only show in the scaled version of the task (cf. Möhring et al., 2015). In contrast, if correlations were driven by some surface similarities between tasks (spatial nature, response mode, etc.), one could expect the correlations to be similar for scaled and non-scaled trials.
Finally, to control for individual differences in children’s general familiarity with numbers, we assessed their counting abilities. Counting reflects which numbers children have been introduced to and their understanding of the ordinal structure of the symbolic number system. However, in contrast to number-line estimations, it does not necessarily require an understanding of numerical magnitude. We used a counting-on task, in which the
experimenter starts to count and the child is asked to count on beyond the next decade change to avoid reciting of rote memorizations (e.g., Ebersbach et al., 2008). As this task can be solved without having a sense for numerical magnitudes and does not involve proportional judgments, we did not expect counting to correlate with proportional reasoning or spatial scaling. However, we expected a correlation between children’s counting and number-line estimations because both tasks require an understanding of whole numbers (cf. Aunola, Leskinen, Lerkkanen, & Nurmi, 2004).
The goals of the present study were two-fold. First, we intended to investigate the relation between spatial scaling and number-line estimations. Based on the previous research outlined above, one could assume that these two abilities are connected, as both seem to involve proportional judgments. As a second goal, we investigated whether spatial scaling explained any additional variance in number-line performance, above and beyond
proportional thinking as measured in the proportional-reasoning task. Based on studies reviewed above indicating that mental transformation strategies are involved in scaling, and on the notion that such mental transformation skills may be crucial for understanding
numerical magnitudes (cf. Mix & Cheng, 2012), we assumed that spatial-scaling abilities are of additional benefit to performance in number-line tasks. We tested 5- to 7-year-olds
because at this age large individual variance could be expected in spatial scaling (Frick & Newcombe, 2012), proportional reasoning (Boyer, Levine, & Huttenlocher, 2008; Jeong,
Levine, & Huttenlocher, 2007), counting (Ebersbach et al., 2008), as well as number-line estimations (Booth & Siegler, 2006).
2. Method 2.1 Participants
A total of 65 children participated in the present study: 26 5-year-olds (Mage = 65, SD
= 3, range: 60-71 months, 14 females), 20 6-year-olds (Mage = 77, SD = 4, range: 72-83
months, 13 females), and 19 7-year-olds (Mage = 89, SD = 4, range: 85-95 months, 8 females).
Two additional children were tested but excluded from the final sample due to experimenter error (one 5-year-old and one 6-year-old). Children were predominantly Caucasian, middle class, and recruited in kindergartens and primary schools in or near a large city in
Switzerland. Parents gave written consent and children provided verbal assent. The present study followed ethical guidelines and was approved by the Institutional Review Board of the University. Children received a small gift for their participation.
2.2 Administered tasks
Each child solved the spatial-localization task, the proportional-reasoning task, and the number-line task, in a randomized order. Counting was always assessed immediately after the number-line task. Testing took place in a quiet room in children’s kindergartens or schools and took approximately 30 minutes.
2.2.1 Spatial-localization task
This task was adapted from Frick and Newcombe (2012). Children were told a story about a farmer whose chickens hid their eggs in a field and were then asked to help the farmer find the eggs. Children were presented with an empty green narrow field (with a constant size of 20 cm x 2 cm) printed horizontally on a white DIN A4 paper. Another DIN A4 paper was placed next to this referent space, showing a green map with a white egg.
Children were told that the egg was hidden in the same location in the field, and were asked to position a small rubber peg where they thought the egg was hidden. The map remained visible until the child had placed the peg. Then, the experimenter marked the responses without giving feedback and presented the next map along with an empty reference space.
For the first half of the task, maps had the same size as the referent space, thus no scaling was required (non-scaled trials, scaling factor of 1). In the second half of the task, the size of the map was reduced so that a distance in the map corresponded to a fourfold distance in the referent space (scaled trials, scaling factor of 4). Importantly, only the sizes of the maps were varied, whereas the referent space had a constant size across non-scaled and scaled trials. Between the non-scaled and scaled trials, the experimenter pointed out that the maps would be smaller now, and repeated the instruction. Children were randomly assigned to one of two different sets of locations (A or B, see Appendix) with the restriction that each set was assigned about equally often per age group and sex. Each of the sets presented 15 different egg locations that were distributed along the horizontal dimension of the space in one of two predetermined random orders. The locations in these sets corresponded to the locations of the numbers in the 0-100 number-line task (see Appendix). The averaged absolute deviations (in mm) from the correct locations in the referent space (which was of constant size) served as an index of localization accuracy, and this performance score was calculated for the scaled and non-scaled conditions separately.
2.2.2 Proportional-reasoning task
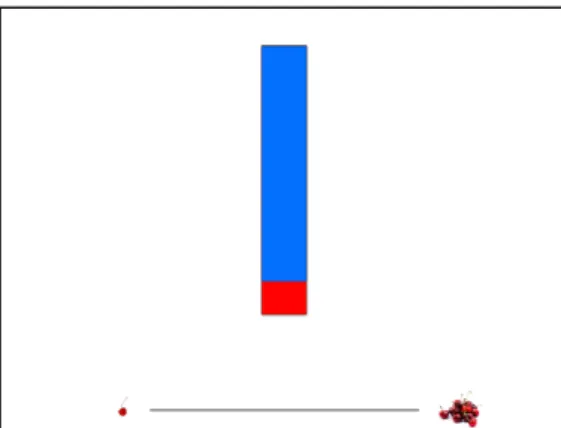
In the proportional-reasoning task (Möhring et al., 2016), the experimenter told the children a story about a bear who likes to drink mixtures of cherry juice and water. She explained that cherry juice is red, sweet, and made of cherries. On each trial, children saw two rectangles that were 2 cm wide and of varying height. One rectangle was red
rating scale on which they were asked to judge how much each cherry-water mixture would taste like cherry by positioning a small rubber peg. This rating scale consisted of a 12 cm horizontal line, which was anchored with a single cherry on the left (indicating a weak cherry taste) and a heap of cherries on the right (indicating a strong cherry taste, see Figure 1).
Figure 1. Example of a cherry juice and water mixture (presenting a proportion of 3 units of juice vs. 24 units of total amount) in the proportional-reasoning task.
The proportional-reasoning task used a functional measurement approach, based on information integration theory (Anderson, 1982). As is common in functional measurement (e.g., Möhring et al., 2016; Anderson & Cuneo, 1978), children were first familiarized with the anchors in three instruction trials. In the first instruction trial, the red area (cherry juice) encompassed 28/30 of the total area (the total amount of the juice mixture) and the
experimenter positioned the peg on the correct location on the rating scale. In the second (2/30) and third trial (22/30), children were asked to place the peg themselves and they received corrective feedback. In the subsequent test trials, children did not receive any feedback. In these trials, four levels of juice (3, 4, 5, 6 units) were systematically combined with four levels of total amount (6, 12, 18, 24 units), resulting in a total of 16 combinations. These combinations were presented twice in two blocks. Children saw the test trials in one of two random orders. The experimenter marked the responses, and the averaged absolute
deviation from the correct target locations (in mm) was used as an index for children’s proportional-reasoning skills.
2.2.3 Number-line task
Children were presented with target numbers (see Appendix) and were asked to indicate the position of these numbers on a number line by pointing to the correct locations (Siegler & Opfer, 2003). First, children were presented with a range of 0-20, followed by a range of 0-100, both printed on a DIN A4 paper. In line with previous research (Ebersbach et al., 2008), we used two different sets of numbers for the 0-100 range, and children were assigned to one of these sets (which corresponded to the one used in the spatial-localization task with regards to the presented locations and order). The experimenter marked children’s responses without giving feedback. Percent absolute error (PAE) was used as an indicator for children’s number-line estimation accuracy (Booth & Siegler, 2006). We report PAEs for the number range 0-20 and 0-100 separately, and in addition used a combined PAE as an index for children’s overall number-line performance, in order to ensure sufficient variance in the performance score across the entire age range.
2.2.4 Counting task
We used the counting-on test from Ebersbach and colleagues (2008; see also Hartnett & Gelman, 1998; Lipton & Spelke, 2005) as a measure of children’s number familiarity and understanding of the ordinal relation of whole numbers. For this test, the experimenter started to count aloud a series of two or three numbers that preceded a change in decade (e.g., 6, 7, 8) in the range of 0-100. Children were asked to continue counting beyond the decade change (e.g., 9, 10, 11). The percentage of correctly counted decade changes (out of a maximum of 10) was used as the dependent variable.
3. Results
As a measure of reliability, we calculated Guttman’s Lambda 2 (λ2, Guttman, 1942; Sijtsma, 2009) for each task. For the analyses investigating effects of age and condition on children’s accuracy, we scanned the data set for outliers in each task. Outliers were defined as values that were more than three standard deviations above or below the group mean. Such values were excluded (amounting to a total of 1.31% in the spatial-localization task, 1.34% in the proportional-reasoning task, and 2.18% in the number-line task) and data was then collapsed across all trials to obtain a measure for children’s mean absolute deviations in the spatial-localization and proportional-reasoning task. In the number-line task, children’s percentage of absolute error (PAE) in the number ranges 0-20 and 0-100 served as dependent variables. Preliminary analyses showed that neither the presented set of numbers or positions (A or B) nor the participants’ sex significantly affected performance in any of the tasks (all Fs < 3.82, all ps > .056). Thus, data were collapsed over these variables in the following analyses. In the following, a general characterization of children’s performance in each separate task will be reported first, followed by analyses of the relations between children’s performances in these tasks.
3.1 Spatial-localization performance
Reliability of the spatial-localization task was good (Guttman’s λ2 = 0.88). A repeated measure analysis of variance (ANOVA) was calculated, with scaling factor (scaled vs. non-scaled) as within-participant variable, and age group (3) as between-participants variable. The analysis revealed a significant effect of scaling factor, F(1, 62) = 28.60, p < .001, ηP2 = .32. Children produced larger deviations from the correct locations in scaled (M = 12.67, SE = 0.47) than in non-scaled trials (M = 9.45, SE = 0.39). Furthermore, the ANOVA yielded a significant effect of age group, F(2, 62) = 6.69, p < .01, ηP2 = .18 (for follow-up comparisons and means, see Table 1), but no interaction (F < 1.40, p > .25).
Table 1. Children’s mean deviations in the spatial-localization task (in mm), the proportional-reasoning task (absolute deviations in mm), mean percent absolute error (PAE, in %) in the number-line task, and their mean counting performance (in %) by age group. Standard deviations are presented in parentheses.
Age group
5 years 6 years 7 years Pair-wise comparisons
Task
Spatial localization: scaled (mm) 14.65 (4.08) 11.19 (3.34) 12.17 (3.69) a* Spatial localization: non-scaled (mm) 10.54 (3.17) 9.36 (2.35) 8.46 (3.73) - Proportional reasoning (mm) 24.53 (12.12) 16.11 (8.85) 12.73 (8.90) a*, b**
Counting (%) 26.5 (33.8) 70.5 (36.1) 89.0 (18.2) a***, b***
Number-line
PAE total 19.8 (5.8) 10.6 (5.1) 8.17 (5.2) a***, b***
PAE 0-20 14.3 (6.7) 7.5 (6.7) 6.67 (6.7) a**, b**
PAE 0-100 25.4 (8.0) 13.8 (5.6) 9.67 (5.3) a***, b***
Note. The last column shows Sidak-corrected pairwise comparisons between age groups; a = between 5 and 6 years, b = between 5 and 7 years, c = between 6 and 7 years of age; *** p < .001, ** p < .01, * p < .05.
3.2 Proportional-reasoning performance
Reliability of the proportional-reasoning task was very high (Guttman’s λ2 = 0.94). An ANOVA with children’s mean absolute deviations as dependent variable and age group (3) as between-participants variable revealed a significant effect of age group, F(2, 62) = 7.97, p < .01, ηP2 = .21 (for follow-up comparisons and means, see Table 1).
As the proportional-reasoning task used a functional measurement approach, we investigated children’s individual integration strategies and tested whether children indeed considered information about cherry juice and water and combined them in a proportional manner. Another (less normative) possibility is that children considered both liquids, but integrated them in a non-normative manner, by following a subtraction rule. A third way of solving the task is to center on one factor only, for example by considering the amount of cherry juice only while ignoring the amount of water in the mixture.
To investigate individual children’s integration strategies, we conducted ANOVAs on the individual level, which is an established procedure in studies using a functional
measurement approach (Anderson, 1982; Krist, Fieberg, & Wilkening, 1993). Cherry juice and total amount served as within-participant variables and children’s ratings on the cherry-taste scale were the dependent variable. By doing so, we were able to classify children into four groups: the ones who used a correct proportional integration rule (indicated by
significant main effects of juice and total amount as well as a significant interaction of juice and total amount in the ANOVA), the ones who used a subtractive integration rule
(significant main effects of juice and total amount only), the ones who focused onto one factor only (centration; one significant main effect only); and the ones who showed an unclear pattern (i.e., none of the above effects). In these individual analyses, the significance level was set to p < .1 to reduce the possibility of beta error (i.e., of missing that a participant considered a dimension). Results indicated that about one quarter of the 5-year-olds used the
correct proportional integration rule (see Table 2), which increased to about three-quarters by the age of 7 years. The use of the subtractive integration and centration rules remained the same across the different age groups, but unclassifiable integration patterns disappeared between ages 5 and 7. A 4 ´ 3 Chi-square test comparing the number of integration strategies in each of the three age groups confirmed that strategies differed significantly between the age groups, X2 (6, N = 65) = 10.83, p < .05 (one-tailed).
Table 2. Percentages of children showing particular integration strategies in the proportional-reasoning task.
Age group
5 years 6 years 7 years
Integration pattern in proportional-reasoning task
Proportional 23.1 55.0 68.4
Subtractive 34.6 15.0 21.1
Centration 7.7 15.0 10.5
3.3 Number-line task performance
Reliability of the number-line task was good for both number ranges (0-20: λ2 = 0.94; 0-100: λ2 = 0.88; both number ranges: λ2 = 0.90). A repeated measures ANOVA with PAE as dependent variable, number range as within-participant variable (2), and age group (3) as between-participants variable yielded a significant effect of number range, F(1, 62) = 48.61, p < .001, ηP2 = .44. Children produced more accurate estimations for the number range of 0-20 (M = 9.5%, SE = 0.8) as compared to the range of 0-100 (M = 16.3%, SE = 0.8). In addition, there was a significant effect of age group, F(2, 62) = 29.88, p < .001, ηP2 = .49, which was qualified by a significant interaction of age group and number range, F(2, 62) = 6.18, p < .01, ηP2 = .17. Five- and 6-year-olds’ performance differed significantly between number ranges (both ps < .01), but 7-year-olds’ performance did not (p = .1; for further follow-up comparisons and means, see Table 1).
To explore whether the pattern of children’s number-line estimations was best described by a linear or logarithmic model, by an unbounded power function, or by models supporting a proportional-judgment account, we calculated and compared different models based on children’s raw estimations for the 0-20 and 0-100 number range separately.
Calculations were performed using an Excel worksheet provided by E. Slusser and H. Barth (cf. Slusser et al., 2013; http://hbarth.faculty.wesleyan.edu/). In accordance with previous research (Barth & Paladino, 2011; Slusser et al., 2013), models supporting a proportional-judgment account included a one-cycle and a two-cycle version of the proportional power model. Model comparisons were based on the corrected Akaike Information Criterion (AICc), which is a measure that accounts for goodness of fit and model complexity, and is used when the number of data points is small (cf. Barth & Paladino, 2011; Slusser et al., 2013). We also report DAICc¾a measure that provides information about the strength of the preferred model in comparison to other models (Burnham & Anderson, 2002; for further information on
interpretation, see Table 3). Additionally, we included R2, as this measure has also often been
used in previous research. Data sets of children whose responses were uncorrelated with the presented numbers (p > .1) were excluded from the following model comparisons, as they were likely guessing (number range 0-20: 9 5-year-olds, one 6-year-old; number range 0-100: 16 5-year-olds).
3.3.1 Best-fitting model for the range 0-20
Five-year-olds’ number estimations were best explained by a one-cycle function at group level (see Figure 2, for children’s estimations per age group and number range), which was in line with what the majority of 5-year-olds showed at an individual level (see Table 3, for group and individual results per age group and number range). Six-year-olds’ number estimations were best explained by a linear model on the group level. However, at an individual level, most of the children’s estimations were best described by a one-cycle function or an unbounded power function. Seven-year-olds’ number estimations were best explained by a linear model at the group and individual level. Thus, in the range 0-20, the majority of 5- and 6-year-old children produced estimations in accordance with the proportional-judgment account.
3.3.2 Best-fitting model for the range 0-100
Five-year-olds’ number estimations were best explained by a logarithmic model at group level, which corresponded with the majority of individual analyses. Six-year-olds’ number estimations were best explained by a linear model at group level. However,
individual analyses showed that the majority of 6-year-olds produced estimations that were best explained by a one-cycle function. Seven-year-olds’ number estimations were best explained by a two-cycle function at group level, which was coherent with the majority of individual analyses. Therefore, in the range 0-100, the majority of 6- and 7-year-olds produced estimations that were in line with the proportional-judgment account.
Number range 0-100 Number range 0-20 E st im at ed num be r E st im at ed num be r E st im at ed num be r Presented number 5 years E st im at ed num be r E st im at ed num be r E st im at ed num be r Presented number 5 years 6 years 7 years 7 years 6 years
Figure 2. Median estimates (estimated locations on the number line) of the children aged 5, 6, and 7 years for each number range (0-20 and 0-100) in the number-line task. The dotted line shows a hypothetical perfect relation between presented and estimated numbers. The solid line represents the best fitting model on the group level.
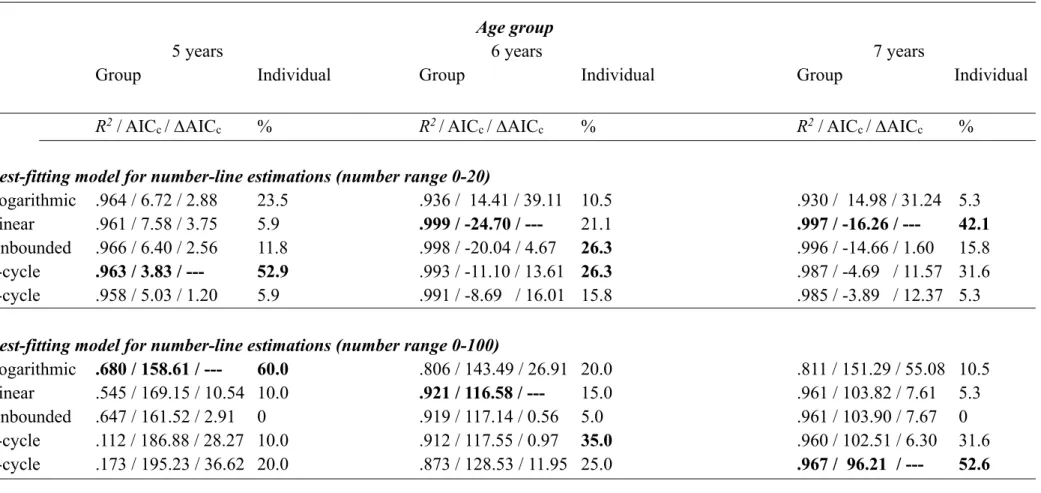
Table 3. Model fit (R2 / AICc / DAICc) on the group level for each age group and percentages of individual children (%) for which each model fits
best in the number-line task.
Age group
5 years 6 years 7 years
Group Individual Group Individual Group Individual
R2 / AICc / DAICc % R2 / AICc / DAICc % R2 / AICc / DAICc %
Best-fitting model for number-line estimations (number range 0-20)
Logarithmic .964 / 6.72 / 2.88 23.5 .936 / 14.41 / 39.11 10.5 .930 / 14.98 / 31.24 5.3
Linear .961 / 7.58 / 3.75 5.9 .999 / -24.70 / --- 21.1 .997 / -16.26 / --- 42.1
Unbounded .966 / 6.40 / 2.56 11.8 .998 / -20.04 / 4.67 26.3 .996 / -14.66 / 1.60 15.8 1-cycle .963 / 3.83 / --- 52.9 .993 / -11.10 / 13.61 26.3 .987 / -4.69 / 11.57 31.6 2-cycle .958 / 5.03 / 1.20 5.9 .991 / -8.69 / 16.01 15.8 .985 / -3.89 / 12.37 5.3
Best-fitting model for number-line estimations (number range 0-100)
Logarithmic .680 / 158.61 / --- 60.0 .806 / 143.49 / 26.91 20.0 .811 / 151.29 / 55.08 10.5 Linear .545 / 169.15 / 10.54 10.0 .921 / 116.58 / --- 15.0 .961 / 103.82 / 7.61 5.3 Unbounded .647 / 161.52 / 2.91 0 .919 / 117.14 / 0.56 5.0 .961 / 103.90 / 7.67 0 1-cycle .112 / 186.88 / 28.27 10.0 .912 / 117.55 / 0.97 35.0 .960 / 102.51 / 6.30 31.6 2-cycle .173 / 195.23 / 36.62 20.0 .873 / 128.53 / 11.95 25.0 .967 / 96.21 / --- 52.6 Note. The DAICc values indicate the difference scores in comparison to the model with the lowest AICc value. According to Burnham and Anderson (2002, p. 446), models with a D of 1-2 have substantial support and should be considered as well, models with a D of 4-7 have less support, and models with a D of 10 or more have no support and can be omitted.
3.4 Counting task performance
To investigate whether age groups differed in their counting performance, an
ANOVA was calculated with percent correct decade changes as dependent variable and age group (3) as between-participants variable. The ANOVA yielded a significant main effect of age group, F(2, 62) = 24.61, p < .001, ηP2 = .44 (for follow-up comparisons and means, see Table 1).
3.5 Relations between spatial localizations, proportional reasoning, number-line estimations, and counting
Because Kolmogorow-Smirnov tests revealed that the counting and number-line measures were not normally distributed, Spearman correlations were calculated. As can be seen in the age-controlled partial correlations in Table 4, children with higher accuracy in locating targets in the scaled version of the spatial-localization task performed more
accurately in the number-line task. By contrast, there were no correlations between the non-scaled version of the spatial-localization task and performance in any other task. Thus, the correlation between performance in the spatial-localization and the number-line tasks was limited to the version requiring scaling. Proportional reasoning was not related to spatial-scaling but to number-line performance. Counting performance, reflecting an understanding of the ordinal structure of whole numbers, was only related to number-line performance, in the sense that higher counting performance went along with less deviation in the number-line task. All of these three significant correlations between number-line performance and
counting, proportional reasoning, and spatial scaling that were outlined above were also significant if the two number ranges were analyzed separately (range 0-20: rs = .26 to -.50, all ps < .05; range 0-100: rs = .30 to -.57, all ps < .05).
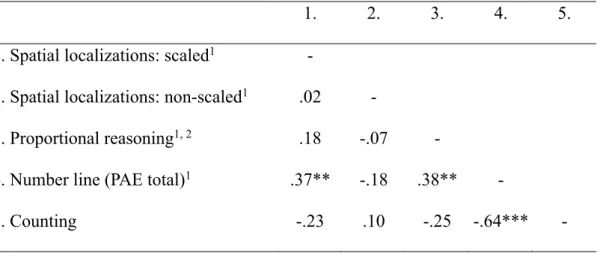
Table 4. Spearman partial correlations between spatial localizations for scaled and non-scaled trials, proportional reasoning, number-line performance, and counting, controlled for age.
1. 2. 3. 4. 5.
1. Spatial localizations: scaled1 -
2. Spatial localizations: non-scaled1 .02 -
3. Proportional reasoning1, 2 .18 -.07 -
4. Number line (PAE total)1 .37** -.18 .38** -
5. Counting -.23 .10 -.25 -.64*** -
Note.
1 Variables with inverse scoring (deviation measures)
2 If ipsatized measures of absolute deviations were used as an index for proportional-reasoning performance (cf. Möhring et al., 2015), the correlation with spatial localizations was significant for scaled trials, but not for non-scaled trials.
*** p < .001, ** p < .01, * p < .05.
To investigate the relative contributions of spatial scaling, proportional reasoning, and counting skills to number-line performance, we calculated a hierarchical regression analysis using bootstrapping (Efron & Tibshirani, 1993). More specifically, we tested whether scaling would add to the explained variance in number-line performance, even after age, counting skills, variance due to the shared methodology, and proportional-reasoning skills were accounted for. Therefore, age was entered in a first step, counting in a second step,
performance in the non-scaling version of the localization task (common method) in a third step, proportional reasoning in a fourth step, and performance in the scaled version of the localization task in a fifth step. Children’s number-line performance (PAE total) served as the outcome variable.
Collinearity diagnostics yielded variance inflation factors (VIF) smaller than 10 (ranging from 1.09 to 1.92; Myers, 1990) and tolerance values larger than 0.2 (ranging from 0.46 to 0.92; Menard, 1995), indicating that multicollinearity did not affect the analysis. As could be expected, age and counting explained significant parts of the variance in children’s number-line estimations (β = -.69 and β = -.67, respectively, for R2,see Table 5). The non-scaling localization performance (β = -.09, p = .22) and proportional reasoning (β = .01, p = .92) did not add to the explained variance. However, spatial scaling still increased the explained variance significantly, even after common method variance and proportional-reasoning skills were accounted for (β = .20, p < .05)1. Thus, even after controlling for children’s age, counting skills, common method variance, as well as their proportional thinking, their ability to scale spatial magnitudes still significantly predicted their number-line performance.
1 In two hierarchical regression analyses using children’s number-line performances for the number lines 0-20 and 0-100 as outcome variables, spatial scaling still increased the explained variance significantly after controlling for children’s age, counting skills, common method variance, and proportional reasoning. A significant contribution of spatial scaling was also revealed when children with an unclear integration pattern in the proportional-reasoning task were excluded (n = 12).
Table 5. Regression model with age, counting, spatial localizations for scaled and non-scaled trials, and proportional reasoning as predictor variables and children’s number-line
estimations as outcome variable.
Predictor variables β R2 total model (%) ΔR2
Step 1: age -.694*** 48.2
Step 2: counting -.670*** 71.5 23.4
Step 3: localizations for non-scaled trials -.086 72.2 0.6 Step 4: proportional reasoning .008 72.2 0 Step 5: localizations for scaled trials .201* 75.7 3.6 Note. Coefficients are standardized regression coefficients using bootstrapping or R2. *** p < .001, ** p < .01, * p < .05.
4. Discussion
The current study investigated the role of spatial scaling and proportional reasoning for the understanding of numerical magnitudes. We found considerable developmental progression in children’s spatial scaling, their ability to reason about proportions, to locate numbers on a line, as well as to count, with improvements particularly between 5 and 6 years of age (Booth & Siegler, 2006; Boyer et al., 2008; Ebersbach et al., 2008; Frick &
Newcombe, 2012; Slusser et al., 2013). Furthermore, there was large individual variance in every ability tested (Barth & Paladino, 2011; Jeong et al., 2007; Slusser et al., 2013), providing ideal preconditions to detect possible shared variance between these abilities. In line with previous research (Boyer & Levine, 2012; Frick & Newcombe, 2012; Vasilyeva & Huttenlocher, 2004), children in all age groups produced larger errors in the scaled version of
the spatial-localization task than in the non-scaled version, which is consistent with previous findings (Frick & Newcombe, 2012; Möhring et al., 2014, 2016).
Crucially, we found important links between children’s spatial scaling and their number-line estimations. Regardless of age, children with higher spatial-scaling skills estimated the magnitudes of whole numbers more accurately. Children’s accuracy in
estimating numbers was also related to their proportional-reasoning skills. However, results showed no significant relation between proportional reasoning and spatial scaling, which contrasts previous findings in 4- to 5-year-olds (Möhring et al., 2015). A reason for this non-significant finding may be due to a change in children’s strategy use in spatial-scaling tasks across development (Möhring et al., 2015). There was also no evidence of a connection between spatial scaling and children’s counting skills. Counting was only related to children’s number-line performance, presumably because both tasks require symbolic number
knowledge. Therefore, our results do not support a general relation between spatial scaling and any mathematical skill but imply a specific relation between spatial scaling and number-line performance.
The present data also showed a remarkable developmental progression in children’s performance on the number-line task. Children of all age groups performed almost perfectly for the number range of 0-20 (see Figure 2). Nevertheless, individual curve estimations indicated that in this familiar number range many 5- and 6-year-olds produced estimation patterns that were in line with a one- or two-cycle power function, indicating partitioning the number line in accordance with a proportional-judgment strategy (Barth & Paladino, 2011; Slusser et al., 2013) and the Category-Adjustment Model (Huttenlocher, Hedges, & Duncan, 1991; Huttenlocher, Newcombe, & Sandberg, 1994). At seven years of age, children
produced the normative linear pattern in the familiar number range 0-20 as evidenced by analyses on a group and individual level. For the more unfamiliar number range 0-100, the
group of 5-year-olds showed less sophisticated number knowledge by producing estimates that were coherent to a logarithmic pattern (i.e., large over-estimations in the low-number range), and this was also the most frequent strategy on an individual level. However, 6- and 7-year-olds mainly produced estimations that were best explained by one- or two-cycle power functions implying proportional-judgment strategies. This suggests that a majority of children mentally subdivided the number line and used reference points like the midpoint to locate numbers more accurately on the line. In addition, data of the present study indicated a developmental progression in children’s ability to use such mental reference points (cf. Slusser et al., 2013, for similar findings), which may have contributed to the increasing precision of number localizations with age.
To clarify the role of such proportional strategies for the connection between spatial scaling and number-line performance, we calculated a hierarchical regression. We accounted for children’s counting skills (reflecting their basic familiarity with numbers and
understanding of the ordinal number system), their performance in the non-scaled version of the spatial localization task (thus accounting for common variance due to methodological similarities), and their ability to reason about proportions. Even after controlling for all of these variables, spatial scaling still explained a significant part of the variance in children’s number-line performance. This finding indicates that the connection between spatial scaling and number-line performance cannot merely be explained by proportional thinking. It also rules out that the predictive power of scaling was due to methodological similarities between the localization task and number-line task per se (e.g., locating targets in a rectangle or on a line). Above and beyond such similarities in the surface structures of the tasks, the scaling component of the spatial-localization task explained a significant part in children’s ability to estimate magnitudes in the number-line task.
One reason for this close connection between spatial-scaling and number-line performance may be that children have to mentally adjust magnitudes in both tasks. That is, in the number-line task, children had to understand the numerical magnitude of a presented number, and to flexibly map this magnitude onto the presented number range. A similar flexibility may also be required during spatial scaling. In the scaled version of the spatial-localization task, children had to encode spatial information presented in small maps and to flexibly transform this magnitude information to match it to a larger referent space.
Therefore, the ability to flexibly transform magnitude information may serve as an important linkage connecting spatial scaling and number-line performance (cf. Mix & Cheng, 2012, for a similar argument in the context of perspective taking).
Overall, our finding of a relation between children’s spatial scaling and number-line estimations is in line with the notion of a close link between spatial and mathematical thinking (Mix & Cheng, 2012; Newcombe et al., 2015). Moreover, this finding is coherent with a proposition made by the U.S. National Research Council (2012), that in particular an understanding of size and scale is closely related to mathematical reasoning. Our results indicate a specific connection between spatial scaling and number-line estimations that cannot be fully explained by proportional-reasoning skills, but may also be driven by the ability to flexibly transform magnitudes. Future research may further investigate whether children’s ability to mentally transform spatial information might play a foundational role for their success in mathematics.
Acknowledgements
This research was supported by research grants from the US National Science
Foundation #SBE-0541957 and SBE-1041707 and a Research Grant from the Swiss National Science Foundation # PZ00P1_131866. We are grateful to Elsbeth Stern and Christoph Hölscher for kindly hosting WM as a guest scientist at ETH Zurich and providing helpful suggestions on the present study design. We also wish to thank the primary schools Gallispitz in Winterthur, d’Insle in Zurich, as well as the Kihz Stiftung of the ETH for their generous support of the present study.
References
Anderson, N. H. (1982). Methods of information integration theory. New York: Academic Press.
Anderson N. H., & Cuneo, D. O. (1978). The height + width rule in children's judgments of quantity. Journal of Experimental Psychology: General, 107, 335-378.
Aunola, K., Leskinen, E., Lerkkanen, M.-K. & Nurmi, J.-E. (2004). Developmental dynamics of math performance from preschool to grade 2. Journal of Educational Psychology, 96, 699-713.
Barth, H. C., & Paladino, A. M. (2011). The development of numerical estimation: Evidence against a representational shift. Developmental Science, 14, 125–135.
Booth, J. L., & Siegler, R. S. (2006). Developmental and individual differences in pure numerical estimation. Developmental Psychology, 41, 189–201.
Booth, J. L., & Siegler, R. S. (2008). Numerical magnitude representations influence arithmetic learning. Child Development, 79, 1016-1031.
Boyer, T. W., & Levine, S. C. (2012). Child proportional scaling: Is 1/3 = 2/6 = 3/9 = 4/12? Journal of Experimental Child Psychology, 111, 516-533.
Boyer, T. W., Levine, S. C., & Huttenlocher, J. (2008). Development of proportional reasoning: Where young children go wrong. Developmental Psychology, 44, 1478-1490.
Burnham, K. P., & Anderson, D. R. (2002). Model selection and multimodel inference. A practical information-theoretic approach. New York: Springer.
Casey, M. B., Nuttall, R. L., Pezaris, E., & Benbow, C. P. (1995). The influence of spatial ability on gender differences in math college entrance test scores across diverse samples. Developmental Psychology, 31, 697–705.
between the shape of the mental number line and familiarity with numbers in 5-to 9-year old children: evidence for a segmented linear model. Journal of Experimental Child Psychology, 99, 1–17.
Efron, B., & Tibshirani, R. J. (1993). An introduction to the bootstrap. New York: Chapman & Hall.
Frick, A., & Newcombe, N. S. (2012). Getting the big picture: Development of spatial scaling abilities. Cognitive Development, 27, 270-282.
Geary, D. C., Hoard, M. K., Byrd-Craven, J., Nugent, L., & Numtee, C. (2007). Cognitive mechanisms underlying achievement deficits in children with mathematical learning disability. Child Development, 78, 1343-1359.
Gunderson, E. A., Ramirez, G., Beilock, S. L., & Levine, S. C. (2012). The relation between spatial skill and early number knowledge: The role of the linear number line.
Developmental Psychology, 48, 1229-1241.
Hartnett, P., & Gelman, R. (1998). Early understandings of numbers: Paths or barriers to the construction of new understandings? Learning and Instruction, 8, 341–374.
Hegarty, M., & Kozhevnikov, M. (1999). Types of visual–spatial representations and mathematical problem solving. Journal of Educational Psychology, 91, 684–689. Huttenlocher, J., Hedges, L. V., & Duncan, S. (1991). Categories and particulars: Prototype
effects in estimating spatial location. Psychological Review, 98, 352–376.
Huttenlocher, J., Newcombe, N. S., & Sandberg, E. (1994). The coding of spatial location in young children. Cognitive Psychology, 27, 115–147.
Huttenlocher, J., Newcombe, N. S., & Vasilyeva, M. (1999). Spatial scaling in young children. Psychological Science, 10, 393-398.
Jeong, Y., Levine, S. C., & Huttenlocher, J. (2007). The development of proportional reasoning: Effect of continuous vs. discrete quantities, Journal of Cognition and Development, 8, 237-256.
Kell, H. J., Lubinski, D., Benbow, C. P., & Steiger, J. H. (2013). Creativity and technical innovation: Spatial ability’s unique role. Psychological Science, 24, 1831-1836. Krist, H., Fieberg, E. L., & Wilkening, F. (1993). Intuitive physics in action and judgment:
The development of knowledge of projectile motion. Journal of Experimental Psychology: Learning, Memory, and Cognition, 19, 952-966.
Kyttälä, M., Aunio, P., Lehto, J. E., van Luit, J., & Hautamäki, J. (2003). Visuospatial working memory and early numeracy. Educational and Child Psychology, 20, 65-76. Kyttälä, M., & Lehto, J. (2008). Some factors underlying mathematical performance: The
role of visuospatial working memory and non-verbal intelligence. European Journal of Psychology of Education, XXII(1), 77–94.
Landy, D., Silbert, N., & Goldin, A. (2013). Estimating Large Numbers. Cognitive Science, 37, 775-799.
Lauer, J. E., & Lourenco, S. F. (2016). Spatial processing in infancy predicts both spatial and mathematical aptitude in childhood. Psychological Science, 27, 1291-1298.
LeFevre, J. A., Lira, C. J., Sowinski, C., Cankaya, O., Kamawar, D., & Skwarchuk, S. L. (2013). Charting the role of the number line in mathematical development. Frontiers in Psychology, 4:641.
Link, T., Huber, S., Nuerk, H.-C., & Moeller, K. (2014). Unbounding the mental number line - new evidence on children’s spatial representation of numbers. Frontiers in
Psychology, 4:1021.
Lipton, J. S., & Spelke, E. S. (2005). Preschool children’s mapping of number words to nonsymbolic numerosities. Child Development, 76, 978–988.
Menard, S. (1995). Applied logistic regression analysis. Sage university paper series on quantitative applications in the social sciences, 07-106. Thousand Oaks, CA: Sage. Mix, K. S., & Cheng, Y. L. (2012). The relation between space and math: Developmental and
educational implications. Advances in Child Development and Behavior, 42, 197-243. Mix, K. S., Levine, S. C., Cheng, Y. L., Young, C., Hambrick, D. Z., Ping, R., &
Konstantopoulos, S. (2016). Separate but correlated: The latent structure of space and mathematics across development. Journal of Experimental Psychology: General, 145, 1206-1227.
Möhring, W., Newcombe, N. S., & Frick, A. (2014). Zooming in on spatial scaling: Preschool children and adults use mental transformations to scale spaces. Developmental Psychology, 50, 1614-1619.
Möhring, W., Newcombe, N. S., & Frick, A. (2015). The relation between spatial thinking and proportional reasoning in preschoolers. Journal of Experimental Child
Psychology, 132, 213-220.
Möhring, W., Newcombe, N. S., & Frick, A. (2016). Adults use mental transformation strategies for spatial scaling: Evidence from a discrimination task. Journal of Experimental Psychology: Learning, Memory, and Cognition , 42, 1473-1479. Möhring, W., Newcombe, N. S., Levine, S. C., & Frick, A. (2016). Spatial proportional
reasoning is associated with formal knowledge about fractions. Journal of Cognition and Development, 17, 67-84.
Moeller K., Pixner S., Kaufmann L., & Nuerk H.-C. (2009). Children’s early mental number line: logarithmic or decomposed linear? Journal of Experimental Child Psychology, 103, 503–515.
Myers, R. (1990). Classical and modern regression with applications (2nd ed.). Boston, MA: Duxbury.
National Research Council (2012). A Framework for K-12 Science Education: Practices, Crosscutting Concepts, and Core Ideas. Committee on a Conceptual Framework for New K-12 Science Education Standards. Board on Science Education, Division of Behavioral and Social Sciences and Education. Washington, DC: The National Academies Press.
Newcombe, N. S., Levine, S. C., & Mix, K., S. (2015). Thinking about quantity: the intertwined development of spatial and numerical cognition. WIREs Cogn Sci, 6: 491–505.
Opfer, J. E., & Siegler, R. S. (2007). Representational change and children's numerical estimation. Cognitive Psychology, 55, 169-195.
Reuhkala, M. (2001). Mathematical skills in ninth-graders: Relationship with visuo-spatial abilities and working memory. Educational Psychology, 21, 387–399.
Rips, L. J. (2013). How many is a zillion? Sources of number distortion. Journal of Experimental Psychology: Learning, Memory, and Cognition, 39, 1257-1264. Shea, D. L., Lubinski, D., & Benbow, C. P. (2001). Importance of assessing spatial ability in
intellectually talented young adolescents: A 20-year longitudinal study. Journal of Educational Psychology, 93, 604-614.
Shepard, R. N., & Metzler, J. (1971). Mental rotation of three-dimensional objects. Science, 171, 701-703.
Siegler, R. S., & Booth, J. L. (2004). Development of numerical estimation in young children. Child Development, 75, 428–444.
Siegler, R. S., & Opfer, J. E. (2003). The development of numerical estimation evidence for multiple representations of numerical quantity. Psychological Science, 14, 237-250.
Slusser, E., Santiago, R., & Barth, H. (2013). Developmental change in numerical estimation. Journal of Experimental Psychology: General, 142, 193-208.
Thompson, C. A., & Opfer, J. E. (2010). How 15 hundred is like 15 cherries: Effect of progressive alignment on representational changes in numerical cognition. Child Development, 81, 1768-1786.
Vasilyeva, M., & Huttenlocher, J. (2004). Early development of scaling ability. Developmental Psychology, 40, 682-690.
Verdine, B. N., Golinkoff, R. M, Hirsh-Pasek, K., & Newcombe, N. S., (in press). Links between spatial and mathematical skills across the preschool years. Monographs of the Society for Research in Child Development.
Wai, J., Lubinski, D., & Benbow, C. (2009). Spatial ability for STEM domains: Aligning over 50 years of cumulative psychological knowledge solidifies its importance. Journal of Educational Psychology, 101, 817-835.
Appendix
Numerical stimuli in the number-line task and the corresponding spatial locations in the spatial localization task (in cm from the left border).
Numerical range
0-20 0-100
Series A Series B
Numbers Numbers Spatial locations Numbers Spatial locations
2 5 1 2 0.4 3 11 2.2 8 1.6 4 18 3.6 15 3 6 25 5 22 4.4 8 33 6.6 30 6 12 40 8 37 7.4 14 46 9.2 43 8.6 16 52 10.4 49 9.8 17 58 11.6 55 11 18 65 13 62 12.4 71 14.2 68 13.6 78 15.6 75 15 85 17 82 16.4 93 18.6 90 18 99 19.8 96 19.2