2771 Semina: Ciências Agrárias, Londrina, v. 40, n. 6, p. 2771-2782, nov./dez. 2019
Received: Oct. 19, 2018 - Approved: Apr. 14, 2019
Use of indigestible markers to estimate the apparent dry matter
digestibility of diets containing a cocoa by-product
Indicadores na estimativa da digestibilidade aparente em dietas com
inclusão de coproduto do cacau
Mércia Regina Pereira de Figueiredo
1*; Eloisa de Oliveira Simões Saliba
2; Geraldo
Sérgio Senra Carneiro Barbosa
3; Filipe Aguiar e Silva
4; Andressa Nathalie Nunes
4;
Cecília Ribeiro da Mota e Silva
4; Guilherme Rocha Moreira
5Abstract
Fecal production and apparent dry matter digestibility (ADMD) were evaluated using external markers (chromium oxide; titanium dioxide; isolated, purified, and enriched lignin (LIPE®); and isolated,
purified, and enriched lignin nanoparticles (NANOLIPE®) and internal markers (indigestible DM
(IDM), indigestible neutral detergent fiber (INDF), and indigestible acid detergent fiber (IADF) in diets based on Tifton 85 bermuda grass (Cynodon sp.) hay containing different concentrations of a cocoa by-product. Sixteen crossbred (Holstein × Zebu) dairy heifers with a mean live weight of 363.00 ± 27.70 kg were evaluated and distributed in a completely randomized block design with a split-plot arrangement. The plots corresponded to the diets, which differed in the substitution of bermuda grass hay with different concentrations (0, 8, 16, and 24% of DM) of the cocoa by-product, whereas the split-plots represented the indigestible markers. Chromic oxide, LIPE®, NANOLIPE®, and INDF accurately
estimated ADMD and fecal production whereas titanium dioxide, IDM, and IADF did not accurately estimate these parameters.
Key words: Total collection method. Markers. Chromic oxide. Fecal production. Accuracy.
Resumo
Foram avaliados a produção fecal e a digestibilidade dos nutrientes com o uso de indicadores externos (óxido crômico, dióxido de titânio, lignina isolada, purificada e enriquecida - LIPE® e lignina isolada,
purificada e enriquecida em nanopartículas -NANOLIPE®) e internos (matéria seca indigestível - MSi,
fibra em detergente neutro indigestível - FDNi e fibra em detergente ácido indigestível -FDAi) em dietas a base de feno de capim tifton 85 com inclusão de coproduto de cacau. Foram utilizadas dezesseis novilhas leiteiras mestiças Holandês X Zebu, peso vivo médio (363,00 ± 27,70 kg), distribuídas em delineamento inteiramente casualizado com arranjo em parcelas subdivididas. As dietas oferecidas foram as parcelas, que se diferenciavam quanto à substituição do feno de capim Tifton 85 (Cynodon sp)
1 Pesquisadora, Instituto Capixaba de Pesquisa, Assistência Técnica e Extensão Rural, CPDI Norte, Linhares, ES, Brasil. E-mail:
merreg5@gmail.com
2 Profª, Universidade Federal de Minas Gerais, UFMG, Escola de Veterinária, Departamento de Zootecnia, Belo Horizonte, MG,
Brasil. E-mail: saliba@vet.ufmg.br
3 Prof., Universidade Federal de Viçosa, UFV, Campus Florestal, Florestal, MG, Brasil. E-mail: geraldobarbosa@yahoo.com 4 Drs. em Zootecnia, UFMG, Escola de Veterinária, Departamento de Zootecnia, Belo Horizonte, MG, Brasil. E-mail: aguiar.
filipe@gmail.com; natydressa2009@hotmail.com; mota_cecilia@yahoo.com.br
5 Prof., Universidade Federal Rural de Pernambuco, UFRPE, Programa de Pós-Graduação em Biometria e Estatística Aplicada,
Recife, PE, Brasil. E-mail: guirocham@gmail.com
2772
Semina: Ciências Agrárias, Londrina, v. 40, n. 6, p. 2771-2782, nov./dez. 2019
pelo coproduto do cacau em diferentes níveis (0, 8, 16 e 24% da MS) e, os indicadores, as subparcelas. Os indicadores óxido crômico, LIPE®, NANOLIPE® e FDNi estimaram com acurácia e precisão a
digestibilidade aparente dos nutrientes e a produção fecal. Os indicadores dióxido de titânio, MSi e a FDAi foram ineficientes para estimar esses parâmetros.
Palavras-chave: Coleta total. Marcadores. Óxido crômico. Produção fecal. Acurácia.
Introduction
The nutritional value of the forage consumed by animals needs to be determined when assessing the efficiency of animal production systems. Forage quality is determined by nutrient digestibility and consumption. Digestibility measures are used to determine the nutritional value of forage and indicate the amount of each nutrient that can be used by the animal. Mertens (1994) and Van Soest (1994) have shown that forage consumption is the main influencing factor for animal performance because it is directly related to nutrient intake and therefore is essential for assessing nutritional requirements.
Total fecal collection (TC) is used as a reference method in nutrient consumption and digestibility tests. However, the high cost, long evaluation period, need for continuous labor, need for large sample size, extended time to adapt to the diet, and strict control of feed intake and excretion make indigestible markers a feasible option for this purpose (POMBO et al., 2016).
Indigestible markers (IMs) are compounds present in a feed (internal) or added to feed (external) and are not absorbed or digested in the gastrointestinal tract of animals (OWENS; HANSON, 1992). These indicators are supplied to the animals via diet and should be fully recovered in the feces (ITURBIDE, 1967).
The external marker (EM) chromium oxide (CO) is the most used in the literature (COSTA et al., 2018; SCHAAFSTRA et al., 2019). Studies on the EMs titanium dioxide (TD) (COSTA et al., 2018; SCHAAFSTRA et al., 2019) and isolated, purified, and enriched lignin nanoparticles (NANOLIPE®)
(MOSS et al., 2017) are promising; however, further studies with different animal species and diets are needed. The EM Isolated, Purified, and Enriched
Lignin (LIPE®) was used in several animal species
(MARCONDES et al., 2008; FERREIRA et al., 2009; LANZETTA et al., 2009).
IMs are natural constituents of animal feed, including silica, acid-insoluble ash, lignin, fecal nitrogen, indigestible dry matter (IDM), indigestible neutral detergent fiber (INDF), and indigestible acid detergent fiber (IADF) (KOZLOSKI et al., 2009; LEE; HRISTOV, 2013; ALVES et al., 2016; MAGALHÃES et al., 2018). The results using known indicators may vary because of the adoption of different analytical techniques, partial fecal recovery rates, and different responses to diets, among other reasons, leading to precision errors in digestibility estimates.
Fecal production, apparent dry matter digestibility, and the accuracy and precision of EMs and IMs were evaluated in diets based on Tifton 85 bermuda grass hay containing different concentrations of a cocoa by-product in dairy heifers.
Materials and Methods
This study was carried out in accordance with the Ethical Principles of Animal Experimentation established by the Animal Research Ethics Committee of the Federal University of Minas Gerais (Comitê de Ética em Experimentação Animal da Universidade Federal de Minas Gerais–CETEA/ UFMG) under Protocol No. 225/2015.
The study was performed in the facilities of the Agricultural Education and Development Center of the Federal University of Viçosa (Universidade Federal de Viçosa–UFV), located in Florestal, Minas Gerais, Brazil. Sixteen crossbred (Holstein × Zebu) heifers with a mean weight of 363.00 ±
2773 Semina: Ciências Agrárias, Londrina, v. 40, n. 6, p. 2771-2782, nov./dez. 2019
27.70 kg were identified, weighed, dewormed, and individually housed in cement-floor pens.
The study period was 17 days, including 12 days of adaptation to the diets, animal husbandry, and rearing facilities, and 5 days of TC. The animals were fed daily and were equally divided into two groups, such that one group was fed at 7h00 a.m. and the other group was fed at 4h00 p.m. Leftovers
were collected daily in the morning, weighed, and the amount of supplemented feed was adjusted to leave 10–15% of leftovers in the troughs.
The diets were based on Tifton 85 bermuda grass hay, corn meal, and different dry matter (DM) concentrations (0, 8, 16, and 24%) of a cocoa by-product (CB). The percentage compositions and chemical analyses are presented in Table 1.
Table 1. Percentage of ingredients (g kg-1) based on the dry matter and chemical composition of experimental diets
containing increasing levels of a cocoa by-product.
Ingredients Diets (%)
0 8 16 24
Tifton 85 bermuda grass hay 790.00 710.00 620.00 530.00
Corn meal 180.00 180.00 190.00 200.00
Cocoa by-product 0.00 80.00 160.00 240.00
Urea + ammonium sulfate 10.00 10.00 10.00 10.00
Vitamins/minerals 20.00 20.00 20.00 20.00
Total 1000.00 1000.00 1000.00 1000.00
Chemical composition of diets
Dry matter 870.00 820.10 770.20 722.20
Mineral matter 50.00 54.90 59.10 63.20
Crude protein 97.00 98.00 100.00 101.00
Neutral detergent fiber 642.40 641.50 633.90 626.10
Acid detergent fiber 320.10 336.80 349.80 362.80
Lignin 25.20 45.80 65.80 86.00
Ether extract 15.70 18.40 19.20 20.00
Total digestible nutrients (%) 657.20 612.40 641.30 572.30
Fecal production (FP) was estimated using the EMs CO; TD; isolated, purified, and enriched lignin (LIPE®; modified and enriched hydroxyphenylpropane [P2S2], Florestal, Minas Gerais, Brazil); and isolated, purified, and enriched lignin nanoparticles (NANOLIPE®) (P2S2; Florestal, Minas Gerais, Brazil) and the IMs IDM, INDF, and IADF.
CO and TD were mixed to the diet at the dosage of ten grams animal-1 day-1 for 12 days, including seven days of dietary adaptation and five days of TC. LIPE® and NANOLIPE® were administered
as capsules at the dosage of 500 mg animal-1 day-1. LIPE® was administered for seven days, including two days of adaptation and five days of TC, and NANOLIPE® was administered for two days, including one day of adaptation and one day of TC. IDM, INDF, and IADF were determined in samples of feed, leftovers, and feces. The samples were milled in a Willey type mill with a 1-mm sieve and transferred to non-woven fabric bags (size, 4 × 5 cm; density, 100 g per cm2) at the concentration of 20 mg of DM per cm2 of surface (NOCEK, 1988). The samples were incubated in the rumen of two male
2774
Semina: Ciências Agrárias, Londrina, v. 40, n. 6, p. 2771-2782, nov./dez. 2019 adult bovine animals for 264h00, as suggested by
Casali et al. (2008), to obtain indigestible fractions in situ.
The bags were removed from the rumen, washed with running water, dried in forced ventilation oven, and used for IDM quantification. INDF and IADF were determined by washing the bags with a neutral
and acid detergent solution, respectively. After that, the bags were dried in an oven at 55 °C, weighed, and used for quantifying indigestible fractions.
The general equation for calculating FP (kg day-1 of DM) using external and IMs was based on the ratio between the amount of marker ingested by each animal and its concentration in the feces:
The CO concentration was analyzed in fecal samples by atomic absorption spectrophotometry according to the methodology described by Silva and Queiroz (2002). TD content was determined according to Myers et al. (2004) using colorimetry-based molecular electron spectroscopy. LIPE® was
evaluated by near-infrared spectroscopy in a FTIR
The general equation for calculating FP (kg day-1 of DM) using external and IMs was based on the
ratio between the amount of marker ingested by each animal and its concentration in the feces
The CO concentration was analyzed in fecal samples by atomic absorption spectrophotometry according to the methodology described by Silva and Queiroz (2002). TD content was determined according to Myers et al. (2004) using colorimetry-based molecular electron spectroscopy. LIPE was evaluated by near-infrared spectroscopy in a FTIR equipment. NANOLIPE was analyzed by infrared spectroscopy with Fourier transform according to Saliba et al. (2015).
The ADMD coefficients of nutrients using external and IMs were calculated according to Silva and Leão (1979), as follows:
The fecal recovery rate of each marker was measured according to Lanzetta et al. (2009):
The accuracy, precision, and robustness of these substances to estimate the ADMD were evaluated according to Kohn et al. (1998). Accuracy was evaluated by the mean bias, which is the difference between the value predicted by the indicator and the value measured by TC. The mean bias was calculated as follows:
Precision is a measure of the dispersion between predicted and measured values, i.e., the mean variability in the difference between predicted and measured values. Precision can be measured by the root mean square error of prediction (RMSEP):
√ (
The residual error is also referred to as the prediction error, excluding the mean bias, and is obtained by the equation:
√ (
The Shapiro-Wilk test was used to assess the normality of residuals, and the Hartley test was used The general equation for calculating FP (kg day-1 of DM) using external and IMs was based on the
ratio between the amount of marker ingested by each animal and its concentration in the feces
The CO concentration was analyzed in fecal samples by atomic absorption spectrophotometry according to the methodology described by Silva and Queiroz (2002). TD content was determined according to Myers et al. (2004) using colorimetry-based molecular electron spectroscopy. LIPE was evaluated by near-infrared spectroscopy in a FTIR equipment. NANOLIPE was analyzed by infrared spectroscopy with Fourier transform according to Saliba et al. (2015).
The ADMD coefficients of nutrients using external and IMs were calculated according to Silva and Leão (1979), as follows:
The fecal recovery rate of each marker was measured according to Lanzetta et al. (2009):
The accuracy, precision, and robustness of these substances to estimate the ADMD were evaluated according to Kohn et al. (1998). Accuracy was evaluated by the mean bias, which is the difference between the value predicted by the indicator and the value measured by TC. The mean bias was calculated as follows:
Precision is a measure of the dispersion between predicted and measured values, i.e., the mean variability in the difference between predicted and measured values. Precision can be measured by the root mean square error of prediction (RMSEP):
√ (
The residual error is also referred to as the prediction error, excluding the mean bias, and is obtained by the equation:
√ (
The Shapiro-Wilk test was used to assess the normality of residuals, and the Hartley test was used equipment. NANOLIPE® was analyzed by infrared
spectroscopy with Fourier transform according to Saliba et al. (2015).
The ADMD coefficients of nutrients using external and IMs were calculated according to Silva and Leão (1979), as follows:
The fecal recovery rate of each marker was measured according to Lanzetta et al. (2009):
The accuracy, precision, and robustness of these substances to estimate the ADMD were evaluated according to Kohn et al. (1998). Accuracy was evaluated by the mean bias, which is the difference
between the value predicted by the indicator and the value measured by TC. The mean bias was calculated as follows:
Precision is a measure of the dispersion between predicted and measured values, i.e., the mean variability in the difference between predicted and
measured values. Precision can be measured by the root mean square error of prediction (RMSEP):
The residual error is also referred to as the
prediction error, excluding the mean bias, and is obtained by the equation:
oven, and used for IDM quantification. INDF and IADF were determined by washing the bags with a neutral and acid detergent solution, respectively. After that, the bags were dried in an oven at 55 °C, weighed, and used for quantifying indigestible fractions.
The general equation for calculating FP (kg day-1 of DM) using external and IMs was based on the
ratio between the amount of marker ingested by each animal and its concentration in the feces:
The CO concentration was analyzed in fecal samples by atomic absorption spectrophotometry according to the methodology described by Silva and Queiroz (2002). TD content was determined according to Myers et al. (2004) using colorimetry-based molecular electron spectroscopy. LIPE was evaluated by near-infrared spectroscopy in a FTIR equipment. NANOLIPE was analyzed by infrared spectroscopy with Fourier transform according to Saliba et al. (2015).
The ADMD coefficients of nutrients using external and IMs were calculated according to Silva and Leão (1979), as follows:
The fecal recovery rate of each marker was measured according to Lanzetta et al. (2009):
The accuracy, precision, and robustness of these substances to estimate the ADMD were evaluated according to Kohn et al. (1998). Accuracy was evaluated by the mean bias, which is the difference between the value predicted by the indicator and the value measured by TC. The mean bias was calculated as follows:
Precision is a measure of the dispersion between predicted and measured values, i.e., the mean variability in the difference between predicted and measured values. Precision can be measured by the root mean square error of prediction (RMSEP):
√
The residual error is also referred to as the prediction error, excluding the mean bias, and is obtained by the equation:
√ (
The Shapiro-Wilk test was used to assess the normality of residuals, and the Hartley test was used to evaluate the homogeneity of variances. The Kruskal-Wallis non-parametric test with Dunn’s post-hoc test was used to evaluate the residual error of the markers.
The study used a completely randomized block design with a split-plot arrangement. The plots oven, and used for IDM quantification. INDF and IADF were determined by washing the bags with a neutral and acid detergent solution, respectively. After that, the bags were dried in an oven at 55 °C, weighed, and used for quantifying indigestible fractions.
The general equation for calculating FP (kg day-1 of DM) using external and IMs was based on the
ratio between the amount of marker ingested by each animal and its concentration in the feces:
The CO concentration was analyzed in fecal samples by atomic absorption spectrophotometry according to the methodology described by Silva and Queiroz (2002). TD content was determined according to Myers et al. (2004) using colorimetry-based molecular electron spectroscopy. LIPE was evaluated by near-infrared spectroscopy in a FTIR equipment. NANOLIPE was analyzed by infrared spectroscopy with Fourier transform according to Saliba et al. (2015).
The ADMD coefficients of nutrients using external and IMs were calculated according to Silva and Leão (1979), as follows:
The fecal recovery rate of each marker was measured according to Lanzetta et al. (2009):
The accuracy, precision, and robustness of these substances to estimate the ADMD were evaluated according to Kohn et al. (1998). Accuracy was evaluated by the mean bias, which is the difference between the value predicted by the indicator and the value measured by TC. The mean bias was calculated as follows:
Precision is a measure of the dispersion between predicted and measured values, i.e., the mean variability in the difference between predicted and measured values. Precision can be measured by the root mean square error of prediction (RMSEP):
√ (
The residual error is also referred to as the prediction error, excluding the mean bias, and is obtained by the equation:
√ (
The Shapiro-Wilk test was used to assess the normality of residuals, and the Hartley test was used to evaluate the homogeneity of variances. The Kruskal-Wallis non- w h D ’ -hoc test was used to evaluate the residual error of the markers.
The study used a completely randomized block design with a split-plot arrangement. The plots consisted of the treatments (diets), and the split plots corresponded to the indicators. Data were analyzed using the Sisvar program (FERREIRA, 2011). The data were subjected to analysis of variance and regression, and the means were compared using the Student-Newman-Keuls test (p<0.05).
2775 Semina: Ciências Agrárias, Londrina, v. 40, n. 6, p. 2771-2782, nov./dez. 2019
The Shapiro-Wilk test was used to assess the normality of residuals, and the Hartley test was used to evaluate the homogeneity of variances. The Kruskal-Wallis non-parametric test with Dunn’s post-hoc test was used to evaluate the residual error of the markers.
The study used a completely randomized block design with a split-plot arrangement. The plots consisted of the treatments (diets), and the split plots corresponded to the indicators. Data were analyzed using the Sisvar program (FERREIRA, 2011). The data were subjected to analysis of variance and
regression, and the means were compared using the Student-Newman-Keuls test (p<0.05).
Results and Discussion
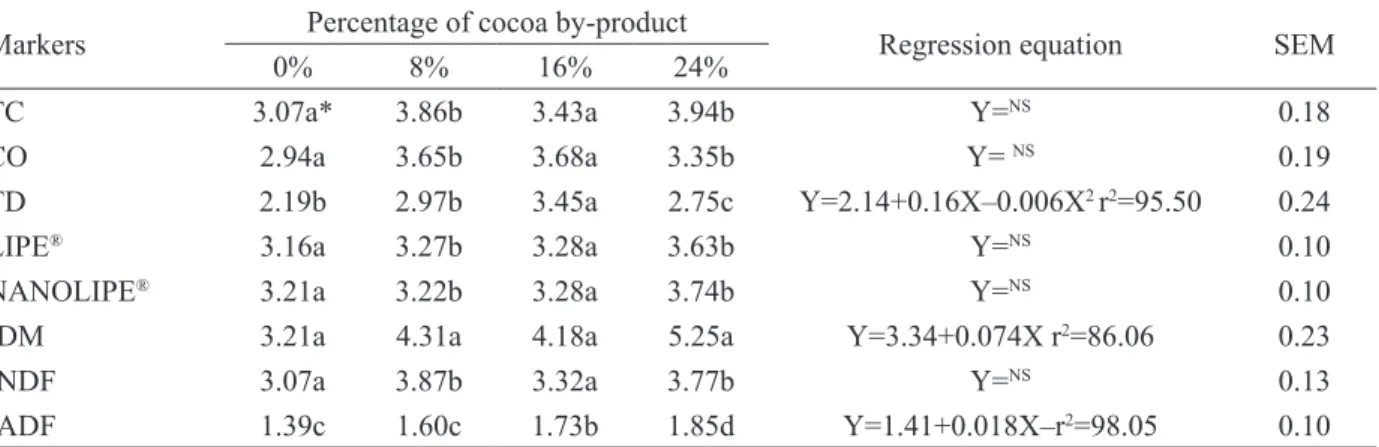
The FP values estimated using CO, LIPE®, NANOLIPE®, and INDF were similar (p>0.05) to those obtained using TC according to the percentage of CB in the diets (Table 2). These substances were efficient in estimating FP at all evaluated CB concentrations, i.e., the estimated amounts were similar to the actual amounts obtained using TC.
Table 2. Mean fecal production (kg dry matter day-1) estimated using the total collection (TC) method and external and
internal markers in diets containing different concentrations of a cocoa by-product in dairy heifers.
Markers Percentage of cocoa by-product Regression equation SEM
0% 8% 16% 24%
TC 3.07a* 3.86b 3.43a 3.94b Y=NS 0.18
CO 2.94a 3.65b 3.68a 3.35b Y= NS 0.19
TD 2.19b 2.97b 3.45a 2.75c Y=2.14+0.16X–0.006X2 r2=95.50 0.24
LIPE® 3.16a 3.27b 3.28a 3.63b Y=NS 0.10
NANOLIPE® 3.21a 3.22b 3.28a 3.74b Y=NS 0.10
IDM 3.21a 4.31a 4.18a 5.25a Y=3.34+0.074X r2=86.06 0.23
INDF 3.07a 3.87b 3.32a 3.77b Y=NS 0.13
IADF 1.39c 1.60c 1.73b 1.85d Y=1.41+0.018X–r2=98.05 0.10
*The means followed by different letters in each column were not significantly different from each other using the SNK test (p<0.05).
CO, chromic oxide; TD, titanium dioxide; LIPE®, isolated, purified, and enriched lignin; NANOLIPE®, isolated, purified, and
enriched lignin nanoparticles; IDM, indigestible dry matter; INDF, indigestible neutral detergent fiber; IADF, indigestible acid detergent fiber; NS, not significant; SEM, standard error of the mean.
Increasing levels of CB affected the recovery of TD, IDM, and IADF. TD presented a quadratic function, with a maximum value at 13.33% of CB. Similarly, increasing concentrations of CB influenced the recovery of IDM and IADF. The mean FP using these two indicators was 4.24 kg fecal DM day-1 and 1.64 kg fecal DM day-1, respectively.
CO is the most used marker in nutrient consumption and digestibility tests in animal diets because it has been thoroughly researched. However, the results are variable because of several factors, including incomplete mixing with
ruminal digesta, faster passage through the rumen than fibrous material, possible accumulation in the digestive tract, variations in fecal excretion throughout the day, and analytical difficulties. However, as in the present study, other authors found that CO produced satisfactory results and presented several advantages, including low cost, ease of administration, and ease of analysis (CABRAL et al., 2008; FERREIRA et al., 2009; SAMPAIO et al., 2011; POZZA et al., 2013; OLIVEIRA et al., 2016).
LIPE® was used in some studies and adequately estimated FP compared to TC, with a recovery
2776
Semina: Ciências Agrárias, Londrina, v. 40, n. 6, p. 2771-2782, nov./dez. 2019 rate close to 100% (FERREIRA et al., 2009;
LANZETTA et al., 2009; VASCONCELLOS et al., 2011; SALIBA et al., 2015). The positive results with LIPE in tests of nutrient consumption and ADMD appear to be an advantage, and its use is feasible because of the shorter period of adaptation of the animals to the diet and ease of administration, which helps reduce animal stress and behavioral changes. However, different results were obtained by Magalhães et al. (2018), who recommended using INDF and IADF because they were more accurate than LIPE®.
The results of FP using NANOLIPE® evidenced its higher potential than other markers by acting as a nanoparticle and thoroughly mixing with the
ruminal digesta, reducing the adaptation and TC period, and increasing the rate of recovery of this substance (FIGUEIREDO, 2011; MOSS et al., 2017).
In the present study, the recovery of INDF was 100%, which agrees with the results of Sampaio et al. (2011), Carvalho et al. (2013), and Lee and Hristov (2013), who recommended its use to estimate the ADMD of dietary nutrients.
The FP values using CO, LIPE®, NANOLIPE®, and INDF were similar (p>0.05) to those using TC (Table 3), which is used to validate the use of these indicators (OLIVEIRA et al., 1997). However, TD and IADF underestimated FP (p<0.05) whereas IDM overestimated FP relative to TC.
Table 3. Mean fecal recovery (%) using external and internal markers compared to the total collection (TC) method.
Markers TC CO TD LIPE® NANOLIPE® IDM INDF IADF
Fecal recovery 100.00b* 95.24b 79.44c 93.30b 94.06b 118.53a 98.11b 45.94d
*The means followed by different letters in each line were significantly different from each other using the SNK test (p<0.05) CO, chromic oxide; TD, titanium dioxide; LIPE®, isolated, purified, and enriched lignin; NANOLIPE®, isolated, purified, and
enriched lignin nanoparticles; IDM, indigestible dry matter; INDF, indigestible neutral detergent fiber; IADF, indigestible acid detergent fiber; coefficient of variation (CV)=16.94%.
The recovery of TD and IADF was less than 100% (Table 3). The mean FP using TD was 2.84 kg DM day-1, which is 20.56% lower than that using TC. In the present study, sample collection was performed once daily in the morning, which may have contributed to the underestimation of FP using TD. Other contributing factors include variations in excretion between animals and the analytical methodology. The FP values were lower than those obtained by Figueiredo (2011), who used TD and reported difficulties inherent to the administration and quantification of this marker. Glindemann et al. (2009) found that FP and the recovery of TD were similar to those obtained by TC; moreover, TD recovery was higher in diets containing hay alone compared to diets containing hay and concentrate, and fecal excretion was improved when the indicator
was administered once daily and FC was performed twice daily. Similarly, Souza et al. (2015) evaluated using TD as an alternative to CO for estimating FP and ADMD and observed that CO overestimated FP and the results for these two parameters were more accurate using TD. Moreira Filho et al. (2017) indicated that CO, TD, and IDM were effective in estimating FP and ADMD, with correlation coefficients higher than 90% relative to TC.
FP estimated by IADF was 54.06% lower than that by TC. This result may be because IADF was influenced by the method of measurement, which was sequential and performed after measuring IDM and INDF, resulting in the accumulation of methodological errors. Detmann et al. (2004) reported that the lower concentrations of IADF in feed, leftover, and fecal samples relative to INDF
2777 Semina: Ciências Agrárias, Londrina, v. 40, n. 6, p. 2771-2782, nov./dez. 2019
provided a lower residual mass to be quantified in vitro, and systematic errors due to failure or lack of standardization of analytical methods were more representative. However, Alves et al. (2016) found that the variability in FP was relatively lower using INDF. These authors also observed that the variability in the recovery of INDF and IDM was relatively greater and the recovery of CO was similar between the experimental diets, assuming that CO was not affected by different feeding conditions. Kozloski et al. (2009) indicated that a lower recovery of markers might be related to partial food digestion or absorption, physical-chemical changes in the digestive tract, or analytical limitations.
IDM overestimated the mean FP by 18.53%, indicating that the concentration of this indicator was relatively higher in the feces. The mean excreted amount of IDM was 660 grams higher than that using TC. In this respect, Huhtanen et al. (1994) have shown that IDM may contain contaminants because detergents are not used to purify the residues after incubation, which may compromise the results (VAN SOEST, 1994). For this reason, the fecal recovery of IDM may be increased, and nutrient digestibility may be underestimated. This result is corroborated by Kozloski et al. (2009), whereby IDM recovery
ranged from 64.80% to 108.50% and was higher than the recovery of INDF. In contrast, Cabral et al. (2017) found that IDM accurately estimated FP and ADMD in sheep whereas INDF and IADF did not accurately estimate these parameters.
The ADMD values estimated using CO, LIPE®, NANOLIPE®, and INDF were similar (p>0.05) to those estimated by TC at all CB concentrations (Table 4). The apparent crude protein digestibility (ACPD) values estimated using these markers were different from those using TC only at 24% of CB. There was no significant difference (p>0.05) in ADMD values using TD at all concentrations of CB. The results of ACPD and apparent NDF digestibility (ANDFD) using TD were different from TC only at 24% of CB. The estimated values of ADMD, ACPD, and ANDFD increased as the concentration of IDM increased. The values using this marker were different from those using TC only at 24% of CB. However, the estimated values of ADMD, ACPD, and ANDFD using IADF were significantly different (p>0.05) at all evaluated CB concentrations. Similarly, the ADMD values overestimated by TD and IADF followed the same pattern of the underestimated FP values (Table 2).
Table 4. Mean values of apparent dry matter digestibility (ADMD), apparent crude protein digestibility (ACPD),
apparent neutral detergent fiber digestibility (ANDFD), regression equations (RE), and coefficient of determination (r2) of diets estimated using external and internal markers compared with the total collection (TC) method.
Markers Percentage of cocoa by-product
0% 8% 16% 24% RE r2 ADMD TC 58.53bc* 56.09b 61.73b 47.10bc Y=NS CO 60.01bc 56.33bc 54.16bc 56.82bc Y=NS TD 70.55b 64.62b 58.30bc 63.73b Y=NS LIPE® 56.07c 60.86b 59.52bc 55.86bc Y=NS NANOLIPE® 55.50c 61.55b 59.34bc 55.28bc Y=NS IDM 56.30c 48.47c 48.60c 30.25d Y=57.61–0.98X 82.94 INDF 58.23c 53.89bc 58.97bc 49.77c Y=NS
IADF 80.57a 81.05a 78.74a 75.45a Y=NS
2778
Semina: Ciências Agrárias, Londrina, v. 40, n. 6, p. 2771-2782, nov./dez. 2019 There was a significant interaction between the
indicators and the percentage of CB, which is a fiber-rich food with a high lignin content, and this characteristic might affect the concentration of the markers probably because of the degree of ruminal digestion.
Berchielli et al. (2005) reported that the most common causes of errors were the loss of markers during digestion or routine laboratory tests, which compromised the accuracy of in situ food assessment. This loss may overestimate digestibility values because the lost fraction is usually associated with the DM fraction that is rapidly degraded and readily soluble in the rumen.
Different results for IMs may be because their characteristics in the analyzed forage are different (BERCHIELLI et al., 2005). Therefore, there may be differences in the rate and extent of degradation
ACPD TC 66.58b 60.05bc 65.09b 50.74c Y=NS CO 67.88b 62.15bc 62.78b 59.29bcd Y=NS TD 76.32ab 69.22b 65.78b 65.97b Y=NS LIPE® 66.06b 66.11bc 64.69b 64.38b Y=NS NANOLIPE® 63.93b 61.36bc 64.82b 62.16bd Y=NS
IDM 64.79b 55.09c 58.19b 34.46e Y=66.31–1.09X 78.84
INDF 66.37b 59.86bc 66.49b 52.80cd Y=NS
IADF 84.26a 83.44a 82.59a 76.93a Y = 85.23–0.28X 81.77 ANDFD TC 55.25b 49.50bc 49.03b 37.75c Y=NS CO 54.71b 49.35bc 45.23b 48.46bc Y=NS TD 66.65ab 59.07bc 50.09b 56.83b Y=NS LIPE® 51.85b 54.53bc 48.02b 55.06bc Y=NS NANOLIPE® 48.95b 62.05b 48.27b 52.35bc Y=NS IDM 50.59b 40.56c 36.68b 17.14d Y=51.87–1.30X 92.13 INDF 52.75b 46.64bc 51.08b 40.34bc Y=NS
IADF 78.08a 78.15a 74.66a 70.84a Y=NS
*The means followed by different letters in each column were significantly different from each other using the SNK test (p<0.05). CO, chromic oxide; TD, titanium dioxide; LIPE®, isolated, purified, and enriched lignin; NANOLIPE®, isolated, purified, and
enriched lignin nanoparticles; IDM, indigestible dry matter; INDF, indigestible neutral detergent fiber; IADF, indigestible acid detergent fiber. NS, not significant.
continuation
depending on the characteristics of the fibrous portion of the silage. Watanabe et al. (2010) observed that diet composition was one of the main factors for the success and choice of an IM for estimating ADMD and concluded that non-fibrous carbohydrates might be the major interfering factors.
The studies that estimated FP, nutrient consumption, and ADMD used different incubation bags (F57, nylon, and non-woven fabric), incubation times (96h00, 144h00, 188h00, and 264h00), and particle sizes (1, 2, and 3 mm); evidencing the need to standardize these parameters (CASALI et al., 2009; DETMANN et al., 2012).
The accuracy and precision of ADMD measurements using IDM and IADF were significantly different (p<0.05) from those using other markers and, consequently, less reliable (Table 5).
2779 Semina: Ciências Agrárias, Londrina, v. 40, n. 6, p. 2771-2782, nov./dez. 2019
Table 5. Accuracy and precision of apparent dry matter digestibility (ADMD) values estimated using external and
internal markers.
Markers Observed ADMD Predicted ADMD Accuracy* Precision* Residual error#
CO 63.08 56.83 -0.39 b 1.56 b 1.51 bc TD 63.08 64.30 0.08 b 1.56 b 1.51 c LIPE® 63.08 58.08 -0.31 b 1.94 b 1.88 bc NANOLIPE® 63.08 57.92 -0.32 b 2.05 b 1.99 bc IDM 63.08 45.91 -1.07 c 4.29 a 4.16 ab INDF 63.08 55.21 -0.49 b 2.14 b 5.59 ab IADF 63.08 78.94 0.99 a 4.18 a 18.84 a CV 2.56 5.24
-*The means followed by different letters in each column were significantly different from each other using the Tukey’s test (p<0.05). #The means followed by different letters in each column were significantly different from each other using the Kruskal-Wallis test (p<0.05) and Dunn’s post-hoc test (p<0.05)
CO, chromic oxide; TD, titanium dioxide; LIPE®, isolated, purified, and enriched lignin; NANOLIPE®, isolated, purified, and
enriched lignin nanoparticles; IDM, indigestible dry matter; INDF, indigestible neutral detergent fiber; IADF, indigestible acid detergent fiber.
The accuracy of the measurements was consistent with the fecal recovery of the markers (Table 3). Rodrigues et al. (2010) found that a lower recovery indicated that the concentration of markers in the feces was lower, leading to an overestimation of the excretion of the dietary fractions of interest and, consequently, underestimating digestibility values. Similarly, errors of prediction of ADMD were larger using IDM and IADF, indicating that these estimates were more distant from the actual TC values. Nonetheless, there were no significant differences in prediction errors using CO, LIPE®, NANOLIPE®, and TD (p>0.05). ADMD values were comparatively higher using IADF, suggesting the lower precision of this IM.
The different estimates using TD, IDM, and IADF reinforce the need for further studies to identify the factors responsible for the variability in responses and allow methodological standardization.
Conclusion
The EMs CO, LIPE®, and NANOLIPE®, and the IM INDF accurately estimated ADMD and FP.
Acknowledgments
The authors are grateful to the Federal University of Minas Gerais; Capixaba Institute for Research, Technical Assistance, and Rural Extension of Espírito Santo; Forest Education and Development Center of Minas Gerais; Executive Commission for Cacao Crops of Espírito Santo; and producer Emir de Macedo Gomes Filho for the support in the development of this study.
This study was financed in part by the Coordenação de Aperfeiçoamento de Pessoal de Nível Superior - Brasil (CAPES) - Finance Code 001.
References
ALVES, G. R.; FONTES, C. A. A.; FERNANDES, A. M.; PROCESSI, E. F.; OLIVEIRA, T. S.; GLÓRIA, L. S.; GOMES, R. S. Intake and digestibility of silages containing pineapple pulp and coast-cross hay with or without urea and markers recovery in sheep. Revista
Brasileira de Zootecnia, Viçosa, MG, v. 45, n. 4, p.
151-157, 2016. DOI: 10.1590/S1806-92902016000400002 BERCHIELLI, T. T.; OLIVEIRA, S. G.; CARRILHO, E. M.; FEITOSA, J.; LOPES, A. D. Comparação de marcadores para estimativas de produção fecal e de fluxo
2780
Semina: Ciências Agrárias, Londrina, v. 40, n. 6, p. 2771-2782, nov./dez. 2019
de digesta em bovinos. Revista Brasileira de Zootecnia, Viçosa, MG, v. 34, n. 3, p. 987-996, 2005. DOI: 10.1590/ S1516-35982005000300032
CABRAL, I. S.; AZEVEDO, J. A. G.; PINA, D. S.; PEREIRA, L. G. R.; ALMEIDA, F. M.; SOUZA, L. L.; LIMA, R. F. Evaluation of internal markers as determinants of fecal dry matter output and digestibility in feedlot sheep. Semina: Ciências Agrárias, Londrina, v. 38, n. 5, p. 3331-3340, 2017. DOI: 10.5433/1679-0359.2017v38 n5p3331
CABRAL, L. S.; VALADARES FILHO, S. C.; DETMANN, E.; ZERVOUDAKIS, J. T.; SOUZA, A. L.; VELOSO, R. G. Avaliação de indicadores na estimação da excreção fecal e da digestibilidade em ruminantes.
Revista Brasileira de Saúde e Produção Animal,
Salvador, v. 9, n. 1, p. 29-34, 2008.
CARVALHO, G. G.; GARCIA, R.; PIRES, A. G.; SILVA, R. R.; DETMANN, E.; OLIVEIRA, R. L.; RIBEIRO, L. S. O. Long-term bias of internal markers in sheep and goat digestion trials. Asian-Australasian Journal of
Animal Sciences, Gwanak-gu, v. 26, n. 1, p. 65-71, 2013.
DOI: 10.5713/ajas.2011.11408
CASALI, A. O.; DETMANN, E.; VALADARES FILHO, S. C.; PEREIRA, J. C.; CUNHA, M.; DETMANN, K. S. C.; PAULINO, M. F. Estimação de teores de componentes fibrosos em alimentos para ruminantes em sacos de diferentes tecidos. Revista Brasileira de Zootecnia, Viçosa, MG, v. 38, n. 1, p. 130-138, 2009. DOI: 10.1590/ S1516-35982009000100017
CASALI, A. O.; DETMANN, E.; VALADARES FILHO, S. C.; PEREIRA, J. C.; HENRIQUES, L. T.; FREITAS, S. G.; PAULINO, M. F. Influência do tempo de incubação e do tamanho de partículas sobre os teores de compostos indigestíveis em alimentos e fezes bovinas obtidos por procedimentos in situ. Revista Brasileira de Zootecnia, Viçosa, MG, v. 37, n, 2, p. 335-342, 2008. DOI: 10.1590/ S1516-35982008000200021
COSTA, M. C. M.; ÍTALO, L. C.; FERREIRA ÍTAVO, C. C. B.; DIAS, A. M.; PETIT, H.; REIS, F. A.; GOMES, R. C.; LEAL, E. S.; NIWA, M. G.; MORAES, G. J. Evaluation of internal and external markers to estimate faecal output and feed intake in sheep fed fresh forage.
Animal Production Science, Melbourne, v. 59, n. 4, p.
741-748, 2018. DOI: 10.1071/AN16567
DETMANN, E.; SOUZA, M. A.; VALADARES FILHO, S. C.; QUEIROZ, A. C.; BERCHIELLI, T. T.; SALIBA, E. O. S.; CABRAL, L. S.; PINA, D. S.; LADEIRA, M. M.; AZEVEDO, J. A. G. Métodos para análises de
alimentos: INCT - Ciência Animal. Visconde do Rio
Branco: Suprema, 2012. 214 p.
DETMANN, E.; ZERVOUDAKIS, J. T.; CABRAL, L. S.; ROCHA JUNIOR, V.; VALADARES FILHO, S. C.; QUEIROZ, A. C.; PONCIANO, J.; FERNANDES, A. M. Validação de equações preditivas da fração indigestível da fibra em detergente neutro em gramíneas tropicais. Revista Brasileira de Zootecnia, Viçosa, MG, v. 33, n. 6, p. 1866-1875, 2004. DOI: 10.1590/S1516-35982004000700026
FERREIRA, D. F. Sisvar: a computer statistical analysis system. Ciência e Agrotecnologia, Lavras, v. 35, n. 6, p. 1039-1042, 2011. DOI: 10.1590/S1413-70542011000600001
FERREIRA, M. A.; VALADARES FILHO, S. C.; MARCONDES, M. I.; PAIXÃO, M. L.; PAULINO, M. F.; VALADARES, R. F. D. Avaliação de indicadores em estudos com ruminantes: digestibilidade. Revista
Brasileira de Zootecnia, Viçosa, MG, v. 38, n. 8, p.
1568-1573, 2009. DOI: 10.1590/S1516-35982009000800022 FIGUEIREDO, M. R. Indicadores externos de
digestibilidade aparente em ovinos. 2011. Dissertação
(Mestrado em Zootecnia) - Universidade Federal de Minas Gerais, Belo Horizonte.
GLINDEMANN, T.; TAS, B. M.; WANG, C.; ALVERS, S.; SUSENBETH, A. Evaluation of titanium dioxide as an inert marker for estimating faecal excretion in grazing sheep. Animal Feed Science and Technology, Amsterdam, v. 152, n. 3-4, p. 186-197, 2009. DOI: 10.1016/j.anifeedsci.2009.04.010
HUHTANEN, P.; KAUSTELL, K.; JAAKKOLA, S. The use of internal markers to predict total digestibility and duodenal flow of nutrients in cattle given six different diets. Animal Feed Science and Technology, Amsterdam, v. 48, n. 1, p. 211-227, 1994. DOI: 10.1016/0377-8401(94)90173-2
ITURBIDE, C. A. El óxido crómico como indicador externo para estimar producción fecal y consumo en las pruebas de digestibilidade. Turrialba, São José, v. 17, n. 3, p. 304-313, 1967.
KOHN, R. A.; KALSCHEUR, K. F.; HANIGAN, M. Evaluation of models for balancing the protein requirements of dairy cows. Journal of Dairy Science, Champaign, v. 81, n. 12, p. 3401-3414, 1998. DOI: 10.3168/jds.S0022-0302(98)75904-1
KOZLOSKI, G.; MESQUITA, F. R.; ALVES, T.; CASTAGNINO, D. S.; STEFANELLO, C. M.; SANCHEZ, L. M. B. Avaliação do uso de frações indigestíveis do alimento como indicadores internos de digestibilidade em ovinos. Revista Brasileira de
Zootecnia, Viçosa, MG, v, 38, n. 9, p. 1819-1823, 2009.
2781 Semina: Ciências Agrárias, Londrina, v. 40, n. 6, p. 2771-2782, nov./dez. 2019
LANZETTA, A. S.; REZENDE, A. S. C.; SALIBA, E. O. S.; LANA, A. M. Q.; RODRIGUEZ, M.; MOSS, C. B. Validação do Lipe® como método para determinar a digestibilidade dos nutrientes em equinos. Revista
Brasileira de Zootecnia, Viçosa, MG, v. 38, n. 1, p.
69-74, 2009. DOI: 10.1590/S1516-35982009000100009 LEE, C.; HRISTOV, A. Short communication: evaluation of acid-insoluble ash and indigestible neutral detergent fiber as total-tract digestibility markers in dairy cows fed corn silage-based diets. Journal of Dairy Science, Champaign, v. 96, n. 8, p. 5295-5299, 2013. DOI: 10.3168/jds.2012-6442
MAGALHÃES, A. L. R.; TEODORO, A. L.; SOUZA, M. F. S.; NASCIMENTO JÚNIOR, J. R. S.; SOUZA, D. R.; SANTOS, K. C.; ANDRADE, A.; PINTO, C. S.; BARBOSA, I. F. T.; SILVA, S. M. C. Dietas para ovinos contendo capim elefante maduro e raspa de mandioca: estimativa de digestibilidade aparente por meio de indicadores. Archivos de Zootecnia, Córdoba, v. 67, n. 258, p. 244-252, 2018. DOI: 10.21071/az.v67i258.3660 MARCONDES, M. I.; VALADARES FILHO, S. C.; PAULINO, R.; DETMANN, E.; PAULINO, M. F.; DINIZ, L. L.; SANTOS, T. R. Consumo e desempenho de animais alimentados individualmente ou em grupo e características de carcaça de animais Nelore de três classes sexuais. Revista Brasileira de Zootecnia, Viçosa, MG, v. 37, n. 12, p. 2243-2250, 2008. DOI: 10.1590/ S1516-35982008001200023
MERTENS, D. R. Regulation of forage intake. In: FAHEY, G. C. (Ed.). Forrage quality, evaluation and
utilization. Madison: American Society of Agronomy,
1994. p. 450-493.
MOREIRA FILHO, M. A.; ALVES, A. A.; GARCEZ, B. S.; MOREIRA, A. L.; AZEVÊDO, D. M. M. R.; PARENTE, H. Digestibility markers of sheep diets containing hydrolyzed sugarcane-top hay. Revista
Brasileira de Saúde e Produção Animal, Salvador,
v. 18, n. 1, p. 38-49, 2017. DOI: 10.1590/s1519-99402017000100005
MOSS, C. B.; SALIBA, E. O. S.; LANA, A. M. Q.; MOURA, R. S.; CASSOU, F.; COSTA, M. L. L.; FREITAS, G.; ALVES, G. E. S. Validação do NANOLIPE como método para determinar a digestibilidade aparente dos nutrientes pelos equinos. Arquivo Brasileiro de
Medicina Veterinária e Zootecnia, Belo Horizonte, v. 69,
n. 3, p. 687-694, 2017. DOI: 10.1590/1678-4162-8270 MYERS, W. D.; LUDDEN, A.; NAYIGIHUGU, V.; HESS, B. W. Technical note: a procedure for the preparation a quantitative analysis of samples for titanium dioxide. Journal of Animal Science, Champaign, v. 82, n. 1, p. 179-183, 2004. DOI: 10.2527/2004.821179x
NOCEK, J. E. In situ and other methods to estimate ruminal protein and energy digestibility. A review.
Journal of Dairy Science, Champaign, v. 71, n. 8, p.
2051-2069, 1988. DOI: 10.3168/jds.S0022-0302(88)79781-7 OLIVEIRA, D. E.; PRATES, E. R.; PERALBA, M. C. R. Identificação e quantidade de n-alcanos presentes nas ceras de plantas forrageiras. Revista Brasileira de
Zootecnia, Viçosa, MG, v. 26, n. 5, p. 881-886, 1997.
DOI: 10.1590/S0103-84782000000300031
OLIVEIRA, E. R.; MONÇÃO, F.; GABRIEL, A. M. A.; MENDES, A. R. F.; MOURA, L.; NASCIMENTO, F. A. Performance and digestibility in feedlot lambs fed hay based diets. Acta Scientiarum Animal Science, Maringá, v. 38, n. 4, p. 425-430, 2016. DOI: 10.4025/ actascianimsci.v38i4.30462
OWENS, F.; HANSON, C. F. External and internal markers for appraising site and extent of digestion in ruminants. Journal of Dairy Science, Champaign, v. 75, n. 9, p. 2605-2617, 1992. DOI: 10.3168/jds.S0022-0302(92)78023-0
POMBO, G.; VALLE, T. D.; BRADI, R. A.; BUENO, I. C. S. Acurácia, precisão e robustez de indicadores internos para predição da digestibilidade aparente total de matéria seca em equinos. Arquivo Brasileiro de Medicina
Veterinária e Zootecnia, Belo Horizonte, v. 68, n. 3, p.
769-775, 2016. DOI: 10.1590/1678-4162-8441
POZZA, C.; GOMES, C.; POZZA, M. S. S.; NUNES, R.; FERREIRA, R. A.; RODRIGUEIRO, R. J. B. Use of markers to determine the ileal digestibility of amino acids for swine. Ciência e Agrotecnologia, Lavras, v. 37, n. 3, p. 259-265, 2013. DOI: 10.1590/S1413-70542013000300009
RODRIGUES, H. M.; GOMES, R. C.; SIQUEIRA, R. F.; MEYER, M.; RODRIGUES, R. R. Acurácia, precisão e robustez das estimativas da digestibilidade aparente da matéria seca determinada com o uso de indicadores em ovinos. Revista Brasileira de Zootecnia, Viçosa, MG, v. 39, n. 5, p. 1118-1126, 2010. DOI: 10.1590/S1516-35982010000500024
SALIBA, E. O. S.; FARIA, E.; RODRIGUEZ, M.; MOREIRA, G. R.; SAMPAIO, I. B. M.; SALIBA, J. S.; GONÇALVES, L. C.; BORGES, I.; BORGES, A. L. C. C. Use of infrared spectroscopy to estimate fecal output with marker Lipe®. International Journal of Food
Science, Nutrition and Dietetics, Lewes, v. 4, p. 1-10,
2015. DOI: 10.19070/2326-3350-SI04001
SAMPAIO, C. B.; DETMANN, E.; VALENTE, T.; SOUZA, M. A.; VALADARES FILHO, S. C.; PAULINO, M. F. Evaluation of fecal recovering and long term bias of internal and external markers in a digestion assay
2782
Semina: Ciências Agrárias, Londrina, v. 40, n. 6, p. 2771-2782, nov./dez. 2019
with cattle. Revista Brasileira de Zootecnia, Viçosa, MG, v. 40, n. 1, p. 174-182, 2011. DOI: 10.1590/S1516-35982011000100025
SCHAAFSTRA, F. J. W. C.; DORN, D. A.; SCHONEWILLE, J. T.; BOOM, R. D.; VERCHUUR, M.; BLOK, M. C.; HENDRIKS, W. H. Evaluation of titanium dioxide and chromic oxide as digestibility markers in ponies fed alfafa hay in relation to marker dosing frequency. Animal, Cambridge, v. 13, n. 4, p. 702-708, 2019. DOI: 10.1017/S1751731118002112
SILVA, D. J.; QUEIROZ, A. C. Análise de alimentos: métodos químicos e biológicos. 3. ed. Viçosa, MG: Editora UFV, 2002. 235 p.
SILVA, J. F. C.; LEÃO, M. I. Fundamentos de nutrição
de ruminantes. Piracicaba: Livroceres, 1979. 384 p.
SOUZA, J.; BATISTEL, F.; WELTER, K. C.; SILVA, M. M.; COSTA, D. F.; SANTOS, F. A. Evaluation of external markers to estimative fecal excretion, intake,
and digestibility in dairy cows. Tropical Animal Health
and Production, Edinburgh, v. 47, n. 1, p. 265-268, 2015.
DOI: 10.1007/s11250-014-0674-6
VAN SOEST, P. J. Nutritional ecology of the ruminant. 2th ed. Ithaca: Cornell University Press, 1994. 463 p.
VASCONCELLOS, C. H. F.; FONTES, D. O.; SALIBA, E. O. S.; VELOSO, J. A. F.; LARA, L. J. C. Uso da LIPE® como indicador externo na determinação da
digestibilidade da proteína e matéria seca de alimentos em frangos de corte. Ciência e Agrotecnologia, Lavras, v. 35, n. 3, p. 613-620, 2011. DOI: 10.1590/S1413-70542011000300025
WATANABE, H.; EZEQUIEL, J. M. B.; GALATI, R. L.; BIAGIOLI, B.; SILVA, O. G. C. Indicadores internos indigestíveis para a estimativa das digestibilidades de dietas à base de coprodutos. Revista Brasileira de Saúde
e Produção Animal, Salvador, v. 11, n. 3, p. 849-857,