HAL Id: hal-02393028
https://hal.inria.fr/hal-02393028
Preprint submitted on 4 Dec 2019
HAL is a multi-disciplinary open access
archive for the deposit and dissemination of sci-entific research documents, whether they are pub-lished or not. The documents may come from teaching and research institutions in France or abroad, or from public or private research centers.
L’archive ouverte pluridisciplinaire HAL, est destinée au dépôt et à la diffusion de documents scientifiques de niveau recherche, publiés ou non, émanant des établissements d’enseignement et de recherche français ou étrangers, des laboratoires publics ou privés.
deployment strategies
Samuel Nilusmas, Mathilde Mercat, Thomas Perrot, Caroline
Djian-Caporalino, Philippe Castagnone-Sereno, Suzanne Touzeau, Vincent
Calcagno, Ludovic Mailleret
To cite this version:
Samuel Nilusmas, Mathilde Mercat, Thomas Perrot, Caroline Djian-Caporalino, Philippe Castagnone-Sereno, et al.. A multi-seasonal model of plant-nematode interactions and its use to identify optimal plant resistance deployment strategies. 2019. �hal-02393028�
A multi-seasonal model of plant-nematode interactions and
its use to identify optimal plant resistance deployment
strategies
Samuel Nilusmas1, Mathilde Mercat1, Thomas Perrot1, Caroline
Djian-Caporalino1, Philippe Castagnone-Sereno1, Suzanne Touzeau1,2,∗, Vincent Calcagno1,∗, and Ludovic Mailleret1,2,∗
1Universit´e Cˆote d’Azur, INRA, CNRS, ISA, France;2Universit´e Cˆote d’Azur, Inria, INRA, CNRS,
Sorbonne Universit´e, BIOCORE, France
Author for correspondence: Samuel Nilusmas
Tel: +33 7 98 94 82
Email: samuel.nilusmas@inra.fr
∗These authors contributed equally to this work.
Summary
• Root-knot nematodes (RKNs) are soil-borne polyphagous pests with major impact on crop yield worlwide. Resistant crops efficiently control avirulent RKNs, but favour the emergence of virulent forms. Virulence being associated with fitness costs, susceptible crops counter-select virulent RKNs. In this study we identify optimal rotation strategies between susceptible and resistant crops to control RKNs and maximize crop yield.
• We developed an epidemiological model describing the within-season dynamics of avirulent and virulent RKNs on susceptible or resistant plant root-systems, and their between-season survival. The model was fitted to experimental data and used to predict yield-maximizing rotation strategies, with special attention to the impact of epidemic and genetic parameters.
• Crop rotations were found to be efficient under realistic parameter ranges. They were characterised by low ratios of resistant plants, and were robust to parameter uncertainty. Rotations provide significant gain over resistant-only strategies, espe-cially under intermediate fitness costs and severe epidemic contexts.
• Switching from the current general deployment of resistant crops to custom rotation strategies could not only maintain or increase crop yield, but also preserve the few and valuable R-genes available to us.
Key words: durable resistance, optimal strategies, resistance deployment, root-knot ne-matodes, seasonality, semi-discrete model
Introduction
As the global population increases, finding effective and durable crop protection strategies has become a major challenge (Cunniffe et al., 2015). Predictions indicate that popula-tion growth, combined with changes in dietary habits, will lead to an increase in the global food demand by at least 50% in 2050 (Tilman et al., 2011; Springmann et al., 2016). To meet this demand, crop production will have to increase, with expected negative environ-mental impacts (biodiversity and forest loss, reduced freshwater availability, soil degra-dation and CO2 emissions) if relying on the extensive use of chemical pesticides and monocultures (Tilman et al., 2001; Stoate et al., 2009; Zhan et al., 2015). Furthermore, crop losses are expected to increase as well, owing to the emergence or evolution of plant pests and diseases (Palumbi, 2001; Stukenbrock & McDonald, 2008). These trends call for experimental and theoretical studies aiming at protecting crops and increasing their yield durably, while reducing pesticide dependence. In this context, the development of environmentally-friendly pest management strategies based on biological control, better cultural practices and the use of resistant plants are very promising (Mundt, 2014; Zhan et al., 2015; Van Lenteren et al., 2018).
Natural plant resistance is amongst the most efficient alternatives to pesticides in eco-nomic, environmental and social terms (Biffen, 1905; Hammond-Kosack & Jones, 1997). Qualitative plant resistance rests on gene-for-gene interactions (Flor, 1971), in which an avirulent gene (Avr-gene) in the pest or pathogen interacts with a major resistance gene (R-gene) in the plant, resulting in disease resistance through what is usually called effector-triggered immunity or incompatible reaction (Dangl & Jones, 2001; Jones & Dangl, 2006). If the R-gene is inactive or absent, or equivalently if the pest lacks the Avr-locus, the interaction instead results in plant infection. Major R-genes are rare in na-ture and plant breeders mostly work on the introgression of a small list of major R-genes into different genetic backgrounds to create commercial crop cultivars. Therefore, farmers ultimately employ the same resistance genes over several years and on large spatial scales. Such an intensive use of resistance generates strong selection pressures on populations of avirulent pests, that can lose the Avr-gene through mutation, causing the emergence and
establishment of virulent variants (Leonard, 1977; Castagnone-Sereno, 2002; McDonald & Linde, 2002; Parlevliet, 2002; Garcia-Arenal et al., 2003).
According to Johnson (1981), a durable resistance is one that remains effective in a cul-tivar for a long period of time despite its widespread cultivation. Resistance durability may depend on the time required for a mutation at the Avr-gene to occur and the time for the virulent pathogen to establish (Van den Bosch & Gilligan, 2003; Stuthman et al., 2007; Barrett et al., 2008; Fabre et al., 2009; Brown, 2015; Zhan et al., 2015). The lat-ter might be expected to be very short, considering the huge advantage for a pathogen to overcome resistance and become virulent. However, significant polymorphism exists at virulence genes, that can at least partly be explained by fitness costs associated with virulence (Stahl et al., 1999; Tian et al., 2003; Laine & Tellier, 2008). Numerous studies have reported fitness costs in bacteria (Cruz et al., 2000; Leach et al., 2001), oomycetes (Montarry et al., 2010) or viruses (Garc´ıa-Arenal & Fraile, 2013). The existence of fitness costs implies that even though virulent pathogens are selected for in resistant crops, they are selected against in susceptible crops, where avirulent pathogens grow and reproduce faster.
Several approaches to improve the durability of R-genes that are based on suitable com-binations of resistant and susceptible plant cultivars have been proposed (Van den Bosch & Gilligan, 2003; Fabre et al., 2012; Papa¨ıx et al., 2014; Fabre et al., 2015; Lof & van der Werf, 2017). The most common deployment strategies are mixtures, mosaics and rota-tions, that exploit spatial and/or temporal heterogeneity in selection pressures (Kiyosawa, 1982; Mundt, 2002; Pink, 2002; Djidjou-Demasse et al., 2017; Rimbaud et al., 2018). Crop rotation is one of the most important strategies thought to delay and control resis-tance breakdown when a single R-gene is deployed over a large area (Dury et al., 2012). Root-knot nematodes (RKNs, Meloidogyne spp.) are ubiquitous plant pathogens (Trudg-ill & Blok, 2001; Jones et al., 2011). They are obligate extremely polyphagous plant endoparasites, that cause damages to the roots of thousands of host plant species (Wese-mael et al., 2011; Perry et al., 2010). Overall, their economic impact has been estimated at over 121 billion dollars of crop losses each year (Chitwood, 2003). For several decades, controlling these parasites has relied on chemical treatments, but these proved extremely damaging to the environment and to human health and have been banned (Zasada et al., 2010; Abad & Williamson, 2010). The fight against RKNs is now largely based on the use of plant cultivars bearing resistance genes (Williamson & Roberts, 2010). However, resis-tance breaking by virulent nematodes has been demonstrated in the laboratory
(Jarquin-Barberena et al., 1991; Djian-Caporalino et al., 2011; Meher et al., 2009) and is more and more observed in field conditions (Verdejo-Lucas et al., 2009). As for other plant parasites, virulence in RKNs is associated with a fitness cost, and it was shown that vir-ulence reduces the capacity to infect the plant, as well as the number of eggs laid per female (Castagnone-Sereno et al., 2007; Djian-Caporalino et al., 2011). Therefore, set-ting up rotation strategies of resistant and susceptible cultivars has the potential to increase the durability of resistance genes and the efficacy of resistance–based nematode control. However, field tests of deployment strategies in terms of epidemiological control and re-sistance durability remain difficult, owing to their labor intensive nature and to the long time horizons involved (Djian-Caporalino et al., 2014).
In these conditions, modelling approaches constitute a powerful way to explore resistant plant deployment strategies and assess their efficiency to reduce yield losses and increase control durability (Brown, 2015; Papa¨ıx et al., 2018). Unfortunately, the literature is very poor in theoretical modelling studies addressing the control of soil-borne pathogens with limited dispersal, such as RKNs. For instance, most studies deal with pathogens that can disperse over large spatial scales (Gilligan, 1995; Thrall et al., 1997; Otten & Gilli-gan, 2006; Fabre et al., 2012; Djidjou-Demasse et al., 2017; Lof & van der Werf, 2017). RKNs, in contrast, have very limited mobility in the soil, feeding and reproducing locally in the plant root system. Consequently, nematode populations barely mix and strategies based on spatial arrangements are poorly applicable. In addition, the major RKN species reproduce solely by clonal reproduction so that techniques based on recombination be-tween virulent and avirulent genotypes do not operate. The purpose of this study was to assess quantitatively whether rotation strategies between susceptible and RKN-resistant cultivars can be efficient to control RKNs, and to determine which optimal crop rotation strategies should be used to maximise crop yield over several seasons. We did this by building a semi-discrete plant epidemic model (Fabre et al., 2012; Mailleret & Lemesle, 2009; Mailleret et al., 2012), tailored to the RKN pathosystem. The model describes the within-season dynamics of the interaction between a plant root system and RKNs, the owerwintering dynamics between consecutive seasons and the potential evolution of the nematode population from avirulent to virulent forms. The model was parameterized from the literature and fitted to experimental data (Ehwaeti et al., 1998). We used the model to compute optimal crop rotation strategies with respect to a proxy of crop yield over different time horizons. Given that the fitness costs vary among R-genes and nema-tode strains, and are crucial to the durability of R-genes, we payed special attention to
the influence of these genetic parameters. We evaluated to what extent crop rotation pro-vided better crop yield than the widely used resistant plant-only strategy (pure resistant strategy) for different epidemiological scenarios and genetic parameters. We also tested the robustness of our results to determine whether the effectiveness of optimal periodic rotations can be maintained even if epidemiological and genetic parameters are not known precisely. We investigated the key factors to be taken into account for optimal resistance plant deployment strategies against RKNs. Our results showed that crop rotation can very often increase crop yield significantly, in all scenarios tested. The efficacy of optimal rota-tion strategies also proved robust to parameter uncertainty; specifically, optimal rotarota-tions consistently outperformed the resistant-only strategy.
Model description
Study system
We focused on root-knot nematodes (RKNs) of the species Meloidogyne incognita. These are obligate endoparasites of plant roots, and reproduce only by clonal reproduction. M. incognitais one of the most prevalent species in the warm conditions of Mediterranean countries, especially in protected crops (Wesemael et al., 2011). The life cycle of M. incognitaconsists in four stages that can be achieved in three to five weeks, depending on environmental conditions (Abad & Williamson, 2010). Second-stage juveniles dwell in the soil and penetrate the plant when a root grows in their vicinity. Once a nematode reaches the vascular cylinder of the root, salivary secretions induce the creation of a feed-ing site. These are composed of five to six hypertrophied plant cells, known as giant cells. The nematode spends the rest of its life in this feeding site, where it develops until repro-duction. When mature, adult females release several hundreds of eggs (between 300 to 2000 eggs/female on average) outside the root, that will hatch into free living juveniles and complete the cycle (Fig. 1).
In the Solanaceae plant family, a few resistance genes are known to block the development and reproduction of RKNs: the Mi-1 gene in tomato (Milligan et al., 1998) and the N, Me-1and Me-3 genes in sweet pepper (Djian-Caporalino et al., 2007, 2011). The most pervasive resistance breakdown issue consists in the Mi-1 gene being overcome by M. incognita(Ornat et al., 2001; Seid et al., 2015). Mi-1, originally from the wild species Solanum peruvianum, was introgressed into tomato by interspecific crosses in the early
• • V ascular cylinder Giant cells Infective juvenile Adult female Egg mass Roots Eggs hatch
Fig. 1 The life cycle of root-knot nematodes – adapted from Williamson & Gleason (2003) and Abad & Williamson (2010).
1940s. The first resistant varieties appeared on the market by the end of that decade. Since then, many resistant varieties have been globally deployed, all bearing the same resistance gene. Nowadays, resistance breaking by M. incognita populations is recorded worldwide, in virtually every area growing tomatoes (Seid et al., 2015). In this study, we will thus use Mi-1: M. incognita as our reference system.
Model of plant-nematode interactions
The interaction between nematodes and plants during a cropping season was modeled as an epidemic of free living pests infesting and spreading among the plant root system. We first consider only avirulent nematodes and a susceptible plant. The model describes in continuous time the changes in four variables: the density of free living nematodes in the soil (Pa), the density of healthy susceptible plant roots (HS) and the density of latent (Ea)
and infectious (Ia) feeding sites induced by nematodes. It is represented by the following
˙ Pa= −β PaHS− ηPa+ rIa, ˙ HS= µx f (HS, E a, Ia) − εaSβ PaHS, ˙ Ea= εaSβ PaHS− λ Ea, ˙ Ia= λ Ea− αIa. (Eqn 1)
When a free living avirulent nematode Pa comes into contact with a portion of healthy
plant root HS, the latter becomes latently infected Ea at rate εaSβ PaHS, where β is the
infection rate and εaS = 1 is a conversion factor between nematode and root densities (Table 1). After a time period 1/λ , the infected root portion becomes infectious (Ia) and
starts producing free living avirulent nematodes (Pa) at rate r. Free living nematodes in
the soil and infectious nematodes in the roots die at rates η and α, respectively. Roots are assumed to grow linearly with time at basic rate µx (Leskovar et al., 1990), where x is a conversion factor between root biomass and root density. Root infection by nematodes is known to impact root growth (Zeck, 1971), which is taken into account through function f(.). This function discounts the basic growth rate by a decreasing exponential function of infection prevalence π = Ea+Ia
HS+E
a+Ia multiplied by a scaling factor k: f (H
S, E
a, Ia) = e−kπ.
The model (Eqn 1) is readily extended to take into account susceptible and resistant plants, as well as the co-occurence of avirulent and virulent nematodes. Variable Pvrepresents the
density of virulent free living nematodes in the soil; similarly Ivand Evrepresent the
den-sities of feeding sites infected by latent and infectious virulent nematodes, respectively. In what follows, superscript X indicates the type of cultivated plant in the current cropping season, i.e. either susceptible (X = S) or resistant (X = R). The model then reads:
˙ Pa= −β PaHX− ηPa+ (1 − δ )rIa, ˙ Pv= −β PvHX− ηPv+ δ rIa+ (1 − wr)rIv, ˙ HX = µx f (HX, E a+ Ev, Ia+ Iv) − εaXβ PaHX− (1 − wβ)ε X v β PvHX, ˙ Ea= εaXβ PaHX− λ Ea, ˙ Ev= (1 − wβ)εvXβ PvHX− λ Ev, ˙ Ia= λ Ea− αIa, ˙ Iv= λ Ev− αIv. (Eqn 2)
Avirulent and virulent nematodes compete for healthy plant roots HX in the following way: avirulent nematodes Pacan infect susceptible plants (εaS=1) but are unable to infect
=1) and susceptible plants (εvS = 1). Importantly, virulent nematodes grow more slowly than avirulent ones because they suffer from fitness costs, at two levels: reduced infec-tiveness (wβ) and reduced reproduction (wr) (Jarquin-Barberena et al., 1991;
Castagnone-Sereno et al., 2007; Meher et al., 2009; Djian-Caporalino et al., 2011). We considered that there was no additional fitness cost (also called ”residual effect”) on resistant plants. Indeed, we conducted statistical tests and found no significant differences in terms of fit-ness costs when virulent nematodes grew on resistant Mi-1 or susceptible tomato plants (Castagnone-Sereno et al., 2007). Furthermore, we assumed that a fraction δ of avirulent nematode offspring are virulent (Castagnone-Sereno et al., 1994), due to mutation and/or epigenetic mechanisms. We also postulated that, once acquired, virulence could not be lost by the virulent lineage (Castagnone-Sereno et al., 1993). We can thus charaterize a resistance gene and its suceptibility to resistance breakdowns with a set of three genetic parameters that: the two fitness costs associated with nematode virulence (wβ and wr) and
the proportion of virulent variants in the nematode offspring (δ ).
The initial conditions of the full multi-seasonal model were set to HX(0) = H0, the
ini-tial root biomass of newly planted individuals, Pa= (1 − pv)P0and Pv= pvP0, where P0
refers to the initial nematode density in the soil and pvto the initial proportion of virulent
nematodes in the soil. Initial values of Ia, Ea, Ivand Evwere set to 0 because plants were
assumed to be healthy at the time they were planted.
At the end of each cropping season, plants are removed. At the beginning of the next cropping season, healthy and infected roots are thus reset to their initial values, H0 and
0, respectively. Nematode densities Pa and Pv are set to their value at the end of the
previous cropping season, multiplied by a survival probability ϕ. The full model of plant nematode interaction over multiple cropping seasons is therefore a hybrid model, with a continuous part to describe the nematode infection dynamics during a cropping season of length τ, and a discrete part to describe nematode survival between seasons and crop planting (Mailleret & Lemesle, 2009; Mailleret et al., 2012). The model is represented graphically in Supporting Information Fig. S1.
For simulations and numerical investigations, models (Eqn 1) and (Eqn 2) were imple-mented using the R software (www.r-project.org) and ordinary differential equations were solved with theDESOLVER package (https://CRAN.R-project.org/package=desolve). We also analyzed the existence and stability of the nematode-free stationary solution and com-puted the season to season basic reproduction numbers R0 for avirulent and virulent
Methods S1.
Model parameterization and epidemiological scenarios
Most parameter values could be set from published estimates in the literature (Table 1). No data were available for three parameters: the infection rate (β ), the conversion factor between root biomass and density of feeding sites (x) and the plant growth scaling factor (k). Their values were thus estimated by fitting model (Eqn 1) to an experimental dataset reporting the final nematode density in plant roots as a function of initial nematode density in the soil (Ehwaeti et al., 1998). Specifically, avirulent M. incognita nematodes were inoculated at controlled densities in the soil, then tomato plants (cv Moneymarker) were planted and the nematode density in the root system was measured after 42 days and 135 days of cultivation. The relative root biomass (i.e. root biomass divided by the control root biomass with no nematode) was also measured. Both measurements after 135 days were used to fit our model, and the measurements at day 42 were compared to predicted values to assess model validity (Fig. 2). More details are available in Supporting Information Methods S2. 0 5 10 15 20 25 0.03 0.16 0.8 4 20
Initial nematode density
Final nemat ode density i n roots (a) 0 0.5 1.0 1.5 0.03 0.16 0.8 4 20 42 days (prediction)
135 days (training set) 135 days (training set)
42 days (prediction)
(b)
Relative root bioma
ss
Initial nematode density
Fig. 2 Fit of the model to experimental data over one cropping season (Ehwaeti et al., 1998). (a) Final density of nematodes in the roots and (b) relative biomass after 42 (in green) and 135 days (in blue), as functions of the initial density of nematodes in the soil (log scale). Model outputs are shown as solid curves, circles and triangles represent experimental measurements.
data on the Mi-1 resistant tomato Castagnone-Sereno et al. (2007). All parameters are summarised in Table 1.
From the estimated parameter values, we performed a global sensitivity analysis (Saltelli et al., 2008) and defined four contrasted epidemiological scenarios. We carried out the analysis with the multi-seasonal model (Eqn 2), over 15 seasons of susceptible plant cul-tivation. We varied epidemiological parameters (values given in Table 1) and determined their impact on a crop yield proxy, the healthy root density HRD defined below in (Eqn 3). More details are available in Supporting Information Methods S3. The most influential parameters were found to be the nematode reproduction rate r, the nematode mortality rate in the soil η, the infection rate β and the nematode mortality rate in the root α. By varying these parameters around their estimated values, we created four epidemiologi-cal scenarios, corresponding to different levels of nematode agressiveness, form low to extreme (Table 2).
Resistance deployment strategies
We considered several resistance deployment strategies: the two “pure” resistant-only and susceptible-only strategies, consisting in planting one crop type all the time; periodic rotation strategies, alternating resistant and susceptible plants according to a repeated pattern; and unconstrained strategies, i.e. arbitrary sequences of susceptible and resistant plants.
The performance of each strategy was quantified with the “healthy root density” (HRD), a proxy of crop yield defined as the mean of the integral of healthy plant root densities over the n cropping seasons:
HRD= 1 n n
∑
i=1 Z ithseasonH X(t)dt (Eqn 3)This quantity is similar to the healthy leaf area duration (HAD), the integral of healthy green canopy area during a growing season, used by many authors for airborne pathogens (Waggoner & Berger, 1987; Gooding et al., 2000; Van den Bosch & Gilligan, 2003; Lo Ia-cono et al., 2012; Elderfield et al., 2018; Papa¨ıx et al., 2018).
The optimal strategy over a given time horizon of n cropping seasons was defined as the strategy with best performance, i.e. maximising the HRD (Eqn 3). To identify optimal periodic strategies, we computed all periodic rotation strategies between resistant and sus-ceptible crops, beginning with resistant crops and alternating m and p seasons of resistant
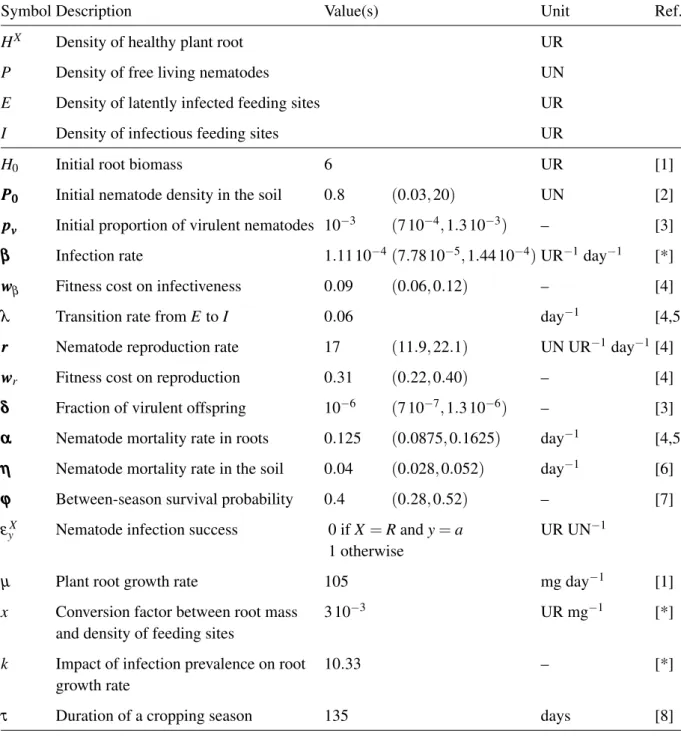
Table 1 Model variables and parameters.
Symbol Description Value(s) Unit Ref.
HX Density of healthy plant root UR
P Density of free living nematodes UN
E Density of latently infected feeding sites UR
I Density of infectious feeding sites UR
H0 Initial root biomass 6 UR [1]
P P
P000 Initial nematode density in the soil 0.8 (0.03, 20) UN [2]
p
ppvvv Initial proportion of virulent nematodes 10−3 (7 10−4, 1.3 10−3) – [3]
β β
β Infection rate 1.11 10−4(7.78 10−5, 1.44 10−4) UR−1 day−1 [*]
w w
wβ Fitness cost on infectiveness 0.09 (0.06, 0.12) – [4]
λ Transition rate from E to I 0.06 day−1 [4,5]
rrr Nematode reproduction rate 17 (11.9, 22.1) UN UR−1day−1[4]
w w
wr Fitness cost on reproduction 0.31 (0.22, 0.40) – [4]
δ δ
δ Fraction of virulent offspring 10−6 (7 10−7, 1.3 10−6) – [3]
α α
α Nematode mortality rate in roots 0.125 (0.0875, 0.1625) day−1 [4,5]
η η
η Nematode mortality rate in the soil 0.04 (0.028, 0.052) day−1 [6]
ϕ ϕ
ϕ Between-season survival probability 0.4 (0.28, 0.52) – [7]
εyX Nematode infection success 0 if X = R and y = a
1 otherwise
UR UN−1
µ Plant root growth rate 105 mg day−1 [1]
x Conversion factor between root mass
and density of feeding sites
3 10−3 UR mg−1 [*]
k Impact of infection prevalence on root growth rate
10.33 – [*]
τ Duration of a cropping season 135 days [8]
Bold parameters were varied for the sensitivity analysis: default value and ±30% variations (indicated in brackets) were tested; larger variations were tested for P0, in line with Ehwaeti et al. (1998).
Units: UR: number of feeding sites per gram of soil; UN: number of nematodes per gram of soil.
Sources: [1] Leskovar et al. (1990); [2] Ehwaeti et al. (1998); [3] Ploeg & Maris (1999); [4] Castagnone-Sereno et al. (2007); [5] Ekanayake (1986); [6] Tsai (2008); [7] Castagnone, unpublished data; [8] Djian-Caporalino, unpublished data; [8] Djian-Djian-Caporalino, unpublished data; [*] Estimated.
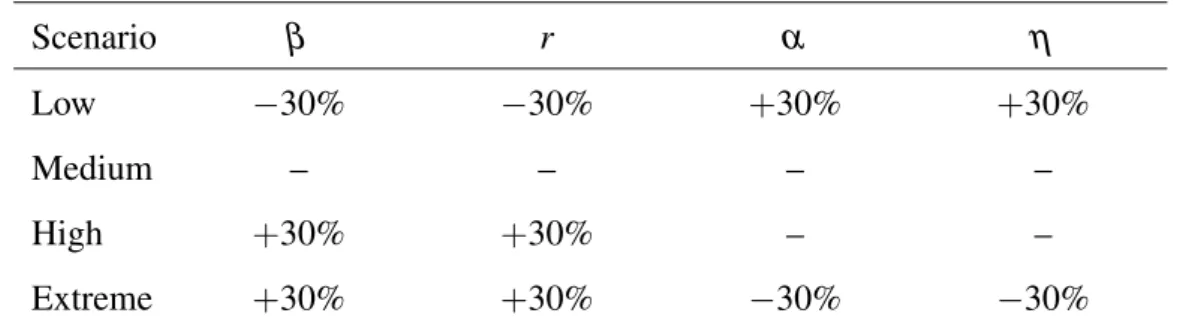
Table 2 Definition of the four epidemiological scenarios based on the four most in-fluential epidemiological parameters: nematode infection rate (β ), reproduction rate (r), mortality in the roots (α) and in the soil (η).
Scenario β r α η
Low −30% −30% +30% +30%
Medium – – – –
High +30% +30% – –
Extreme +30% +30% −30% −30%
Default parameter values (–) or default values ±30% were used (all values in Table 1).
and susceptible plants, respectively. We denoted by mR + pS these periodic strategies. As an example, Fig. 3a displays the HRD of all periodic rotation strategies over a 15-season time horizon. The optimal periodic strategy is 1R + 5S, which corresponds to 1 season of resistant plants followed by 5 seasons of susceptible plants, and so on. A graphical representation in Fig. 3b–d displays the nematode and plant root dynamics over time. We also identified unconstrained optimal strategies by using a genetic algorithm imple-mented through the GENALG R package (https://CRAN.R-project.org/package=genalg). We computed these optimal strategies and the corresponding ratios of resistant plants, i.e. the number of seasons with resistant plants divided by the given time horizon, for all time horizons between 1 and 30 cropping seasons.
We analysed with particular attention the influence of the genetic parameters (fitness costs wβ, wr and the proportion of virulent offspring δ ), possibly in combination with the
epi-demiological scenarios, on the nature and relative performance of optimal rotation strate-gies. Specifically, we sought to determine when optimal rotation strategies could outper-form the usual resistant-only strategy, and to what extent crop yield could be increased by using such rotation strategies.
Finally, we evaluated the robustness of our results to determine to what extent optimal periodic strategies would remain effective if biological parameters were not known with perfect precision. For the medium, high and extreme epidemiological scenarios defined in Table 2, the optimal periodic strategy was computed over a 15-season time horizon and its performance was tested against ±10% variations in the values of six key parameters (ϕ, wr, wβ, P0, pv and δ ), on top of the four epidemiological parameters defining the
parame-R SR RS SR RS S
Time (number of seasons)
1 2 3 4 5 6 7 8 9 10 R R R R R S S R 12 13 14 1 2 3 4 5 6 7 8 9 10 11 12 13 14 1 2 3 4 5 6 7 8 9 10 11
Number of seasons with resistant plants
Number of seasons with susc
eptible pl ants 100 % R 100 % S HRD Pv + Pa Pv Pv + Pa R S 2000 1800 1600 1400 11 12 13 14 15 S S R R R R R R S S (a) (b) (c) (d) 1500 0.0 60 0 0.0 1.0 H X
Proportion of virulent nematode Nematode density
Healthy root mass density
Fig. 3 (a) Performance (HRD, colour scale) of all periodic rotation strategies, according to their number of seasons of resistant (in columns) and susceptible (in rows) plants, over a 15-season time horizon; performance of the susceptible-only and resistant-only strategies are indicated on the color scale; the black-framed strategy is the optimal strategy 1R + 5S. (b–d) Graphical representation of two strategies: the resistant-only strategy (in pink) and the 1R + 5S periodic strategy (in blue), which is optimal over a 15-season time horizon; shaded areas correspond to the inbetween seasons. Default parameter values were used (Table 1).
ters, the periodic strategy was not computed afresh when the key parameters varied. For each epidemiological scenario, we explored this parameter space using a fractional fac-torial design containing 243 parameter combinations. The design was obtained using the PLANORR package (https://CRAN.R-project.org/package=planor).
Results
Optimal deployment strategies
The performance (HRD) of the four types of deployment strategies are shown in Fig. 4a, for different time horizons and the default parameters. As expected, the resistant-only and optimal strategies outperformed the susceptible-only strategy, since the deployment of resistance prevents infection by avirulent nematodes. However, for these strategies, the HRDdecreased with the time horizon. This is also expected, as the deployment of resis-tance also causes virulent nematodes to appear and take over the nematode population.
t Δ2 HRD Δ1 = Δ1 Δ2 (a) (b) gain Time (number of Ratio of r 0 20 40 60 80 100
Time (number of seasons)
Ratio of resistant plant (%) Ratio of resistant pla
nts Temporal horizon Temporal horizon durability 0 10 15 20 25 0 5 15 20 25 30 3750 2500 1250 0 optimal unconstrained optimal periodic rotation 100 % S100 % R
10
Time (number of seasons)
Ratio of resistant plant (%)
Fig. 4 (a) Healthy root density (HRD) and (b) ratio of resistant plants as functions of the time horizon, for different deployment strategies : susceptible-only (green), resistant-only (red), optimal periodic rotation (blue) and optimal unconstrained (black). Different unconstrained optimal strategies (yielding the same HRD) were identified, so the ratio of resistant plants is represented in panel (b) by its range (shaded area) and its average value (black solid curve). Default parameter values were used (Table 1). The durability (HRD loss < 1%) and the relative gain, defined more thoroughly in the text, are illustrated in panel (a).
For up to five years of cultivation, the resistant-only strategy performed as well as any optimal deployment strategy, but over longer time horizons, it could be significantly out-performed. For instance, over 15 cropping seasons the HRD was around 2044 with op-timal strategies, while it had dropped to 1822 for a pure R strategy (Fig. 4a). We also remark that, for all time horizons considered (up to 30 years), the optimal periodic and the unconstrained strategies had almost identical performances. This indicates that peri-odic rotations are almost optimal in this system.
The deployment of a pure resistant-only strategy is thus reasonable for at most five years in this cropping system. Beyond that, the optimal strategy generally was to alternate one season of resistant plants with a few seasons of susceptible plants, as shown for instance in Fig. 3 for a 15-season time horizon (Fig. 4b). This optimal strategy ensures that vir-ulent nematodes remain sufficiently rare in the soil, allowing to sustain the efficiency of resistant plants, which severly reduce the avirulent nematode population. The average ratio over the time horizon for the unconstrained optimal strategy was generally more important than for the optimal periodic rotation strategy (Fig. 4b). For instance, over a 15-season time horizon, the genetic algorithm identified 11 equivalent solutions and the ratio of resistant plants deployed was on average 30%. For the optimal periodic strategy, it was only 25%. Unconstrained optimal strategies identified by the genetic algorithm are actually fairly similar to optimal periodic rotations in terms of structure, except that more resistant plants are used in the final seasons, explaining the higher ratio of resistant plants in unconstrained strategies.
Fig. 4a illustrates the definition of two synthetic metrics that are used in this paper. The first one is the relative gain, defined as the HRD gain obtained by shifting from a resistant-only to an optimal strategy, relative to the gain obtained by shifting from a susceptible-only to a resistant-susceptible-only strategy. For a given number of cropping seasons (i.e. a given time horizon), a positive relative gain indicates that the optimal periodic rotation strat-egy outperforms the resistant-only stratstrat-egy, whereas a negative value indicates that the resistant-only strategy is the best. This metric is useful to determine whether optimal rotation strategies can provide significantly better resistance management.
The second metric, resistance durability, is defined as the number of years during which the resistant-only strategy can be used without losing more than 1% of HRD, compared to the first year the resistance is used. This metric is close to the “the usefulness time” defined by Van den Bosch & Gilligan (2008), i.e. the number of seasons until the yield drops under a preset threshold. This metric helps assess the severity of the resistance
breaking problem at hand. In the following sections, we present results for optimal peri-odic rotation strategies computed over an intermediate 15-season time horizon, as genetic and epidemiological parameters vary.
Influence of fitness costs
We computed the optimal periodic rotation strategies as functions of the two fitness costs on infectiveness (wβ) and reproduction (wr), to explore their effects on the two metrics
defined above: the relative gain brought about by optimal periodic rotations and the resis-tance durability. Results are displayed in Fig. 5a.
1 Fitness cos t on infectivene ss ( wβ ) gain (%) 0 11 26 36 40 0 27 40 55 ratio (%)
Fitness cost on reproduction (wr)
Fitness cos
t on infectivene
ss (
wβ
)
Fitness cost on reproduction (wr)
0 0.2 0.4 0.6 0.8 1 0.2 0.4 0.6 0.8 1 0.8 0.6 0.4 0.2 0 0.2 0.4 0.6 0.8 1
Fig. 5 (a) Relative gain and (b) ratio of resistant plants as functions of the two fitness costs, for optimal periodic strategies computed over a 15-season time horizon. The grey area corresponds to fitness costs for which the resistance was fully durable over the 15-season time horizon. Level curves in red represent different values of the effective fitness cost w∗ defined in (Eqn 4). The black dot and the error bars indicate the default fitness costs and their standard deviations (Castagnone-Sereno et al., 2007).
The area where resistance was durable for (at least) the entire 15-season time horizon is found in the upper right part of the figure. This area corresponds to R-genes associated with very strong fitness costs of one or the other kind (wβ > 0.8 or wr> 0.8). This means
that rotation was unnecessary in such conditions, at least for the time horizon considered. For lower fitness costs, resistance was not durable and thus the use of optimal periodic rotation strategies produced a better crop yield than the resistant-only strategy (positive relative gain).
The relative gain was fairly high, except in two cases. On the one hand, when resistance breaking entailed very low fitness costs (wβ or wr 6 0.12), the relative gain was almost
zero. This is not surprising since for such low fitness costs, virulent nematodes cannot be prevented from overturning the nematode population, even with rotation strategies, as they develop quite well on both resistant and susceptible plants. Cropping resistant plants is then useless and does not provide any increase in yield. On the other hand, R-genes associated with high fitness costs (wβ or wr > 0.7) provided a relative gain of less than
10%. For such fitness costs, resistance durability was in fact quite high (12 to 14 seasons). Therefore, the resistant-only strategy was quite efficient and the additional yield provided by periodic rotations is minimal.
Significant relative gains are thus observed for R-genes inducing medium fitness costs in virulent nematodes. Relative gains can in this case reach values up to 50%. Interestingly, in the literature the fitness cost on reproduction wris estimated between 0.26 and 0.36 and
the fitness cost on infectiveness wβ between 0.03 and 0.15, for the susceptible Saint Pierre tomato cultivar (Castagnone-Sereno et al., 2007). For such realistic fitness cost values, the expected relative gain that could be realised by switching from a resistant-only strategy to an optimal periodic rotation would be between 26% and 43% with a relative gain equal to 28% for the default values parameter values.
The ratio of resistant plants deployed in the optimal periodic rotation strategies in order to achieve such relative gain values were remarkably low, lying between 13% and 27% (Fig. 5b). For the default parameter values, the ratio of resistant plants was 20%. The ratio of resistant plants used in the optimal rotation strategies increased with the values of the fitness costs.
Interestingly, Fig. 5 shows that the fitness cost distribution between infectiveness and re-production is important for crop yield. Indeed, even though the two fitness costs had perfectly symmetrical effects, the level curves of both the relative gain and the ratio of re-sistant plants were markedly concave. Therefore, a balanced distribution of fitness costs (e.g. wβ = wr = 0.4) could lead to a situation where resistance was not durable, while an
uneven distribution (e.g. wr = 0.8, wβ = 0) could lead to a durable situation. The two
fitness costs thus did not act in an additive manner and interacted negatively. The deriva-tion of the multiseason basic reproducderiva-tion number R0of virulent nematodes revealed that
it depended only on the product (1 − wβ)(1 − wr) (Supporting Information Methods S1).
We hence defined an “effective” fitness cost as:
w∗= 1 − (1 − wβ)(1 − wr) = wβ + wr− wβwr, (Eqn 4)
re-sistant plants (Fig. 5). The performance of resistance-based strategies therefore appeared to be entirely determined by this quantity.
In the following, we thus present results in terms of this effective fitness cost w∗.
Interplay between epidemiological scenarios and genetic parameters
We studied the influence of the genetic parameters in interaction with the epidemiological scenarios on the relative gain and durability. Fig. 6 shows the relative gain obtained for a 15-season time horizon as a function of the effective fitness cost (w∗), for different values of the fraction of virulent offspring (δ ) and the four epidemiological scenarios. Parame-ter ranges ensuring resistance durability over the 15-season time horizon were identified (grey areas). δ had no effect on durability according to our definition. Indeed, when only resistant plants were deployed, avirulent nematodes could not reproduce. The resistance was durable as the effective fitness cost w∗overshooted a given threshold, which strongly increased with the severity of the epidemic scenario. For instance, for low aggressiveness of the nematode, R-genes associated with effective fitness costs between 0.20 and 1 were durable (Fig. 6a), while in the extreme scenario, they were durable only for fitness costs larger than 0.95 (Fig. 6d).The relative gain varied significantly according to the genetic parameters and epidemio-logical scenarios, except for the low epidemioepidemio-logical scenario where it remained close to zero (Fig. 6a). In this case, nematode infestation remained very low so that the resistant-only strategy actually provided very good control. The relative gain increased with nema-tode aggressiveness and decreased with the fraction of virulent offspring δ . The best gains were found for R-genes associated with medium to high effective fitness costs(between 0.4 to 0.65). For example, an extreme nematode aggressiveness combined with a low frac-tion of virulent offspring δ = 10−6and a fitness cost w∗= 0.65 yielded a relative gain of up to 58% (Fig. 6d). Hence, nematode aggressiveness tended to increase the advantages of cultivar rotations over the resistant-only strategy.
Robustness of deployment strategies
Finally, we tested the robustness of the optimal periodic rotation strategies by confronting their efficacy to variations in parameter values. Fig. 7 represents the relative gain when applying the optimal periodic strategy computed over a 15-season time horizon for three epidemiological scenarios, in response to 10% parameter variations.
Effective fitness cost
δ
0.001 1e-06 1e-04 Effective fitness cost
Effective fitness cost Effective fitness cost
Relative gai n 0 0.4 0.6 0.8 1 0 0.2 0.4 0.6 0.8 1 0 0.2 0.4 0.6 0.8 1 0 0.2 0.4 0.6 0.8 1 Low (a) (b) (c) (d) High Extreme Medium 60 40 20 0 60 40 20 0 60 40 20 0 60 40 20 0 Relative gai n 0.2
Fig. 6 Graphical representation of the relative gain for a 15-season time horizon for the four epidemiological scenarios (a-d) defined in Table 2, as a function of the effective fitness cost (w∗) and the fraction of virulent offspring (δ ). The default effective fitness cost w∗= 0.37 is represented by the black triangle (Castagnone-Sereno et al., 2007). Grey areas represent the values of w∗ for which the resistance was durable over the 15-season time horizon.
Epidemiological scenarios
Medium
High
Extreme
0 20 40 60 Relative gai n 29 28 38
Fig. 7 Robustness of the relative gain to changes in model parameters for three epi-demiological scenarios: medium, high, extreme. For each scenario, the optimal peri-odic strategy computed over a 15-season time horizon for the default parameters values (Tables 1–2) was applied. The relative gain obtained with the default parameter values (black diamond) and 243 combinations derived from ±10% variations in key parameters (coloured dots) are plotted, as well as the corresponding boxplots.
The relative gain remained positive, but was globally sensitive to the parameter variations tested. For the medium epidemiological scenario, most parameter combinations yielded a relative gain lower than the 28% gain obtained with the default parameter values (black di-amond in Fig. 7). For the other scenarios, combinations yielded lower and higher relative gains.
However, for all epidemiological scenarios and all parameter combinations, the optimal periodic strategy remained more efficient than the resistant-only strategy, since the relative gain remained positive. For instance, the 1R + 5S strategy always performed better than a resistant-only strategy over a 15-season time horizon for the medium epidemiological scenario. In that sense, the relative performance of the optimal periodic strategy was globally very robust to parameter changes.
Discussion
Crop rotation is an efficient strategy
The present study was based on a new model of plant–nematode interactions parameter-ized from the literature and fitted to experimental data, so as to be representative of the tomato–RKN system. As a key result, we found that alternating susceptible and resistant plant cultivars in time can help limit the proportion of virulent nematodes in RKN popu-lations and thereby reduce crop loss importantly. According to our simupopu-lations, relative gains as high as 40% can be achieved, compared to the baseline strategy of deploying only resistant plants, over time horizons of 15 years or more.
The relative gain achievable with optimal crop rotations was found to be greatest in high or extreme epidemiological scenarios, i.e. for very aggressive nematodes. The latter result echoes previous findings on the influence of epidemic intensity on resistance durability in the context of spatial mixtures (Van den Bosch & Gilligan, 2003; Fabre et al., 2012). The gain also increased, to a smaller extent, if the fraction of virulent offspring in avirulent egg-clutches is smaller, and if the culture is sustained over longer temporal horizons. Remarkably, the relative gain obtained from virulence costs similar to those estimated for the Mi-1 resistant gene is close to the maximum achievable gain value Fig. 5a, suggesting that crop rotation is a particularly promising strategy when deploying Mi-1 cultivars. We also found that periodic crop rotation strategies are almost as effective as free (uncon-strained) alternation strategies. This result has considerable importance, since periodic
rotation patterns are in real-world applications much easier for crop growers to imple-ment than complicated unconstrained sequences.
Few recent theoretical studies have considered the deployment of different cultivars over time (alternation strategies). One is Rimbaud et al. (2018), that compared four resis-tance deployment strategies of major resisresis-tance genes: mosaics, mixtures, rotations and pyramiding, to manage cereal rust fungi in agricultural landscapes durably. They found cultivar rotation to be the most efficient in the long-term, once every R-genes had been overcome. In a study of plant virus epidemic control by mixing resistant and susceptible cultivars in space and time, Fabre et al. (2015) identified that in more than 20% of the scenarios considered, optimal strategies involved cultivar rotation at the landscape scale. Studies are even scarcer regarding RKN, for which the literature on cultivar rotation is es-sentially experimental. For these low-dispersing soil-borne pests, data support our mod-elling predictions in suggesting that rotations are an effective way to reduce yield losses and to delay outbreaks (Tzortzakakis et al., 2000; Miller et al., 2006; McSorley, 2011). For instance, Djian-Caporalino et al. (2014) experimentally compared the performance of several strategies to control RKN in vegetable cropping systems, including rotations of two major R-genes in pepper cultivars, over three years. They reported that cultivar rotation can improve epidemiological control and resistance durability. Another study by Talavera et al. (2009) on RKN management compared the effects of four crop rotations between resistant and susceptible tomato plants in a three-year field experiment. Regard-ing crop yield and durability, this study showed that the best strategy consisted in growRegard-ing two resistant cultivars, followed by one susceptible cultivar. This is strikingly consistent with our modelling predictions, since we found that the yield-maximising strategy, over a three-season temporal horizon, is 1R + 2S Fig. 4b. Our modelling results further indicate that the performance of crop rotations for RKN control would be even more pronounced over longer time horizons.
Crop rotation (usually) requires low ratios of resistant plants
Interestingly, the optimal rotation strategies identified in this study were characterised by relatively low ratios of resistant plants, as soon as the temporal horizon exceeded seven cropping seasons (Fig. 5b). Since avirulent nematodes thrive on susceptible plants, low ratios of resistant plants are expected to increase crop loss, especially in the short-term. However, in the longer term, low ratios limit selection for virulent variants, thus
prolon-gating the efficacy of resistant plants when those are deployed. For RKNs, it appears that the relatively fast within-season epidemiological dynamics sets the optimal balance be-tween the two effects at a low ratio of resistant plants. Our results are consistent with Van den Bosch & Gilligan (2003), who showed that, in many instances, low ratios allowed to make the most of resistance, by reducing the selection pressure for virulent pathogens and promoting resistance durability.
Interestingly, studies of spatial deployment strategies tend to report higher optimal ratios of resistant plants. Fabre et al. (2012), working on plant resistance to viruses, demon-strated that optimal ratios were frequently over 50%. For instance, for low fitness costs, the ratio ranged between 50 and 70%, depending on the epidemic profile. Regarding phy-topathogenic fungi, Papa¨ıx et al. (2014) also found that high ratios combined with low levels of variety aggregation provided optimal control of the fungi in agricultural land-scapes. Therefore, the selection pressure in favour of virulent variants seems to be lower when mixing resistant and susceptible cultivars in space compared to alternating them over time.
It should be remarked that low ratios of resistant plants are in total contrast with the cur-rently dominant agricultural practices, based on the regular cropping of tomato cultivars bearing the same Mi-1 resistance gene. Be it in the field or in experimental studies, such resistant-only strategies often fail, and virulent RKNs overcoming resistance have been observed in most tomato growing areas worldwide (Seid et al., 2015). More specifically, experimental findings have shown that three consecutive cropping seasons of the Mi-1 gene in tomatoes were enough for RKNs to overcome the resistance (Eddaoudi et al., 1997; Verdejo-Lucas et al., 2009). These findings are consistent with our results when fitness costs are not too severe, close to available experimental estimates (Castagnone-Sereno et al., 2007; Djian-Caporalino et al., 2011). The intense deployment of resistant cultivars is thus bound to cause boom and bust cycles in this system (Brown & Tellier, 2011). During the boom, crop yield increases rapidly thanks to the use of new resistant cultivar by growers and farmers. Nevertheless, it is followed by a bust, characterised by the rapid breakdown of the resistance by virulent variants and a drop in crop yield. The switch to a new cultivar, carrying a fresh resistance gene, then triggers a new cycle. To break this cycle and preserve the efficiency of resistance genes, which are scarce and valu-able resources, cultivar rotations such as the ones proposed in this study are a feasible and sustainable alternative.
What makes a good resistance gene?
We investigated the effects of varying three mechanistic parameters characterizing how a resistance gene behaves with respect to resistance breaking by RKNs: the fitness cost it imposes on the infectivity of virulent nematodes (wβ), the fitness cost it imposes on their reproduction (wr), and the frequency of virulence appearance in avirulent clutches (δ ).
Obviously, one would seek R-genes that, when overcome, would generate high values of the first two parameters, and low values of the third.
Our results showed that the two fitness costs had interchangeable effects in shaping the population dynamics of virulent variants. However, the two costs interacted negatively, as the benefit of increasing one fitness cost was reduced when the other fitness cost is already high (Fig. 5a). This original result entails that, when evaluating the potential of resistance genes to improve durability, breeders should seek and introgress R-genes with maximal fitness cost on either one or the two components of the nematode life-cycle (reproduction or infectivity), rather than a balanced distribution of the two types of costs. To help address the existence of two different types of fitness costs, a specificity of our model, we derived a simple formula to synthesize the two fitness costs into one effective fitness cost, according to which different resistance genes can be ranked in terms of their durability. Comparatively, the rate of production of virulent nematodes δ had virtually no impact on the durability of resistance genes.
Rotation strategies provided the largest relative benefits over the resistant-only strategy for intermediate fitness costs. Such measurements are not always easily accessible in the literature, but this property seems to hold in a few other studies. For instance, a reinvesti-gation of the simulation data on plant virus epidemics obtained by Fabre et al. (2012) for high epidemic intensities showed that the best relative gains were obtained for intermedi-ate fitness costs. Another study by Rousseau et al. (2019) showed that relative additional gains, provided by combining quantitative and qualitative resistances over qualitative re-sistances only, were most noticeable for intermediate fitness costs. In both studies, the reasons for this were similar to the present study: high fitness costs induced durable re-sistance so that the yield could only be marginally increased, whereas low costs induced poorly efficient resistance that did not benefit from an optimal deployement. R-genes as-sociated with intermediate fitness costs are thus the ones that could benefit the most from improvements in terms of deployment or cultivar genetic background.
Optimal rotations in practice
A major outcome of this work would be to recommend custom optimal resistance de-ployment strategies to crop growers, depending on the temporal horizon sought, but also on the epidemic context, the R-genes to be deployed, and on the agricultural practices that determine model parameter values. However, soil infestation, and epidemiological or genetic parameters are particularly difficult to estimate, and likely subject to consider-able uncertainty. For instance, Djian-Caporalino et al. (2011) found a large variability in the fitness costs on reproduction. To address this issue, we simulated the use of optimal periodic strategies, as computed for reference parameters values, and investigated how their performance responded to parameter variations. We found that the relative gain was globally robust to parameter changes. Thus, optimal periodic rotations can outperform the resistant-only strategy in terms of crop yield even if the relevant parameters are known imperfectly, which is a very desirable property in practice. There are still few studies that investigate the robustness of resistance deployment strategies, or more generally plant pathogen control methods. A similar analysis to parameter misspecification was con-ducted by Hyatt-Twynam et al. (2017) to assess the performance of optimal strategies to control the spread of citrus canker in Florida, using one at a time epidemiological param-eter changes. In the context of fungicide resistance management, Elderfield et al. (2018) found that mixtures always outperformed alternations when parameters varied, but not the deployment strategy. More such studies should arise to help bridge the gap between theoretical resistance deployment strategies and their implementation in the field.
Optimal strategies could feature high year-to-year variations in yield, which may not be economically viable for farmers. Taking advantage of the limited mobility of nematodes, this issue could be adressed by implementing asynchronous crop rotation strategies in different rows or plots, provided that contamination between those be carefully avoided. The seasonal yield variations in each row would average out, ensuring a more stable income for farmers while achieving the performance of the optimal rotation strategy. Currently, Mi-1 is the only resistance gene used in tomato cultivars, which makes our study entirely relevant for the tomato-RKN pathosystem. However, our model could readily be extended to incorporate different R-genes and serve as a basis to evaluate more complex resistance deployment strategies, involving rotations between susceptible and several resistant cultivars, including pyramided ones.
Acknowledgements
This work was funded by INRA and R´egion Sud PACA, France. It was certified by the Terralia competitiveness research cluster. The authors are grateful to the Inria Sophia Antipolis – M´editerran´ee “NEF” computation cluster for providing resources and support.
Author Contribution
VC, LM and ST conceived the research, with input from PC-S and CD-C. SN conducted the research, with input from all co-authors. MM and TP contributed to the research. SN performed the analysis, with input from VC, LM and ST. SN wrote the manuscript, with input from VC, LM, ST. The manuscript was reviewed by PC-S and CD-C.
References
Abad P, Williamson VM. 2010. Plant nematode interaction: A sophisticated dialogue. In: Kader JC, Delseny M, eds. Advances in Botanical Research. London, UK: Aca-demic Press, 147–192.
Barrett LG, Thrall PH, Burdon JJ, Linde CC. 2008. Life history determines genetic structure and evolutionary potential of host-parasite interactions. Trends in Ecology & Evolution23: 678–685.
Biffen RH. 1905. Mendel’s laws of inheritance and wheat breeding. The Journal of Agricultural Science1: 4–48.
Brown JKM. 2015. Durable resistance of crops to disease: A darwinian perspective. Annual Review of Phytopathology53: 513–539.
Brown JKM, Tellier A. 2011. Plant-parasite coevolution: Bridging the gap between genetics and ecology. Annual Review of Phytopathology 49: 345–367.
Castagnone-Sereno P. 2002. Genetic variability of nematodes: A threat to the durability of plant resistance genes? Euphytica 124: 193–199.
Castagnone-Sereno P, Bongiovanni M, Dalmasso A. 1993. Stable virulence against the tomato resistance Mi gene in the parthenogenetic root-knot nematode Meloidogyne incognita. Phytopathology 83: 803–805.
Castagnone-Sereno P, Bongiovanni M, Wajnberg E. 2007. Selection and parasite evolution: A reproductive fitness cost associated with virulence in the parthenogenetic nematode Meloidogyne incognita. Evolutionary Ecology 21: 259–270.
Castagnone-Sereno P, Wajnberg E, Bongiovanni M, Leroy F, Dalmasso A. 1994. Genetic variation inMeloidogyne incognita virulence against the tomatoMi resistance gene: Evidence from isofemale line selection studies. Theoretical and Applied Genetics 88: 749–753.
Chitwood DJ. 2003. Nematicides. In: Wiley J, Sons, eds. Encyclopedia of agrochemi-cals. New York, NY, USA: Encyclopedia of Agrochemicals, 1104–1115.
Cruz CMV, Bai JF, Ona I, Leung H, Nelson RJ, Mew TW, Leach JE. 2000. Predict-ing durability of a disease resistance gene based on an assessment of the fitness loss and epidemiological consequences of avirulence gene mutation. Proceedings of the National Academy of Sciences of the United States of America97: 13500–13505. Cunniffe NJ, Koskella B, Metcalf CJE, Parnell S, Gottwald TR, Gilligan CA. 2015.
Thirteen challenges in modelling plant diseases. Epidemics 10: 6–10.
Dangl JL, Jones JDG. 2001. Plant pathogens and integrated defence responses to infec-tion. Nature 411: 826–833.
Djian-Caporalino C, Molinari S, Palloix A, Ciancio A, Fazari A, Marteu N, Ris N, Castagnone-Sereno P. 2011. The reproductive potential of the root-knot nematode Meloidogyne incognita is affected by selection for virulence against major resistance genes from tomato and pepper. European Journal of Plant Pathology 131: 431–440. Djian-Caporalino C, et al. 2007. Root-knot nematode (Meloidogyne spp.) Me
resis-tance genes in pepper (Capsicum annuum L.) are clustered on the P9 chromosome. Theoretical applied genetics114: 473–486.
Djian-Caporalino C, et al. 2014. Pyramiding, alternating or mixing: Comparative per-formances of deployment strategies of nematode resistance genes to promote plant re-sistance efficiency and durability. Bmc Plant Biology 14: 53.
Djidjou-Demasse R, Moury B, Fabre F. 2017. Mosaics often outperform pyramids: Insights from a model comparing strategies for the deployment of plant resistance genes against viruses in agricultural landscapes. New Phytologist 216: 239–253.
Dury J, Schaller N, Garcia F, Reynaud A, Bergez JE. 2012. Models to support crop-ping plan and crop rotation decisions. A review. Agronomy for Sustainable Develop-ment32: 567–580.
Eddaoudi M, Ammati M, Rammah A. 1997. Identification of the resistance breaking populations of Meloidogyne on tomatoes in Morocco and their effect on new sources of resistance. Fundamental and Applied Nematology 20: 285–289.
Ehwaeti ME, Phillips MS, Trudgill DL. 1998. Dynamics of damage to tomato by Meloidogyne incognita. Fundamental and Applied Nematology 21: 627–635.
Ekanayake MDI H M R Kand Vito. 1986. Life cycle and multiplication of Meloidogyne incognitaon tomato and egg plant seedlings. Tropical Agriculturist 142: 59–68. Elderfield JAD, Lopez-Ruiz FJ, van den Bosch F, Cunniffe NJ. 2018. Using
epi-demiological principles to explain fungicide resistance management tactics: Why do mixtures outperform alternations? Phytopathology 108: 803–817.
Fabre F, Bruchou C, Palloix A, Moury B. 2009. Key determinants of resistance durabil-ity to plant viruses: Insights from a model linking within- and between-host dynamics. Virus Research141: 140–149.
Fabre F, Rousseau E, Mailleret L, Moury B. 2012. Durable strategies to deploy plant resistance in agricultural landscapes. New Phytologist 193: 1064–1075.
Fabre F, Rousseau E, Mailleret L, Moury B. 2015. Epidemiological and evolutionary management of plant resistance: Optimizing the deployment of cultivar mixtures in time and space in agricultural landscapes. Evolutionary Applications 8: 919–932. Flor H. 1971. Current status of gene-for-gene concept. Annual Review of Phytopathology
9: 275–296.
Garc´ıa-Arenal F, Fraile A. 2013. Trade-offs in host range evolution of plant viruses. Plant Pathology62: 2–9.
Garcia-Arenal F, Fraile A, Malpica JM. 2003. Variation and evolution of plant virus populations. International Microbiology 6: 225–232.
Gilligan CA. 1995. Modelling soil-borne plant pathogens: Reaction-diffusion models. Canadian Journal of Plant Pathology17: 96–108.
Gooding MJ, Dimmock J, France J, Jones SA. 2000. Green leaf area decline of wheat flag leaves: The influence of fungicides and relationships with mean grain weight and grain yield. Annals of Applied Biology 136: 77–84.
Hammond-Kosack E, Jones JDG. 1997. Plant disease resistance genes. Annual Review of Plant Physiology and Plant Molecular Biology48: 575–607.
Hyatt-Twynam SR, Parnell S, Stutt ROJH, Gottwald TR, Gilligan CA, Cunniffe NJ. 2017. Risk-based management of invading plant disease. New Phytologist 214: 1317– 1329.
Jarquin-Barberena H, Dalmasso A, de Guiran G, Cardin MC. 1991. Acquired vir-ulence in the plant parasitic nematode Meloidogyne incognita: Biological analysis of the phenomenon. Revue de nematologie 14: 299–303.
Johnson R. 1981. Durable resistance: Definition of, genetic control, and attainment in plant breeding. Phytopathology 71: 567–568.
Jones J, Gheysen G, Fenoll C, eds. 2011. Genomics and molecular genetics of plant-nematode interactions. Dordrecht, Netherlands: Springer.
Jones JDG, Dangl JL. 2006. The plant immune system. Nature 444: 323–329.
Kiyosawa S. 1982. Genetics and epidemiological modeling of breakdown of plant-disease resistance. Annual Review of Phytopathology 20: 93–117.
Laine AL, Tellier A. 2008. Heterogeneous selection promotes maintenance of polymor-phism in host–parasite interactions. Oikos 117: 1281–1288.
Leach JE, Vera Cruz CM, Bai J, Leung H. 2001. Pathogen fitness penalty as a predictor of durability of disease resistance genes. Annual Review of Phytopathology 39: 187– 224.
Leonard K. 1977. Selection pressures and plant pathogens. Annals of the New York Academy of Sciences287: 207–222.
Leskovar D, Cantliffe D, Stoffella P. 1990. Root growth and root-shoot interaction in transplants and direct seeded pepper plants. Environmental and Experimental Botany 30: 349–354.
Lo Iacono G, van den Bosch F, Paveley N. 2012. The evolution of plant pathogens in response to host resistance: Factors affecting the gain from deployment of qualitative and quantitative resistance. Journal of Theoretical Biology 304: 152–163.
Lof ME, van der Werf W. 2017. Modelling the effect of gene deployment strategies on durability of plant resistance under selection. Crop Protection 97: 10–17.
Mailleret L, Castel M, Montarry J, Hamelin FM. 2012. From elaborate to compact seasonal plant epidemic models and back: Is competitive exclusion in the details? The-oretical Ecology5: 311–324.
Mailleret L, Lemesle V. 2009. A note on semi-discrete modelling in the life sciences. Philosophical Transactions of the Royal Society A: Mathematical, Physical and Engi-neering Sciences367: 4779–4799.
McDonald BA, Linde C. 2002. Pathogen population genetics, evolutionary potential, and durable resistance. Annual Review of Phytopathology 40: 349–379.
McSorley R. 2011. Assessment of rotation crops and cover crops for management of Root-Knot Nematodes (Meloidogyne spp.) in the Southeastern United States. Nemat-ropica41: 200–214.
Meher HC, Gajbhiye VT, Chawla G, Singh G. 2009. Virulence development and ge-netic polymorphism in Meloidogyne incognita (Kofoid & White) Chitwood after pro-longed exposure to sublethal concentrations of nematicides and continuous growing of resistant tomato cultivars. Pest Management Science 65: 1201–1207.
Miller DR, Chen SY, Porter PM, Johnson GA, Wyse DL, Stetina SR, Klossner LD, Nelson GA. 2006. Rotation crop evaluation for management of the soybean cyst nematode in Minnesota. Agronomy Journal 98: 569–578.
Milligan SB, Bodeau J, Yaghoobi J, Kaloshian I, Zabel P, Williamson VM. 1998. The root knot nematode resistance gene Mi from tomato is a member of the leucine zipper, nucleotide binding, leucine-rich repeat family of plant genes. The Plant Cell 10: 1307–1319.
Montarry J, Hamelin FM, Glais I, Corbi`ere R, Andrivon D. 2010. Fitness costs associated with unnecessary virulence factors and life history traits: Evolutionary
in-sights from the potato late blight pathogen Phytophthora infestans. BMC Evolutionary Biology10: 283.
Mundt CC. 2002. Use of multiline cultivars and cultivar mixtures for disease manage-ment. Annual Review of Phytopathology 40: 381–410.
Mundt CC. 2014. Durable resistance: A key to sustainable management of pathogens and pests. Infection, Genetics and Evolution 27: 446–455.
Ornat C, Verdejo-Lucas S, Sorribas FJ. 2001. A population of Meloidogyne javanica in Spain virulent to the Mi resistance gene in tomato. Plant Disease 85: 271–276. Otten W, Gilligan CA. 2006. Soil structure and soil-borne diseases: Using
epidemio-logical concepts to scale from fungal spread to plant epidemics. European Journal of Soil Science57: 26–37.
Palumbi SR. 2001. Humans as the worlds greatest evolutionary force. Science 293: 1786–1790.
Papa¨ıx J, Rimbaud L, Burdon JJ, Zhan J, Thrall PH. 2018. Differential impact of landscape-scale strategies for crop cultivar deployment on disease dynamics, resistance durability and long-term evolutionary control. Evolutionary Applications 11: 705–717. Papa¨ıx J, Touzeau S, Monod H, Lannou C. 2014. Can epidemic control be achieved by altering landscape connectivity in agricultural systems? Ecological Modelling 284: 35–47.
Parlevliet JE. 2002. Durability of resistance against fungal, bacterial and viral pathogens; present situation. Euphytica 124: 147–156.
Perry RN, Moens M, Starr JL, eds. 2010. Root-Knot Nematodes. Wallingford, UK: CABI Publishing.
Pink DaC. 2002. Strategies using genes for non-durable disease resistance. Euphytica 124: 227–236.
Ploeg AT, Maris PC. 1999. Effects of temperature on the duration of the life cycle of a Meloidogyne incognita population. Nematology 1: 389–393.
Rimbaud L, Papa¨ıx J, Barrett LG, Burdon JJ, Thrall PH. 2018. Mosaics, mixtures, rotations or pyramiding: What is the optimal strategy to deploy major gene resistance? Evolutionary Applications11: 1791–1810.
Rousseau E, Bonneault M, Fabre F, Moury B, Mailleret L, Grognard F. 2019. Virus epidemics, plant-controlled population bottlenecks and the durability of plant resis-tance. Philosophical Transactions of the Royal Society B: Biological Sciences 374. Saltelli A, Ratto M, Andres T, Campolongo F, Cariboni J, Gatelli D, Saisana M,
Tarantola S. 2008. Global sensitivity analysis: The primer. Chichester, UK: John Wiley & Sons.
Seid A, Fininsa C, Mekete T, Decraemer W, Wesemael WML. 2015. Tomato (Solanum Lycopersicum) and root-knot nematodes (Meloidogyne spp.) – a century-old battle. Nematology 17: 995–1009.
Springmann M, Godfray HCJ, Rayner M, Scarborough P. 2016. Analysis and valu-ation of the health and climate change cobenefits of dietary change. Proceedings of the National Academy of Sciences113: 4146–4151.
Stahl EA, Dwyer G, Mauricio R, Kreitman M, Bergelson J. 1999. Dynamics of disease resistance polymorphism at the Rpm1 locus of Arabidopsis. Nature 400: 667–671. Stoate C, Baldi A, Beja P, Boatman ND, Herzon I, van Doorn A, de Snoo GR, Rakosy
L, Ramwell C. 2009. Ecological impacts of early 21st century agricultural change in europe - a review. Journal of Environmental Management 91: 22–46.
Stukenbrock EH, McDonald BA. 2008. The origins of plant pathogens in agro-ecosystems. Annual Review of Phytopathology 46: 75–100.
Stuthman DD, Leonard KJ, Miller-Garvin J. 2007. Breeding crops for durable re-sistance to disease. In: Sparks D, ed. Advances in agronomy. London, UK: Academic Press, 319–367.
Talavera M, Verdejo-Lucas S, Ornat C, Torres J, Vela MD, Macias FJ, Cortada L, Arias DJ, Valero J, Sorribas FJ. 2009. Crop rotations with Mi gene resistant and susceptible tomato cultivars for management of root-knot nematodes in plastic houses. Crop Protection28: 662–667.
Thrall PH, Bever JD, Mihail JD, Alexander HM. 1997. The population dynamics of annual plants and soil-borne fungal pathogens. Journal of Ecology 85: 313–328. Tian D, Traw MB, Chen JQ, Kreitman M, Bergelson J. 2003. Fitness costs of
R-gene-mediated resistance in Arabidopsis thaliana. Nature 423: 74–77.
Tilman D, Balzer C, Hill J, Befort BL. 2011. Global food demand and the sustainable intensification of agriculture. Proceedings of the National Academy of Sciences 108: 20260–20264.
Tilman D, Fargione J, Wolff B, D’Antonio C, Dobson A, Howarth R, Schindler D, Schlesinger WH, Simberloff D, Swackhamer D. 2001. Forecasting agriculturally driven global environmental change. Science 292: 281–284.
Trudgill DL, Blok VC. 2001. Apomictic, polyphagous root-knot nematodes: Excep-tionally successful and damaging biotrophic root pathogens. Annual Review of Phy-topathology39: 53–77.
Tsai BY. 2008. Effect of temperature on the survival of Meloidogyne incognita. Plant Pathology Bulletin17: 203–208.
Tzortzakakis EA, Phillips MS, Trudgill DL. 2000. Rotational management of Meloidogyne Javanicain a small scale greenhouse trial in Crete, Greece. Nematropica 30: 167–176.
Van den Bosch F, Gilligan CA. 2003. Measures of durability of resistance. Phytopathol-ogy93: 616–625.
Van den Bosch F, Gilligan CA. 2008. Models of fungicide resistance dynamics. Annual Review of Phytopathology46: 123–147.
Van Lenteren JC, Bolckmans K, K¨ohl J, Ravensberg WJ, Urbaneja A. 2018. Bio-logical control using invertebrates and microorganisms: Plenty of new opportunities. BioControl63: 39–59.
Verdejo-Lucas S, Cortada L, Sorribas FJ, Ornat C. 2009. Selection of virulent popu-lations of Meloidogyne javanica by repeated cultivation of Mi resistance gene tomato rootstocks under field conditions. Plant Pathology 58: 990–998.