HAL Id: hal-00569678
https://hal.archives-ouvertes.fr/hal-00569678
Submitted on 25 Feb 2011HAL is a multi-disciplinary open access archive for the deposit and dissemination of sci-entific research documents, whether they are pub-lished or not. The documents may come from teaching and research institutions in France or abroad, or from public or private research centers.
L’archive ouverte pluridisciplinaire HAL, est destinée au dépôt et à la diffusion de documents scientifiques de niveau recherche, publiés ou non, émanant des établissements d’enseignement et de recherche français ou étrangers, des laboratoires publics ou privés.
Net emission of ArH2He thermal plasmas at
atmospheric pressure
Yann Cressault, M E Rouffet, A Gleizes, E Meillot
To cite this version:
Yann Cressault, M E Rouffet, A Gleizes, E Meillot. Net emission of ArH2He thermal plasmas at at-mospheric pressure. Journal of Physics D: Applied Physics, IOP Publishing, 2010, 43 (33), pp.335204. �10.1088/0022-3727/43/33/335204�. �hal-00569678�
Net emission of Ar-H
2-He thermal plasmas at atmospheric
pressure
Y Cressault
1,2, M E Rouffet
1,2, A Gleizes
1,2and E Meillot
31
Université de Toulouse, UPS, INPT, LAPLACE (Laboratoire Plasma et
Conversion d'Energie), 118 route de Narbonne, F-31062 Toulouse Cedex 9,
France
2
CNRS, LAPLACE, F-31062 Toulouse, France
3CEA-DAM, Le Ripault, F-37260 Monts, France.
E-mail: cressault@laplace.univ-tlse.fr
Abstract
The Net Emission Coefficient (NEC) has been calculated for Ar-H2-He thermal plasmas and for a temperature range from 5000K to 30000K. The plasma is supposed to be in Local Thermodynamic Equilibrium (LTE) at atmospheric pressure. This study takes into account the radiation resulting from the atomic continuum, the molecular continuum, and the atomic lines. A particular attention has been paid to the treatment of helium lines broadenings. The results of net emission coefficients are presented for pure gases and Ar-H2-He mixtures. Radiation is weak in pure helium at low temperatures because of the high ionization energy of this species. On the opposite, at very high temperature, the influence of hydrogen tends to decrease because ionic lines do not exist for this last species. Finally, a small proportion of helium in Ar-H2 mixtures does not change the net emission coefficient because of the weak intensity of the helium lines.
1. Introduction
In plasma spraying, the arc and the jet are often established in an argon-hydrogen mixture, thus creating a rather high plasma enthalpy brought by hydrogen combined to a large momentum due to the argon mass. Nevertheless, in industrial conditions, different microstructures of the material deposition are required and depend on the velocity, size and melting conditions of the splashing particles [1]. Changing these parameters is not easy but can be obtained by using various types of gases or gas mixtures. Ternary mixtures, particularly those containing argon, hydrogen and helium, are known to be good candidates such as plasma gases. In this case, the operating conditions and the plasma
Consequently, the bases of calculation and some results relative to the net emission of radiation for the binary and ternary mixtures are presented in this paper.
The calculation of the radiation is based upon the previous knowledge of the equilibrium composition and on the calculation of all emission and absorption phenomena including atomic continuum (radiative attachment, Bremsstrahlung, radiative recombination), molecular continuum (photo-dissociation and photo-ionization) and line radiation (line profile and broadenings). The main difficulties concerned the bibliographical study of the basic data and the study of the line broadening mechanisms. The line contribution is treated using the notion of escape factor which is calculated for each line as a function of temperature. In the case of hydrogen and helium, linear Stark effect must be taken into account contrarily to the general case where quadratic Stark effect is dominant. Indeed, for hydrogen-like species (H, He+), the interactions are characterized by a r-2 linear dipolar potential. The line profile is then broadened by linear Stark effects due to the presence of the ions. For atoms having more than one electron, the electric field leads to shift the energy levels proportionally to the square of the force corresponding to this electric field. Consequently, the interactions can be characterized by two potentials: a r-3 quadrupolar potential or a r-4 quadratic potential. The literature proposes many numerical or experimental values for the broadenings of argon or hydrogen lines [10-16] whereas data for helium lines are often given by measured or calculated Stark Broadenings of selected lines [17-19]. Therefore, this work studies with a particular attention the broadening lines of helium atoms and their absorption. The net emission coefficient (NEC) is then calculated in a classical way for thermal plasmas, i.e. considering an isothermal plasma sphere of radius Rp. The results are presented for
atmospheric thermal plasmas in a temperature range between 5000K and 30 000K, and various gas proportions in the mixture.
In this paper, the first part briefly presents the calculation of the plasma composition, while the second part is devoted to a presentation of the net emission coefficient method and to various radiative processes responsible for the radiation of a thermal plasma. A study of helium lines is done and their broadenings are compared to experimental results issued from literature and used to validate our calculations. Finally, the last part presents some results of the net emission coefficient obtained at atmospheric pressure for pure gases (Ar, H2 and He), binary gases with molar proportions (Ar-H2 and
Ar-He) and a typical ternary mixture 53%Ar-12%H2-35%He.
2. Plasma composition
The first step consists in calculating the equilibrium composition of the plasma versus the temperature and the pressure. At atmospheric pressure, the following gaseous species are only taken into account: electrons, Ar, He, H, H2, Ar+, He+, H+, H2+, Ar++, He++, Ar+++, H-, He-, H2-.
The numerical method used to calculate the equilibrium composition of the plasma is based upon the mass action law and on the basic chemical concept defined by Godin and Trepanier [20]. This law
enables the generation of as many equations as there are independent chemical processes existing in a plasma. For a given reaction, this law is written as:
(
)
∏
∏
= ==
N i i Vol Tot N i i i iQ
n
1 , 1 ν ν (1)With N the total number of chemical species considered in this reaction, νi the corresponding stoechiometric coefficients, ni and QToti ,Vol the number density and the total volumetric partition
function of the species i respectively. i Vol Tot Q , is given by :
−
π
=
T
k
E
T
Q
h
T
k
m
T
Q
B ref i i B i i Vol Tot(
)
exp
2
)
(
int 2 / 3 2 , (2)where Qinti (T) is the internal partition function of the species i and Eiref its reference energy calculated
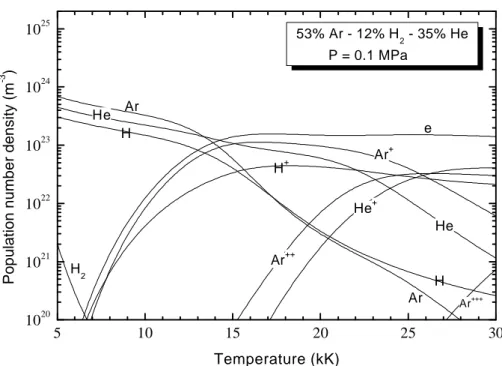
from the formation enthalpy defined in Janaf tables [21]. The knowledge of the partition function is essential to enable the establishment of the composition calculation. This step requires a great amount of data which can be determined either from literature or thanks to appropriate formulas depending on the nature of the species: atomic or molecular species [23, 24]. Internal partition functions of atoms and their positive ions are taken from Drawin and Felenbok [22]; internal partition functions were assumed to be equal to the degeneracy of the ground state for negative atomic ions; they were calculated with the Morse potential minimization method [23, 24] for diatomic species. The spectroscopic data (Dunham coefficients, vibrational frequencies and degeneracies, rotational constants, moments of inertia and symmetry numbers) essential to the calculation of the internal partition functions of molecules were taken from Chase et al [21] and Huber and Herzberg [25]. Finally, the charged species generate a Coulombian field which creates an interaction potential modifying the state of the plasma. This effect is crucial at high temperature when the population number densities of charged particles are important. Also, at low temperatures and for pressures higher than the atmospheric pressure, the interactions between neutral particles imply a correction of the perfect gas law. Therefore, the Debye-Hückel and the Viriel corrections [28] have been considered. Figure 1 shows the plasma composition obtained for the 53%Ar-12%H2-35%He (in molar
proportions) mixture at atmospheric pressure whereas Figure 2 compares the electron number density obtained in the case of pure plasmas (Ar, H, He) and binary mixtures (50%Ar-50%H,
50%Ar-5 10 15 20 25 30 1020 1021 1022 1023 1024 1025 H He Ar H2 H+ H He+ Ar+++ Ar++ Ar+ e He Ar 53% Ar - 12% H2 - 35% He P = 0.1 MPa
Population number density (m
-3 )
Temperature (kK)
Figure 1. Plasma composition at atmospheric pressure for 53%Ar-12%H2-35%He mixture.
5 10 15 2 0 2 5 3 0 102 0 102 1 102 2 1x10² 3 102 4 P = 0 . 1 M P a
Electron number density (m
-3 ) T e m p e r a t u r e ( k K ) P u r e a r g o n P u r e h y d r o g e n Pure helium 5 0 % A r - 5 0 % H e 5 0 % A r - 5 0 % H 2
Figure 2. Electron number density for pure gases, 50%Ar-50%He and 50%Ar-50%H2 mixtures.
at atmospheric pressure (molar proportions).
The ionization energies of argon and hydrogen being rather close, a slight difference in the electron number density for these two pure plasmas or mixtures can be noticed in this temperature range. On one hand, for temperatures above 25 kK, the absence of multi-charged particles for pure hydrogen plasma generates a faster decrease of the electron number density contrarily to the case of pure argon or pure helium plasma whose electrical neutrality is still ensured by the presence of the positive ions
Ar+ and Ar++, or He+ and He++. Between 25kK and 30kK, the electron number density decreases of
some 5 % for pure argon or helium plasmas while it decreases of approximately 17 % in the case of a pure hydrogen plasma. On the other hand, for temperatures lower than 25kK, the electron number density for pure helium plasmas is largely lower than the electron number densities for pure argon or pure hydrogen. This result is due to the high ionization energy of the neutral helium He (24,580eV) in opposite to the ionization energies of argon Ar (15,7596eV) and hydrogen H (13,598eV).
3. The method of the Net Emission Coefficient calculation
The divergence of the radiative flux is an important term in the energy balance. The latter represents the radiative losses and can be determined by the resolution of the radiative transfer equation. For a direction defined by the normal unit vector
n
, we have:∫∫
Ω
⋅
⋅
⋅
Ω
⋅
λ
=
L
λr
d
S
n
d
d
F
r
rad(
r
,
r
)
r
r
(3) with(
)
L
(
T
)
K
'(
s
)
K
'(
s
)
L
(
T
)
ds
s
dL
o λ λ λ λ λ=
−
(4)where Frrad is the radiative flux (W/m2), L (T)
? is the spectral radiation intensity (W.m
-2.sr-1.m-1),
S
r
isthe vector orthogonal to the surface S, dΩ is the solid angle, s is the distance along the considered direction. In equation (4), '
λ
K represents the spectral absorption coefficient at wavelength λ and corrected by induced emission. Loλ(T) is the spectral radiation intensity of the black body.
A rigorous calculation would consist in resolving this equation for all wavelengths of the spectrum and for all directions. For a practical problem, the calculation time would be extremely long. Some methods have therefore been developed in order to simplify the spectral or geometrical dependencies of the radiation while keeping a good accuracy. For a detailed description of the different existing methods, the reader will find references into the general works of Siegel [29] and Modest [30]. One of the frequently applied methods in the numerical models destined to thermal plasmas is the NEC [31, 32] which takes into account emission and absorption of radiation in isothermal conditions
To calculate this coefficient, three assumptions have to be considered:
32]. This assumption is satisfactory for the central regions of the arc where the temperatures are the highest, the gradients the weakest and the emission the most important.
- the plasma is assimilated to a sphere of radius Rp. Libermann and Lowke [33] have shown
that an isothermal cylindrical plasma could be assimilated to an isothermal sphere which would have the same temperature (with a discrepancy of 10%) as the emitting point in its centre. The radiation is then calculated at this centre and considers the emission and absorption of the points included in this sphere.
For a given pressure, the expression of the NEC is the following:
(
−
⋅
)
⋅
λ
⋅
⋅
=
ε
N(
T
,
R
p)
∞∫
L
oλ(
T
)
K
λ(
T
)
exp
K
λ'(
T
)
R
Pd
0 ' (5) In spite of the strong approximation of isothermal plasma, this net emission coefficient gives acceptable values for the radiative balance in the hottest regions of thermal plasmas [34]. Indeed the local emission depends on the local temperature, whereas the main self-absorption occurs in the very near surroundings of the emission point as it will be pointed in the results.The main difficulty of this method consists not only of the calculation of the spectral absorption coefficient Kλ'(T) which strongly varies according to the wavelength and temperature, but also of the calculation of the radiation lines including their absorption. Therefore, various physical phenomena must be considered: the radiation of the atomic continuum (radiative recombination, Bremsstrahlung and radiative attachment), the radiation of the H2 molecular continuum (dissociation,
photo-ionization and photo-attachment) and the radiation of the atomic lines (by taking into account the absorption phenomena).
4. Continuum radiation
Two types of transitions constitute the atomic continuum: the free-free (Bremsstrahlung) and the bound-free (radiative attachment and radiative recombination) transitions.
- The radiative attachment: the radiation due to the attachment is calculated according to the
expression given by Gleizes et al [34]. To obtain the absorption coefficient for hydrogen H-, the
photo-detachment cross section given by McDaniel [35] was used. The radiative attachment of helium He- is
neglected in the total spectral absorption coefficient.
- The radiative recombination: this mechanism is important in the continuum emission for thermal
plasmas. The radiation is calculated according to the method of the Scaled Thomas-Fermi potential [36] that supposes a Maxwell velocity distribution. This method takes into consideration a Coulombian potential for great distances. For short distances, a more complex potential is used in
comparison to the potential used in the quantum defect method developed by Seaton [37]. Therefore, the following expression for the radiative recombination is obtained:
)
(
exp
1
)
(
4
3
2
3
8
)
(
0 ( 1) 2 int 2 ) . . . ( 10 . 44436 . 5 3 2 2 1 3 3 1 2 / 1 3 52T
g
T
k
hc
T
Z
T
Q
N
N
c
e
m
k
c
T
z z b z Z Z e sr K m J o e b rec + + + + + − − − λ λ⋅
⋅
ξ
λ
−
−
⋅
⋅
⋅
λ
⋅
πε
π
=
ε
4
4
4
4
3
4
4
4
4
2
1
(6) where + ZQint is the internal partition function of the Z
+ ion, +
z
Z is its charge number, + Z
e N
N , are the
population number densities of electrons and ions Z+ respectively, + z
g0 is the statistical weight of the
ground state level of Z+ and − + λ
ξ
(z1) represents the Biberman-Schlüter factor of the ( z−1)+Z
atom. Thisfactor, introduced by Biberman and Norman [38,39], is a correction for the difference between the photoionization cross section of the energy levels and the corresponding hydrogen-like cross section. For argon (Ar+
↔
Ar , Ar++↔
Ar+) and helium (He+↔
He), Hofsaess [40] gives values of − +λ
ξ
(z1) fortemperatures ranging from 6000K to 30000K and wavelengths from 30nm to 1000nm. Figure 3 shows this coefficient for helium recombination. For other temperatures and wavelengths, these data are extrapolated. Unfortunately, the Hofsaess data do not cover the range of energy higher than the ionization energy of He (E>24.580eV i.e λ<50nm). In the case of pure helium plasmas, we also compared the spectral absorption coefficients obtained with this extrapolated Biberman-Schlüter factor and the results deduced from the hydrogen-like atoms approximation developed by Okuda [41]. For a temperature equal to 10kK, this comparison is shown in figure 4 and highlights a good agreement for wavelengths between 100nm and 1000nm (0.2998 1015Hz < ν < 2.998 1015Hz) whereas the results
obtained with the Biberman-Schlüter factor He
λ
ξ diverge for wavelengths inferior to 100nm. Consequently, the radiative recombination for helium (He+
↔
He) is calculated using theBiberman-Schlüter factor for λ > 100nm and according to the formula given by Okuda for wavelengths λ < 100nm. The radiative recombination for hydrogen (H+
↔
H) and ionized helium (He++↔
He+) is alsocalculated according to the hydrogen-like atoms method for all temperatures and all wavelengths. For this last method, the energy levels and principal quantum numbers of the considered species are issued from the tables of Moore [42], corrected by the recent data of the NIST [43] and completed if necessary by those of Kurucz and Peytremann [44].
100 200 300 400 500 600 700 800 900 1000 10-8 10-5 10-2 101 30000 K 22000 K 18000 K 14000 K 10000 K 6000 K Biberman-Schlüter factor ξ Η λ e
wavelength (nm)
Figure 3. Biberman-Schlüter factor for helium[40].
2 4 6 8 10 10-11 1x10⁻⁹ 1x10⁻⁷ 1x10⁻⁵ 1x10⁻³ 1x10⁻¹ 1x101 1x10³ 20kK 10kK 10kK with ξHe λ factor hydrogen-like method our calculation P = 0.1 MPa K' He rec (m -1 ) Frequency (1015 Hz)
Figure.4. Recombination radiation for pure helium plasma
- The Bremsstrahlung radiation: the expressions used to calculate the corresponding radiation are
given by Cabannes and Chapelle [45]. The elastic cross-section for electron-argon collisions are given by Tanaka and Lowke [46] versus the kinetic energy of the electron whereas Neynaber et al [47] give the cross-section for electron-hydrogen collisions. Finally, the elastic cross section characterizing the electron-helium collisions is reconstituted in figure 5 from data of Fursa and Bray [48], Golden and Bandel [49], and Kennerly and Bonham [50].
10-4 10-3 10-2 10-1 100 101 102 103 0 1 2 3 4 5 6 7
Elastic cross section (A
2 )
Energy (eV) Used values
Fursa and Bray [44] Golden and Bandel [45] Kennerly and Bonham [46]
Figure 5. Elastic cross section for electron-helium collisions.
- The molecular continuum: the presence of hydrogen H2 is also considered. In thermal plasmas, the
molecular continuum spectrum corresponds to absorption to which two mechanisms contribute, namely photo-ionization and photodissociation. The molecular continuum of molecular hydrogen is obtained by the multiplication of the molecular H2 density and the photoabsorption cross-section
issued from the works of Cook and Metzger [51] and Brolley et al [52]. We assume that the corresponding cross-section does not depend on temperature.
Examples of the continuum absorption coefficient K'ν(T) are shown as functions of frequency and temperature for pure plasmas (fig.6 and fig.7) and for the ternary mixture 53%Ar-12%H2-35%He
0 2 4 6 8 10 1x10⁻⁴ 1x10⁻³ 1x10⁻² 10-1 100 101 102 103 104 H 2 H2 Ar He He H2 Ar Ar He H2 Ar
P = 0.1MPa
Spectral absorption coefficient (m
-1
)
frequency (10
15Hz)
10kK 30kK
Figure 6. Spectral absorption coefficient for pure gases.
2 4 6 8 10 10-14 1x10-12 1x10⁻¹⁰ 1x10⁻⁸ 1x10⁻⁶ 1x10⁻⁴ 1x10⁻² 1x100 1x10² 1x10⁴ T = 5kK T = 15kK T = 20kK T = 25kK P = 0.1 MPa 5kK 25kK
Spectral absorption coefficient (m
-1 )
frequency (1015 Hz)
1
2
3
4
5
6
7
8
9
10
10
-61x10
-410
-210
010
210
4 15 kK 30 kK 30 kK 5kK 5kKP = 0.1 MPa
T = 5 kK
T = 15 kK
T = 20 kK
T = 25 kK
T = 30 kK
Spectral absorption coefficient (m
-1
)
frequency (10
15Hz)
Figure 8. Spectral absorption coefficient for 53%Ar-12%H2-35%He mixture.
5. Emission of the spectral lines
10588 lines (8708 lines for argon species, 230 lines for hydrogen and 1650 lines for helium species) have been considered, whose characteristics (energy levels, quantum numbers, transition probabilities, oscillator strengths…) are issued from the tables of Moore [42], corrected by the recent data of the NIST [43] and completed if necessary by those of Kurucz and Peytremann [44]. Radiation transfer requires the knowledge of line profiles which are calculated by taking into account the Doppler broadening, pressure effects (resonance and Van der Waals broadenings) and the Stark broadening. Griem and Traving [53-56] give a review of different classical and semiclassical methods to calculate the shape of spectral lines. To simplify the calculation of the emission line, the line overlapping is assumed to have a very low influence on the radiative transfer.
Each line is then treated individually by the use of an escape factor which depends on the line intensity and on its profile [57, 58]. The phenomenon of absorption is then taken into account through this factor Λlines, ranging between 0 and 1 and which represents the ratio between the radiative flux
occurs in the very near surroundings of the emission point as it will be pointed in the results. So self-absorption occurs in the region where the temperature is not far from that of the emitting point (low temperature gradients near the axis or the centre of the plasma) and thus the assumption of isothermal plasma is rather valid. The line radiation is written as:
λ
−
−
⋅
Λ
⋅
⋅
⋅
⋅
π
⋅
πε
=
ε
λ λT
k
hc
T
n
f
T
L
c
m
e
R
T
b line u o e o p lineexp
1
)
(
)
(
4
)
,
(
2 l l (7)where me is the mass of the electron, λ is the wavelength corresponding to the transition between the
upper energy level Eu and the lower energy level El, flu is the oscillator strength of this transition,
n
l is the average number density of the lower energy level andΛ
line is the escape factor of the line, function of the temperature and Rp.Doppler broadening: for thermal plasmas in a steady state, the emitting atoms are moving and
contribute to the broadening of the lines by thermal motion. For an emitted line centred in λo, the
Doppler Effect is due to the relative velocity of these emitting atoms compared to an observer. The line shape is a Gaussian profile and its full width at half maximum (FWHM) is given by (SI units) [59]: 2 0
2
ln
8
mc
T
k
B Dopplerλ
δλ
=
(8)where m is the mass (kg) of the emitting atom.
Pressure Effects: this type of broadening is due to the perturbation of the energy levels of an emitting
atom or ion by the presence of the other surrounding particles. These interactions cause the broadening and the shift of the lines. The interpretation of the pressure effects depends not only on the distance between the two atoms but also on the nature of the disturbers. The line shape is assimilated to a Lorentzian profile [56] and two theories are also used to calculate the FWHM: the impact approximation and the quasi-static approximation [10, 11, 54].
- Van der Waals broadening: This interaction is usually described by the C6/r6 Lennard-Jones
potential [28] where r represents the distance between the emitting atom and the disturber (identical neutral atom or different neutral atom if the higher energy level of the emitting atom is not coupled to its ground state energy level) and C6 the Van der Waals constant. The first order of the interaction
gives the Hartree-Fock mean field whereas the impact approximation is obtained in second order where collisions are described in Born approximation. The FWHM (SI units) is obtained according to the detailed investigations of Walkup et al [60]:
c
n
C
s VanDerWaalπ
λ
δλ
2
v
16
.
8
2 0 * 5 3 5 2 6⋅
⋅
⋅
⋅
=
(9)Where v= 8kBT πµ is the mean velocity of the radiating species and n
* is the population number
density of the perturbing particle. The constant C6 (m6 s-1) is calculated with the expressions given by
Hirschfelder [28] and the polarizability [61] of each particle (αAr=1.643Å-3, αH=0.666793Å-3, αHe=0.205Å-3). In Ar-H2-He mixtures, this broadening line is negligible in comparison with the
Doppler and the Stark broadenings when the particle is an atom of hydrogen H or helium HeII. A review of Van der Waals broadening is given in the impact approximation method by Traving [56].
- The resonance broadening: this phenomenon is treated within the impact approximation
method and a C3/r3 interaction potential. For an atom, this phenomenon is mainly important if the
higher energy level is coupled with its ground state. The FWHM (SI units) can be expressed in the fourth order approximation [53, 56]:
0 2 0 2 2 1 Re
2
4
48
.
5
n
c
m
f
e
g
g
o o e nm m n sonance
⋅
⋅
⋅
⋅
⋅
⋅
=
λ
π
λ
πε
π
δλ
(10)where n0 is the population number density of the atom in its ground state level.
- Stark broadening: Stark broadening is the consequence of a disturbance from the atom or
emitting ion by the electric field due to the surrounding charged particles (ions and electrons). For Ar-H2-He mixtures, the Stark broadening was not treated in an identical way for argon, hydrogen and
helium particles.
For the argon atoms, the interaction potential exists in two forms: quadripolar in r-3 [62-64]
and quadratic in r-4 [54], where r represents the distance between the atom or the emitting ion and the
disturber. The velocity of the electrons being more important than the velocity of the ions, the effect of the latter is often weaker than the influence of the former. Griem [54] added a correction term to take into account the influence of the ions in the Stark broadening lines. In the frame of the impact approximation method (for neutral atoms) and the quasi-static theory (for ions), the FWHM are written as (SI units) [54, 56, 65]:
where
v
e=
8
k
BT
π
m
e is the electron mean velocity, Zion is the charge number of the radiating ion,and C4 (m4 s-1) is a constant characteristic of the transition [56, 66]. The term in brackets is the
Griem’s correction [54] calculated with the quasi-static approach where r, r’, A and A’ are respectively the Debye shielding parameters and the ion broadening parameters given by Griem [54] and Konjevic [65].
For hydrogen atoms, the quantum weight for a given energy level and the mutual permutation of the states having the same principal quantum number but not the same orbital quantum number cause a shift of the energy levels. Hydrogen lines profile is well described by Kepple and Griem [54, 67]. The Stark broadening is mainly due to the ions, its form is linear and the resulting shape is more complex than a Lorentzian profile when the dynamics of the ions is considered. Several approaches were developed to characterize the shape of the spectral lines: the microfield method that includes the dynamics of the ions and the rotation of the ionic field in the total profile [68-70]; the generalized impact theory and the unified classical path theory which are considered as better methods to calculate the hydrogen shapes [12-16, 71]; the quantum statistical approach based on the many-particle Green functions method used by Günter [72] and developed for charged perturbers and applied to plasmas as hydrogen [72,74] or helium [74,75]. The normalized profile used in calculation is deduced from works of Vidal, Copper and Smith [12, 14-16] who considered the unified theory and the impact approximation at the centre of the line and the quasi-static approximation on the edges.
Finally, for helium atoms, Griem et al [76] indicated that the line broadening was also a linear Stark broadening. They specified that the shape of the spectral lines did not depend too much on the velocity distribution of the ions and the electrons and did not depend on the temperature when the Stark broadening dominates the other broadenings. Some references and comparisons of calculated values and measurements of Stark broadening for neutral-helium lines are available in works of Dimitrijevic and Sahal-Brechot [17] and Bassalo et al [77]. Whereas the HeII lines are supposed to be optically thin (Λlines = 1), the FWHM for the HeI lines is given by Griem (in SI units):
(
)
) ( 2 1 10 . 6 . 1 ) ( 3 6 36 T n g T u u e He Stark ⋅ ⋅ − ⋅ ⋅ ⋅ = − γ α α α δ l l (13)where ne is the electron number density (m-3), l and u are the index of the lower and upper energy
levels for a given transition, αj is the principal quantum number of the energy level, γ is a constant equal to ¼ for
α
l=
1
andα
u=
2
, and equal to unity for the other transitions. Indexesu
and l correspond respectively to the upper and lower levels of the line transition.6.1. Spectral line broadenings of neutral helium.
For pure helium plasma, figure 9 and figure 10 present the Stark broadenings obtained for 9 lines of neutral helium These lines correspond to transitions leading to the two first energy levels. Whereas Figure 9 presents the Stark broadenings at atmospheric pressure in function of temperature, Figure 10 is drawn for various pressures according to the electron number density. The characteristics of the 9 lines are reported in table 1.
Table 1. Characteristics of the HeI selected lines.
λ
(nm)α
lα
uA
ul (s -1 )E
l(cm-1)E
u(cm-1) 50.999 1 7 5.07 107 0.000 (1s2) 196079.086 (1s7p) 51.209 1 6 7.19 107 0.000 (1s2) 195274.906 (1s6p) 51.561 1 5 1.26 108 0.000 (1s2) 193942.460 (1s5p) 52.221 1 4 2.46 108 0.000 (1s2) 191492.710 (1s4p) 53.703 1 3 5.66 108 0.000 (1s2) 186209.363 (1s3p) 58.433 1 2 1.80 109 0.000 (1s2) 171131.895 (1s2p) 294.511 2 5 2.93 106 159855.972 (1s2s) 193800.766 (1s5p) 318.774 2 4 5.05 106 159855.972 (1s2s) 191217.158 (1s4p) 388.865 2 3 9.48 106 159855.972 (1s2s) 185564.581 (1s3p)Table 1 and figure 9 show that the resonance lines (
α
l = 1) are more intense and less broadened than the others so that they are the most absorbed within the plasma. For the three lines characterized by2
=
l
α
, Figure 10 shows a good agreement between our results and some experimental values issuedfrom the literature [77].
10-3 10-2 10-1 1x100 1x101 P = 0.1 MPa 52.221nm 51.561nm 51.209nm, 388.865nm 50,999nm 318.774nm 294.511nm
Figure 9. Total Stark broadenings versus temperature for the 9 HeI lines. 1020 1021 1022 1023 10-7 10-6 1x10⁻⁵ 10-4 10-3 10-2 10-1 100 101 58.433nm 53.703nm 52.221nm 51.561nm 51.209nm 50.999nm 388.865nm 318.865 nm 294.511nm Bassalo [73]
Total Stark broadening (nm)
Electron number density (m-3)
Figure 10. Total Stark broadenings versus electron number density for 9 lines of He I.
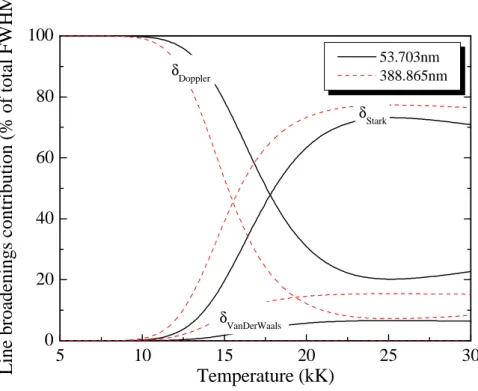
Figures 11 and 12 compare the evolution of broadenings of two HeI lines: a resonance line centred at 53,703nm (with
α
l=
1
) and a slightly absorbed line centred at 388,865nm (withα
l=
2
).5 10 15 20 25 30 10-9 10-7 1x10⁻⁵ 10-3 10-1 101 103 P = 0.1 MPa 53,703nm 388,865nm FWHM (nm) Temperature (kK) δLinear Stark δVan Der Waals δDoppler δ
Resonance
Bassalo [73]
Figure 11. Contributions of the various broadenings to the FWHM of the lines 53.703nm and 388.865nm for pure helium plasma.
5 10 15 20 25 30 0 20 40 60 80 100 53.703nm 388.865nm δVanDerWaals δStark δDoppler
Line broadenings contribution (% of total FWHM)
Temperature (kK)
Figure 12. Contribution of the line broadenings (53.703nm and 388.865nm) in total FWHM for pure helium plasma.
First, Figure 11 shows a good agreement between the values given by Bassolo [77] for the 388.865 nm line and our calculation relative to the FWHM Stark broadening. It also highlights the fact that this linear broadening does not represent the principal broadening of HeI lines at low temperature. Finally, the FHWM are higher for the 388,865 nm line. Figure 12 shows the importance of the Doppler broadening for temperature inferior to 10kK since it represents more than 99% of the FWHM. The same behaviour is observed for the 7 other HeI lines reported in table 2. Even if the FWHM of the Stark effect is smaller than the FWHM of the Doppler effect, the escape factor of a line strongly depends on the behaviour of the edges of this line. Consequently, the Lorentzian profile (Stark and pressure) can be predominant in comparison to Gaussian profile (Doppler).
Table 2. Broadening of HeI selected lines at 10kK and 20kK.
T = 10kK
T = 20kK
λ
(nm) δλHe58.433 2.09 10-3 8.35 10-8 1.72 10-7 2.96 10-3 1.00 10-4 2.06 10-4 294.511 1.05 10-2 9.82 10-5 9.18 10-4 1.49 10-2 1.18 10-1 1.10 100 318.774 1.14 10-2 4.54 10-5 3.53 10-4 1.61 10-2 5.44 10-2 4.22 10-1 388.865 1.39 10-2 1.98 10-5 9.92 10-5 1.97 10-2 2.37 10-2 1.19 10-1
For higher temperatures, Stark broadening becomes increasingly important so as to represent nearly 70% of the FWHM when temperatures are above 20kK. The remaining 30% are mainly due to Doppler broadening for resonance lines, or Doppler and Van der Waals broadenings for lines with
2
=
α
l . In opposition to ArI and H lines, Van der Waals broadening of HeI lines can play asignificant role since helium atoms are only ionized at very high temperature. Consequently, the neutral helium lines must be treated with a Voigt profile for temperatures above 10000K.
6.2. The escape factor
For pure argon plasma, Figure 13 shows the escape factors obtained for some neutral argon lines according to the thickness of the plasma (1mm and 5cm). Figure 14 presents the same results for the 10 HeI selected lines.
5 10 15 20 25 30 0,0 0,2 0,4 0,6 0,8 1,0 104.8 106.6 87.6 89.4 86.7 696.5 706.7 763.5 810.4 794.8 852.1 Escape factor Temperature (kK) P = 0.1Mpa Rp = 1mm 5 10 15 20 25 30 0,0 0,2 0,4 0,6 0,8 1,0 104.8 106.6 87.6 89.4 86.7 696.5 706.7 763.5 810.4 794.8 852.1 Escape factor Temperature (kK) P = 0.1Mpa Rp = 5cm
5 10 15 20 25 30 0,0 0,2 0,4 0,6 0,8 1,0 294.51 318.87 P = 0.1Mpa Rp = 1mm 50.999 58.433 388.865 51.561 52.221 51.209 53.703 Escape factor Temperature (kK) 5 10 15 20 25 30 0,0 0,2 0,4 0,6 0,8 1,0 52.221 53.703 58.433 318.97 294.51 388.865 50.999 51.209 51.561 P = 0.1Mpa Rp = 5cm Escape factor Temperature (kK)
s
Figure 14. Escape factor for several HeI lines versus the plasma thickness.
These results highlight how
Λ
line for a specific line depends on the temperature and the considered line. The line absorption becomes important for the first millimetre of plasma and the resonance lines are the most affected. An example is shown in Figure 13 for several neutral argon lines.For helium plasma and temperatures lower than 15kK, the most absorbed lines are characterized by
α
l=
1
as shown in figure 14. For a given temperature, we also observe thatΛ
line isweaker (and is thus strongly absorbed) when the upper energy level of the line is close to the ground state energy level (
α
l=
1
).Figure 15 presents the radiation of the HeI lines for pure helium plasma and for three plasma thicknesses (0mm, 1mm and 1cm). The total radiation of the lines having
α
l=
1
(the lower energylevel is the ground state),
α
l=
2
(the lower energy level is the first excited level), andα
l>
2
(the lower energy level is higher than the first excited level) are distinguished.10 15 20 25 30 104 105 106 107 108 109 1010 Pure helium P = 0.1MPa αl > 2 αl = 2 Lines radiation (W.m -3 .sr -1 ) Temperature (kK) αl = 1 ; Rp=0mm αl = 1 ; Rp=1mm αl = 1 ; Rp=1cm
Figure 15. Radiation of the HeI lines in the case of pure helium plasma.
It can be observed that resonance lines of HeI are strongly absorbed. The lines verifying
2
=
l
α
are very slightly absorbed. Their total radiation becomes important for high plasma thicknesses due to the strong absorption of the first lines (α
l=
1
). Indeed, the lines having the lower energy level corresponding to their ground state are characterized not only by a strong emission for thin plasma but also by a strong absorption for high plasma thicknesses. Even if the plasma thickness is often inferior to a few centimetres (thus a slight absorption), the absorption phenomena for these lines are also taken into consideration.Finally, the lines with
α
l>
2
are not absorbed. As a consequence of that, we assume that these lines are optically thin lines with an escape factorΛ
line equal to unity. It can also be observed that their total radiation is lower than the total radiation of the other lines. This effect can be explained by the important energy gap between the ground state and the first excited level of HeI (∆ε=159856cm-1). It is thus very difficult to populate the excited levels of HeI which implies a veryweak population number for these levels. According to relation 7, the contribution of theses lines (
α
l>
2
) will be assumed negligible in front of the transitions leading on the ground state or the firstexcited state.
7. Results on Net Emission Coefficients 7.1. Net Emission Coefficient of pure plasmas
Figure 16 shows the net emission coefficient of pure helium plasmas versus temperature and plasma thickness. The case Rp = 0mm is a fictitious case corresponding to an optically thin plasma. The
differences between the curve Rp = 0mm and the others show a typical trend: the strong absorption of
the radiation in the first millimetres around the emitting point. This phenomenon is due to the resonance lines that are strongly absorbed when Rp ≠ 0mm [7].
Our results are coherent with those of Moscicki [9] for optically thin plasmas. However, we denote important discrepancies for Rp=1mm at low temperature. Nevertheless, our calculations present
a good agreement when the atomic lines contribution is only considered in the total radiation. The differences are thus mainly due to the continuum radiation which presents a weak absorption for this radius value unlike the atomic lines which are strongly absorbed. We propose two reasons to explain these discrepancies corresponding to assumptions used by Moscicki: the first one is a wavelength range limited from 30nm to 2500nm (inferior to our wavelength range); and the second one concerns the helium Bremsstrahlung. Indeed, the author does not give reference about the electron-helium cross-section. Therefore, we then suppose that he has not taken into account this phenomenon. By using these assumptions in calculations, closer values are obtained: they are represented by the curve with triangles in Figure16.
5
10
15
20
25
30
10
010
210
410
610
810
10R
p= 0 mm
R
p= 1 mm
R
p= 10 mm
[8]
R
p= 1 mm (a)
Pure helium
P = 0.1MPa
ε n(W.m
-3.sr
-1)
Temperature (kK)
plasma increases. This tendency is visible in the majority of pure gases or mixtures except for noble gases and hydrogen.
5 10 15 20 25 30 100 102 104 106 108 1010 R p = 0 mm Total Continuum Lines Rp = 1 mm Total Continuum Lines P = 0.1 MPa εn (W.m -3 .sr -1 ) Temperature (kK)
Figure 17. Continuum and lines contributions to the radiation of pure helium plasma. Figure 18 compares the net emission coefficient of the three pure plasmas for Rp=1mm.
5 10 15 20 25 30 10-1 101 103 105 107 109 1011 pure Ar pure H2 pure He H2-Riad [74] Ar-Erraki [75] P = 0.1 MPa R p = 1 mm ε n (W.m -3 .sr -1 ) Temperature (kK)
Figure 18. Net emission coefficient of pure gases for Rp=1mm.
For pure argon and hydrogen plasmas, a good agreement is observed with the works of Riad [78] and Erraki [79]. Our net emission coefficient for hydrogen plasma is slightly higher for low temperatures due to the molecular continuum of hydrogen H2 that Riad had not considered in his work. Also note
that hydrogen plasmas have a particular behaviour at high temperature because ionic lines do not exist [5].
For pure helium plasma, the NEC is the weakest for temperatures inferior to 20kK. Compared to pure argon plasma, the NEC is 300 times weaker at 10000K, 52 times (weaker) at 15000K and 1,35 times at 20000K. For higher temperatures, the NEC is similar to the previous ones. This behaviour can be explained by a very high ionization potential of helium.
7.2. The Net Emission Coefficient of binary mixtures : Ar-H2 and Ar-He
The NEC of several Ar-H2 mixtures for a plasma thickness of Rp=1mm is drawn in Figure 19.
5 10 15 20 25 30 100 102 104 106 108 1010 1012 H2 Ar H2 Ar εn (W. m -3 . sr -1 ) Temperature (kK) P = 0.1 MPa R p=1mm Pure Ar 75% Ar-25% H2 50% Ar-50% H2 25% Ar-75% H2 Pure H2
Figure 19. Net emission coefficient of Ar-H2 mixtures at atmospheric pressure.
In industrial plasma processes such as plasma spraying or gas-tungsten arc welding, helium is widely used with argon. Argon is used for its high mass density whereas helium increases the enthalpy of the plasma. The presence of helium also increases the thermal conductivity of the mixture compared to the pure gases and limits the penetration of the surrounding gas. Consequently, the mixture exhibits a higher viscosity due to its high ionization energy. However, helium can create a departure from equilibrium because of the high excitation potential of its first excited levels and of its light mass which facilitates the diffusion phenomena. In Figure 20, helium only plays a role at very high temperatures (centre of plasma) and for important proportions (>70% app). This phenomenon can be explained by a higher ionization potential for helium than argon. Murphy [80] had observed this phenomenon while studying experimentally demixing of helium in an argon-helium mixture in a free
5 10 15 20 25 30 100 102 104 106 108 1010 1012 Ar He Ar εn (W. m -3 . sr -1 ) Temperature (kK) P = 0.1 MPa Rp=1mm Pure Ar 75% Ar-25% He 50% Ar-50% He 25% Ar-75% He Pure He
Figure 20. Net emission coefficient of Ar-He mixtures at atmospheric pressure. 7.3. The Net Emission Coefficient of 53%Ar-12%H2-35%He mixture
The combination of the three gases (argon, hydrogen and helium) gives plasmas whose thermal conductivity is more important than that of pure or binary mixtures for temperatures inferior to 10kK. Those mixtures present a clear interest for transferred arcs or in plasma spraying: best heat transfer and highest length of plasma jet [81]. Figure 21 presents the net emission coefficient of the 53%Ar-12%H2-35%He mixture at atmospheric pressure, for plasma thicknesses Rp=0mm and Rp=1mm. It can
be observed that:
- When the plasma is optically thin, the radiation line is more important than continuum. This
radiation is mainly due to the resonance lines of hydrogen and argon. The radiation of the hydrogen lines represents more than 70% of the net emission coefficient for temperatures lower than 10kK whereas the radiation of the argon lines represents more than 80% of the total radiation for temperatures higher than 20kK. The helium radiation is not really important for this mixture since its contribution does not exceed 3% of the total radiation (maximum at 21kK). The contribution of helium plays an important role in Ar-H2-He mixtures either for a helium proportion higher than 70% in
volume, or for small thicknesses of the plasma and high temperatures (strongly ionized plasmas).
- The increase in the plasma thickness generates an increase in the absorption phenomena and the
decrease in the lines contribution in the total radiation. The continuum then becomes fundamental for temperatures inferior to 15kK (around 95% of the total radiation at 5kK and 45% for temperatures between 15kK and 30kK). For these temperatures range (5kK<T<15kK), the argon and hydrogen lines are so strongly absorbed that they do not play the main contribution to the total radiation. Finally, for high temperatures (T>20kK), the net emission coefficient is mainly due to the argon lines radiation.
5 10 15 20 25 30 100 102 104 106 108 1010 1012 53%Ar-12%H 2-35%He P = 0.1 MPa ε n (W.m -3 .sr -1 ) Temperature (kK) Rp = 0mm Total Lines Continuum Rp = 1mm Total Lines Continuum
Fig.21: Net emission coefficient of Ar-H2-He mixtures at atmospheric pressure. 8. Conclusions
Different molar compositions have been studied to deduce generalities on the influence of the helium species in ternary mixtures Ar-H2-He. The results showed that an increase in the helium
proportion (up to 70% in molar proportion) in the mixture with fixed 5% of hydrogen led to a decrease in the net emission coefficient for all temperatures and all plasmas thicknesses. It has been showed that this was mainly due to a smaller radiation of the argon lines whose population number densities of the atoms were weakest. The influence of the hydrogen proportion in the mixture has also been evaluated. For a fixed proportion of argon (53%), an increase in hydrogen proportion (up to 40%) strongly enhanced the total radiation for temperatures inferior to 15kK. this phenomenon can be explained not only by the radiation of the H2 molecular continuum which was more important but also
by the radiation of hydrogen lines which was higher. Consequently, we highlighted the fact that the radiation of helium only played an essential role in the total radiation of the Ar-H2-He mixtures when
the plasma was optically thin and when the molar proportion of helium was very important in the mixture. For industrial applications such as plasma spraying where proportions of helium are up to 10% and plasma thickness close to the centimetre, we finally conclude that the presence of helium in Ar-H2-He mixtures does not really modify the radiative properties of these mixtures.
- Continuum radiation :
Energy levels, quantum numbers: Moore [42], NIST [43], Kurucz and Peytremann [44]
Biberman factor for argon recombination: Hofsaess [40]
Biberman factor for helium recombination: Hofsaess [40]
Cross section for the radiative attachment of hydrogen: McDaniel [35]
Cross section for the Bremsstrahlung radiation e-argon : Tanaka and Lowke [46]
Cross section for the Bremsstrahlung radiation e-hydrogen : Neynaber et al [47]
Cross section for the Bremsstrahlung radiation e-helium: Fursa and Bray [48], Golden and Bandel [49], Kennerly and Bonham [50]
Cross section for the molecular continuum of H2 : Cook and Metzger [51], Brolley et al [52]
- Lines radiation
Energy levels, quantum numbers, oscillator strength, atomic transition probability: Moore [42], NIST [43], Kurucz and Peytremann [44]
Doppler broadening : Laux [59]
Van der Waals broadening: Traving [59], Walkup et al [60]
Resonance broadening: Ali and Griem [53], Traving [56]
Stark broadening of argon lines: Griem [54], Traving [56], Konjevic and Konjevic [65]
Stark broadening of hydrogen lines: Kepple and Griem [54, 67], Vidal, Copper and Smith [12, 14-16]
Stark broadening of helium lines: Griem et al [76], Dimitrijevic and Sahal-Brechot [17],
Bassalo et al [77]
Polarisability constant : Handbook of Chemistry and Physics [61] Rerefences
[1] Fauchais P 2004 Journal of Physics D: Applied Physics 31 R86–R108
[2] Pateyron B, Elchinger M F, Delluc G and Fauchais P 1992 Plasma Chemistry and Plasma
Processing 12 4 421
[3] Aubreton J, Elchinger M F, Fauchais P, Rat V and Andre P 2004 Journal of Physics D: Applied
Physics 37 1 34
[4] Aubreton J, Elchinger M F, Rat V and Fauchais P 2004 Journal of Physics D: Applied Physics 37 16 2232
[5] Cressault Y and Gleizes A 2001 Progress in Plasmas Processing of Materials 433 (New York , Ed. Begell House, Pierre Fauchais)
[6] Soloukhin R I 1987 Handbook of radiative heat transfer in High-Temperature gases (New York, Hemisphere Publishing Corporation)
[7] Gleizes A, Gonzalez J J, Liani B and Raynal G 1993 Journal of Physics D: Applied Physics 26 11 1921
[8] Essoltani A, Proulx P, Boulos M I and Gleizes A 1994 Plasma Chemistry and Plasma Processing
14 3 301
[9] Moscicki T, Hoffman J and Szymanski Z 2008 Optica Applicata 38 2 365 [10] Griem H R, Kolb A C and Shen K Y 1959 Physical Review 116 1 4 [11] Griem H R and Shen K Y 1961 Physical Review, 122 5 1490
[12] Smith E W, Vidal C R and Cooper J 1969 Journal of Research of the National Bureau Standards 73A 405
[13] Vidal C R 1964 Zeitschrift für Naturforschung 19A 947
[14] Vidal C R, Cooper J and Smith E W 1970 Journal of Quantitative Spectroscopy and Radiative
Transfer 10 1011
[15] Vidal C R, Cooper J and Smith E W 1971 Journal of Quantitative Spectroscopy and Radiative
Transfer 11 263
[16] Vidal C R, Cooper J, and Smith E W 1973 Astrophysical Journal Supplement Series 25 214 37 [17] Dimitrijevic M S and Sahal-Bréchot S 1985 Physical Review A 31 1 316
[18] Benjamin R A, Skillman E D and Smits D P 2002 The Astrophysical Journal 569 1 288
[19] Scott C D 1970 Line broadening of the helium triplet diffuse series of helium in arc-jet plasma (Houston, Texas, National Aeronautics and Space Administration, Technical Memorandum, NASA TM X-58050, N°70-33122)
[20] Godin D and Trépanier J Y 1999 14th International Symposium on Plasma Chemistry 1 239
[21] Chase M W Jr, Davies C A, Downey J R Jr, Frurip D J, McDonald R A and Syverud A N 1985
JANAF Thermochemical Tables 3rd Edition, Journal of Physical and Chemical Reference Data 14
supplement n°1 American Chemical Society
[22] Drawin H W and Felenbok P 1965 Data for plasma in local thermodynamic equilibrium (Gauthier-Villars, Paris)
[23] Bacri J and Raffanel S 1987 Plasma Chemistry and Plasma Processing 7 1 53
[24] Herzberg G, 1950 Molecular Spectra and Molecular Structure I : Spectra of diatomic molecules. (New York, Van Nostrand Reinhold, 658p.)
[25] Drellishak K S, Aeschliman D P and Bulent Cambel A 1965 Phys. Fluids 8 1590 [26] Bacri J, Lagreca M and Medani A 1982 Physica C 113 403
[30] Modest M F 1993 Radiative heat transfer (California, London, Massachusetts, McGraw-Hill Science, Mechanical Engineering Series, Academic Press)
[31] Lowke J J and Capriotti E R 1969 Journal of Quantitative Spectroscopy and Radiative Transfer 9 2 207
[32] Lowke J J 1974 Journal of Quantitative Spectroscopy and Radiative Transfer 14 2 111
[33] Liebermann R W and Lowke J J 1976 Journal of Quantitative Spectroscopy and Radiative
Transfer 16 3 253
[34] Gleizes A, Rahmani B, Gonzalez J J and Liani B 1991 Journal of Physics D: Applied Physics 24 8 1300
[35] Mc Daniel E W 1964 Collision phenomena in ionized gases Chap.8 (John Wiley & Sons) [36] Stewart J C and Rotenberg M 1965 Physical Review 140 5A 1508
[37] Seaton M J 1958 Monthly Notices Of The Royal Astronomical Society 118 504 [38] Biberman L M and Norman G E 1960 Optics and Spectroscopy 8 230
[39] Biberman L M, Norman G E and Ulyanov K N 1961 Optics and Spectroscopy 10 5 565 [40] Hofsaess D 1978 Journal of Quantitative Spectroscopy and Radiative Transfer 19 339
[41] Okuda S, Ueda Y, Murai Y, Miyamoto T, Doi Y and Uenosono C 1980 .E. Transactions on
Plasma Science PS-8 4 395
[42] Moore C E 1949 Atomic energy levels, Vol I. (Washington, Circular of the National Bureau of Standards 467)
[43] Ralchenko Y, Kramida A E, Reader J and NIST ASD team (2008) 2009 NIST Atomic spectra
database (version 3.1.5), available online at http://physics.nist.gov/asd3, National Institute of Standards and Technology, Gaithersburg, MD
[44] Kurucz R L and Peytremann E 1995 Atomic line data (Kurucz R L and Bell B) Kurucz CD-ROM N0.23, Cambridge, Mass: Smithsonian Astrophysical Observatory, available online at http://cfa-www.harvard.edu/amp/ampdata/kurucz23/sekur.html
[45] Cabannes F and Chapelle J 1971 Spectroscopic plasma diagnostic in reactions under plasma
conditions Vol.1 Ch.7 (New-York, M. Venugopalan, John Wiley and Sons, Interscience) [46] Tanaka M and Lowke J J 2007 Journal of Physics D: Applied Physics 40 R1
[47] Neynaber R H, Marino L L, Rothe E W and Trujillo S M 1961 Physical Review 124 1 135 [48] Fursa D V and Bray I, 1995 Physical Review A 52 2 1279
[49] Golden D E and Bandel H W 1965 Physical Review 138 1A A14 [50] Kennerly R E and Bonham R A 1978 Physical Review A 17 6 1844
[51] Cook G R and Metzger P H 1964 Journal of the Optical Society of America 54 8 968
[52] Brolley J E, Porter L E, Sherman R H, Theobald J K and Fong J C 1973 Journal of Geophysical
Research 78 10 1627
[53] Ali A W and Griem H R 1965 Physical Review 140 4A 1044
[55] Griem H R 1964 Plasma spectroscopy (New York, McGraw-Hill)
[56] Traving G 1968 Interpretation of line broadening and line shift in Plasma diagnostics (North-Holland, W. Lochte-Holtgreven, 66-134)
[57] Drawin H W and Emard F 1973 Beitrag Plasmaphysik 13 143
[58] Irons F E 1979 Journal of Quantitative Spectroscopy and Radiative Transfer 22 1 01
[59] Laux C O 1993 Optical diagnostics and radiative emission of air plasmas (Ph.D Thesis, HTGL report T-288, Stanford University, California)
[60] Walkup R, Stewart B and Pritchard D E 1984 Physical Review A 29 1 169
[61] Handbook of Chemistry and Physics 1986-1987 (Boca Raton, Robert C. Weast, CRC Press, Inc., 67th Edition)
[62] Sahal-Brechot S 1969 Astronomy and Astrophysics 2 3 322
[63] Sahal-Brechot S and Van Regemorter H 1964 Annales d’astrophysique 27 432 [64] Sahal-Brechot S and Van Regemorter H 1964 Annales d’astrophysique 27 739 [65] Konjevic R and Konjevic N 1986 FIZIKA 18 327
[66] Moity J, Pieri P E and Richou J 1975 Astronomy and Astrophysics 45 2 417 [67] Kepple P and Griem H R 1968 Physical Review, 173 317
[68] Boulos M I, Fauchais P, Pfender E 1994 Thermal Plasmas, Fundamentals and applications, 1 (New York, Plenum)
[69] Demura A, Lisitsa V S, Sholin G V, Hoelscher J G A and Schram D C 1975 12th
International Conference on Phenomena in Ionized Gases I 37
[70] Baranger M 1962 Atomic and Molecular Processes, Ch.13 (New York, Bates D, Academic Press) [71] Voslamber D 1969 Zeitschrift für Naturforschung 24A 1458
[72] Günter S, Hitzschke L and Röpke G 1991 Physical Review A 44 10 6834
[73] Könies A and Günter S 1994 Journal of Quantitative Spectroscopy and Radiative Transfer 52 825
[74] Milosavljevic V and Djenize S 2001 The European Physical Journal D 15 99 [75] Omar B, Günter S, Wierling A and Röpke G 2006 Physical Review E 73 056405 [76] Griem H R, Baranger M, Kolb A C and Oertel G 1962 Physical Review 125 1 177 [77] Bassalo J M, Cattani M and Walder V S 1980 Physical Review A 22 3 1194
[78] Riad H 1986 Calcul du transfert radiatif dans des arcs et des plasmas thermiques : Application à
![Figure 3. Biberman-Schlüter factor for helium[40].](https://thumb-eu.123doks.com/thumbv2/123doknet/13112981.386879/9.892.205.691.109.817/figure-biberman-schlüter-factor-for-helium.webp)


![Figure 9. Total Stark broadenings versus temperature for the 9 HeI lines. 10 20 10 21 10 22 10 2310-710-61x10-510-410-310-210-110010158.433nm53.703nm52.221nm51.561nm51.209nm50.999nm388.865nm318.865 nm294.511nm Bassalo [73]](https://thumb-eu.123doks.com/thumbv2/123doknet/13112981.386879/17.892.251.650.168.481/figure-total-stark-broadenings-versus-temperature-lines-bassalo.webp)