Towards an Automatic Extraction
of Smartphone Users’ Contextual Behaviors
Ali Jaffal
Université Paris 1 Panthéon-Sorbonne Centre de Recherche en Informatique
90, rue de Tolbiac, Paris, France [email protected]
Bénédicte Le Grand
Université Paris 1 Panthéon-SorbonneCentre de Recherche en Informatique 90, rue de Tolbiac, Paris, France [email protected]
Abstract — This paper presents a new method for automatically extracting smartphone users’ contextual behaviors from the digital traces collected during their interactions with their devices. Our goal is in particular to understand the impact of users’ context (e.g., location, time, environment, etc.) on the applications they run on their smartphones. We propose a methodology to analyze digital traces and to automatically identify the significant information that characterizes users’ behaviors. In earlier work, we have used Formal Concept Analysis and Galois lattices to extract relevant knowledge from heterogeneous and complex contextual data; however, the interpretation of the obtained Galois lattices was performed manually. In this article, we aim at automating this interpretation process, through the provision of original metrics. Therefore our methodology returns relevant information without requiring any expertise in data analysis. We illustrate our contribution on real data collected from volunteer users.
Keywords—user behavior extraction; automatic interpretation; context analysis; smartphone traces analysis; Formal Concept Analysis; Galois lattices
I. INTRODUCTION
Pervasive Information Systems extend traditional Information Systems by taking into account users’ environment and mobility. This mobility has become possible through the expansion of lightweight devices such as smartphones [1]. Understanding the influence of context and environment on the way people use their mobile devices represents a challenge [2]. The ArtDeco project [3] is dedicated to the extraction of knowledge –and its representation- from heterogeneous information collected from applications and sensors in companies. In another context, the U-CAT project [4] aims at developing a system for educational activities that rely on various mobile devices.
In earlier work [5], we have used Formal Concept Analysis (FCA) and Galois lattices – introduced in Section II - to study the impact of smartphone users’ context and environment on the applications they execute on their mobile devices. We have obtained promising results, however we have performed the interpretation of the obtained Galois lattices manually. Our goal is now to automate this interpretation task, so that our approach can be useful for people who are not experts in
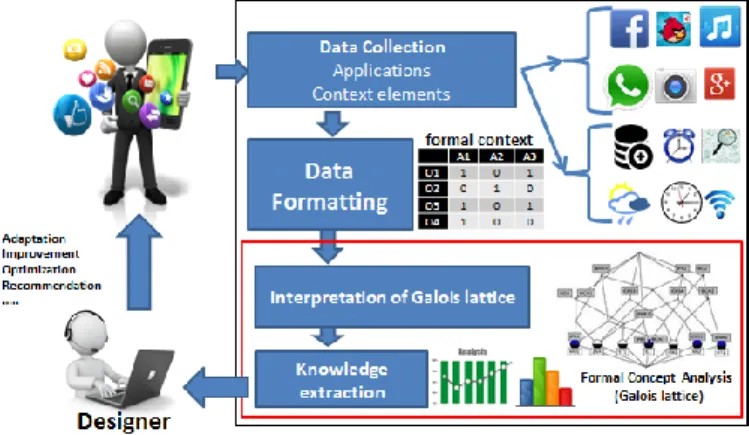
Formal Concept Analysis, or in data analysis in general. An overview of our methodology for an automated extraction of smartphone users’ contextual behaviors from digital traces is represented on Figure 1. The various steps of this process are explained in Section II.
Fig. 1. Overview of the proposed contextual behavior extraction process In this paper, we illustrate our methodology and the underlying analysis techniques on a sample of real data, collected from a group of master students of our university. Those students agreed to fill in questionnaires where they reported, during one week, the applications they have used on their smartphones, as well as the associated contexts (e.g., geographical location, time, type of connection network, etc.).
Note that although we illustrate our theoretical contribution in the area of pervasive information systems, it can be applied to other application domains (see Section IV).
II. BACKGROUND AND RELATED WORK
Formal Concept Analysis (FCA) is at the intersection between mathematics and data analysis [6]. The input of a FCA algorithm is a set of data elements – called objects- characterized by (Boolean) features –called attributes. The binary relation between objects and attributes is represented in a table called formal context. In our case study, the objects are the applications executed on the smartphone and the attributes corresponds to user context. Each piece of information related to context is called context element in the following.
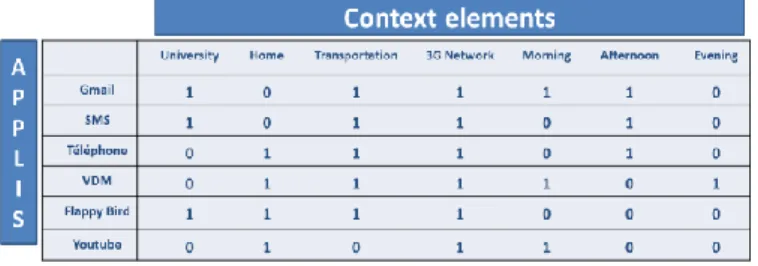
Figure 2 is an example formal context, which has been derived from the questionnaire of one of our students. In this formal context, the applications executed by this student are listed in the rows of the table and the various contextual elements associated to the applications appear in the columns. Note that the list of applications and context elements may vary as they are specified by users themselves. This specific student has used the following applications: Gmail, SMS, telephone,
VDM (web site where people tell their unlucky daily stories), Flappy bird (game), and Youtube. In this case, we may
consider that these applications belong to two broad categories: communication and leisure. The various context elements identified by this user are related to her location (university,
home and public transportation), but also to the type of
network connection (3G) and the moment of the day (morning,
afternoon, evening). For example, the second row in the formal
context of Figure 2 shows that this specific student has used the
SMS application at the university, in the public transportation,
from a 3G network and in the afternoon.
Fig. 2. Example formal context extracted from one specfic questionnaire From each formal context given as an input, FCA groups objects into clusters –called formal concepts- according to their common attributes [7]. In the case study presented here, applications are thus clustered according to the context elements they have in common. One strength of FCA over most other clustering approaches is that the resulting clusters are overlapping (i.e., objects and attributes may appear simultaneously in several clusters). Moreover, the semantics of each cluster (formal concept) is explicit: the existence of each formal concept is justified by the common attributes that characterize the clustered objects.
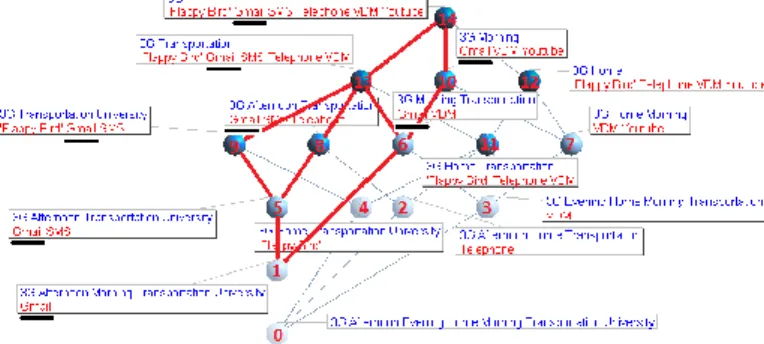
The result of the FCA process is a Galois lattice that represents the partial order relation between formal concepts. Figure 3 represents the Galois lattice generated from the formal context of Figure 2.
Fig. 3. Example Galois lattice extracted from the Formal context of Fig. 2
The manual interpretation of this lattice leads to useful information about the smartphone usage of the associated student and about the impact of contextual elements on the applications she has executed on her mobile device. Each concept (cluster) of the lattice groups applications according to the context elements they have in common. For example, the concept number 9 in the lattice represented on Figure 3 contains 3 applications: Flappy Bird, Gmail and SMS, that have all been used from a 3G network, in the public transportation and at the university. The concepts that are close to the top of the lattice are the most generic concepts, i.e., the concepts that contain many applications but have few context elements in common. Those applications therefore have a low conceptual
usage similarity (we provide a formal definition of this notion
in Section III).
On the other hand, the concepts that are close to the bottom of the lattice are specific, i.e., they contain few applications that share many context elements, and they are thus very similar, in terms of conceptual usage similarity. Let us give a few examples of possible interpretations of this lattice: the concept number 14 –the upper bound of the lattice- contains the 3G context element that is common to all applications: this context element can therefore be considered as “universal” for this specific user. Similarly, the Gmail application is almost universal as it appears in a concept (number 1) that is very close to the lower bound of the lattice.
In addition to the interpretation of the bounds of the lattice, we may identify some applications that frequently appear simultaneously in the formal concepts of the lattice, i.e., that are conceptually similar: this is the case for Gmail and SMS, that appear together in five concepts (one third of the total number of concepts in the lattice). This observation may seem obvious, as both applications are dedicated to communication. However, we also learn that these applications are usually associated to afternoon, public transportation and university. Similarly, some applications belonging to the leisure category appear in the same concepts, and are used in conjunction with other context elements: for example, VDM and Youtube appear together in concept number 7, associated to home and morning. We can also focus on context elements and identify some conceptually similar context elements, such as transportation,
afternoon and 3G, which are associated to a high proportion of
common applications: Gmail, telephone and SMS. Such conclusions may be very valuable for a mobile phone service provider, who can thus better understand customers’ preferences and habits. However two limitations need to be overcome: first, this interpretation should be automated in order to select the most significant conclusions. Moreover, it is important to know which observations made at the individual scale can be generalized. Therefore, the results obtained from the analysis of individual lattices should be compared and summarized in order to distinguish frequent behaviors from more typical ones.
The goal of the work presented in this paper is to design and implement metrics in order to perform an automatic interpretation of individual lattices (to understand individual users’ behaviors), as well as comparisons of several lattices (to compare the behaviors of several users). Other methods are
dedicated to lattice reduction, in order to make their visualization easier. Our work is orthogonal to the initiatives, as we focus on a systematic and relevant interpretation of the lattice, whatever its size.
In the following Section, we propose several metrics designed to automate the interpretation and comparison of Galois lattices. Several metrics such as stability and support [8], [9], [10] have been proposed to analyze Galois lattices, but their goal is to reduce them by keeping only the most relevant concepts [11]. However, even reduced lattices may remain too large to be interpreted manually. Moreover, such analyses still require expertise in Formal Concept Analysis. Our contribution is thus complementary to these approaches, as it aims at providing intuitive interpretation of lattices, for non-expert users. The authors of [12] have proposed some « conceptual » metrics that they have applied to the characterization of social network members. However, those metrics focus on the characterization of objects and attributes without analyzing the impact they may have on one another.
III. METRICS FOR THE AUTOMATIC INTERPRETATION OF GALOIS LATTICES
In order to go beyond existing metrics for the interpretation of Galois lattices, we propose three metrics that we detail in the following.
A. Conceptual weight
The first metric, called conceptual weight, represents the frequency of a given object (resp. attribute) in the lattice: it corresponds to the proportion of concepts in the lattice that contain this object (resp. attribute).
Given an application Ai:
Similarly, given a context element Ej:
Figure 4 illustrates the computation of this conceptual weight, for the Gmail application from the lattice of Figure 3. This application appears in 8 concepts of the lattice, out of 15 concepts in total: its conceptual weight is therefore equal to 0.53, as reported in Figure 5, with the weights of all other applications.
Fig. 4. Example of conceptual weight computation for Gmail application
This « conceptual » weight is based on the clustering performed by Formal Concept Analysis, and returns different results from the frequency that can be computed from the formal context given as an input to FCA. For example, the frequency of the Gmail application in the formal context of Figure 2 is equal to 0.71 (as this application is associated to 5 context elements out of 7 in total).
Fig. 5. Conceptual weights of the applications from the lattice of Figure 3 The values of conceptual weight help understand the relative importance of applications with regard to context elements, for a specific user (i.e., lattice). This metric identifies the applications that frequently appear in the lattice, and that are therefore associated to common context elements.
If we consider the conceptual weight of morning and
afternoon context elements, illustrated in Figure 6, we may
notice that although their frequency in the input formal context of Figure 2 is identical (=0.5), their conceptual weights are different: indeed, morning is associated to a greater number of application clusters than afternoon.
Fig. 6. Conceptual weights of the context elements from the lattice of Fig. 3 One limitation of the conceptual weight is that it focuses on a single application (or context element). In the following Section, we propose the conceptual usage similarity metric that compares two applications or context elements.
B. Conceptual usage similarity
We define the conceptual usage similarity between two context elements Ei and Ej as follows:
Similarly, we define the conceptual usage similarity between two applications Ai and Aj as follows:
This conceptual usage similarity metric allows comparing two specific context elements, or two specific applications, which was not possible with the conceptual weight described in the previous Section.
Figure 7 represents the conceptual usage similarity between all context elements of the lattice of Figure 3. We have chosen
to represent the full matrix, although it is symmetric, for readability purposes.
Fig. 7. Conceptual usage similarity between all context elements of the lattice of Figure 3
A high value of the conceptual usage similarity metric between two context elements Ei and Ej, i.e., close to 100%, indicates that most applications associated with the context element Ei are also associated to the context element Ej. For example, public transportation and 3G network have a conceptual usage similarity equal to 73%, while public
transportation and afternoon have a 45% conceptual usage
similarity.
If we consider the temporal context elements, we notice that morning and afternoon are more strongly related to the 3G
network than evening is, which is understandable as other types
of network access are available in the evening (probably from
home). Another observation is that morning is more similar to evening than it is from afternoon, in terms of application usage.
Figure 8 displays the values of conceptual usage similarity between 3G and evening for all students who answered our questionnaires. These values have been computed from 305 lattices. This diagram shows that the usage similarity between both context elements is rather low in most lattices, despite a few exceptions, which confirms the observation that was made at an individual scale (in Figure 7).
Fig. 8. Comparison of the values of the conceptual usage similarity between
3G and transportation context elements for all students
Other observations are possible if we compare the overall values of conceptual usage similarity between other context elements. For example, Figure 9 and Figure 10 show that
university is in average more similar to afternoon than to morning.
Fig. 9. Comparison of the values of the conceptual usage similarity between
university and afternoon context elements for all students
Fig. 10. Comparison of the values of the conceptual usage similarity between
university and morning context elements for all students
After studying context elements, we now focus on applications. Figure 11 represents the conceptual usage similarity between all applications of the lattice of Figure 3. Some applications appear expectably similar (e.g., Gmail and
SMS, with a similarity above 63%, or Youtube and VDM with
almost 50%), but it is important to understand that the conceptual usage similarity reflects where applications are used in similar contexts; therefore two very different types of applications may be conceptually similar in terms of usage: this is the case for Flappy bird and telephone, which have a high conceptual usage similarity, although they are dedicated to leisure and communication respectively. We can also notice that, in terms of conceptual usage, Flappy bird is more similar to telephone than to Youtube for this user, which could seem surprising.
Fig. 11. Conceptual usage similarity between all applications of Figure 3 Figure 12 represents the values of conceptual usage similarity between the Gmail and SMS applications over the 305 lattices. This Figure confirms the (expected) overall high value of conceptual usage similarity between both applications.
Fig. 12. Comparison of the values of the conceptual usage similarity between
Gmail and SMS applications for all students
In addition, Figure 13 shows that the conceptual usage similarity between Gmail and telephone is globally significantly lower than the similarity between Gmail and SMS.
Fig. 13. Comparison of the values of the conceptual usage similarity between
Gmail and telephone applications for all students
Figure 14 provides another example of conclusion, related to two different types of applications: telephone and Flappy
bird game. For many users, both applications have nothing in
similarity is surprisingly high; this means that they use both applications in the same conditions, despite their very different natures.
Fig. 14. Comparison of the values of the conceptual usage similarity between
Flappy bird and telephone applications for all students
The conceptual usage similarity metric presented in this Section considers applications and context elements separately. In the following, we propose a metric that reflects the mutual impact of applications and the associated context elements.
C. Mutual impact
In a pervasive environment, context elements have an influence on application usage, and, reciprocally, applications are executed in specific contexts; we consider here that the applications users choose to execute on their smartphones reflect their behaviors. We first define the absolute mutual
impact between an application Ai and a context element Ej as
the proportion of concepts that contain both Ai and Ej.
We also define the relative mutual impact between an application Ai and a context element Ej:
The absolute version of mutual impact is useful to compare values of mutual impact in lattices which sizes may be very different. When considering a single lattice, relative mutual impact is more relevant.
Figure 15 represents the relative mutual impact between the applications and context elements of the lattice of Figure 3. This Figure may be interpreted as follows: we may first notice that the values of mutual impact vary significantly according to context elements and applications. For example, evening is only associated to the VDM application, and afternoon only to
Gmail, SMS and telephone. On the other hand, home is not
associated to Gmail or SMS. If we consider the university location, we find out that its maximum relative impact is obtained with Gmail (almost 30%), and that this impact is null with VDM or Youtube. The observations above relate to a specific user.
Fig. 15. Relative mutual impact computed from the lattice of Figure 3 It is possible to compare the mutual impact between
university and Gmail among all students. This value has been
computed from 305 lattices, and Figure 16 displays the obtained results.
Fig. 16. Relative mutual impact between Gmail and university for all students Figure 16 shows that the value of 30% for the individual student of Figure 3 is higher than the average impact between
Gmail and university. The behavior of this student with regard
to the relative usage of Gmail at the university is therefore not frequently observed at the scale of the global population. The individual observation may thus not be generalized.
Additional conclusions may be drawn if we compare the overall values of relative mutual impact for other combinations of applications and context elements. Figure 17 shows that although Gmail and evening had no mutual impact for the individual user of Figure 2, this is not the case for all users; some users even have rather high values of mutual impact between Gmail and evening.
Fig. 17. Relative mutual impact between Gmail and evening for all students On the other hand, Figure 18 confirms the extremely low impact between Youtube and university at the global scale – which is reassuring for the teachers!
Fig. 18. Relative mutual impact between Youtube and university for all students
Note that the results of the conceptual mutual impact can be presented in a dual way, as shown on Figure 19. Although the content is equivalent as both diagrams have been built from the same input data, the “client” of our analysis (e.g., a mobile service provider) may choose between both representations, which provide different observation angles. For example, we may see on Figure 19 that the values of mutual impact for
Youtube –when they are not null- are rather homogeneous for
all context elements (home, 3G network and morning). The same observation can be made for the SMS application.
IV. CONCLUSION AND PERSPECTIVES
In this paper, we have proposed original metrics derived from Formal Concept Analysis, in order to automate the interpretation of Galois lattices. This interpretation methodology can be applied to any application domain: the only input required is one –or several- Galois lattices.
We have applied our proposal to the area of pervasive information systems. In our case study, each Galois lattice – associated to a specific smartphone user- clusters the applications that have been executed on the device according to the context in which they have been used. We have applied our conceptual metrics to real data collected from a sample of students. We have shown examples of automatic interpretations made possible by our metrics, which help understand the behavior of smartphone users, in terms of contextual usage of applications.
The results of smartphone users’ contextual behavior can be valuable for mobile service providers. Indeed, from a service provider point of view, such conclusions can help recommend applications under specific contexts; new applications may also be developed for particular contextual situations, taking into account the mutual impact between applications and context elements, as well as usage similarity among applications and among context elements.
Each Galois lattice generated from the input data represents the behavior of a single smartphone user; we have also shown how our metrics, designed for the analysis of individual lattices, can also be used to compare several lattices –and therefore several users. This comparison may be used to classify users according to their contextual behavior, and can also help detect general trends. For the moment, the most significant combinations of applications and/or context elements (out of all possible pairs) have been chosen manually. We will also automate this pair selection process.
We have two main perspectives for the future, which will be addressed in parallel. On the one hand, we will design and implement additional metrics in order to go further in the interpretation of Galois lattices. We have focused so far on the analysis of concepts, objects and attributes; we will design metrics in order to exploit the links within the lattices, i.e., the generalization and specialization relationships between formal concepts. Indeed, the semantics of these relations can be very rich and should be taken into account during the interpretation process. We will also validate our results by collecting the feedback of users on the proposed interpretation.
On the other hand, we will apply our metrics to Galois lattices generated from other types of data. In the short term, we will apply them to e-learning data, where objects are pupils and attributes are related to evaluation criteria, such as scores,
time required to answer a question, number of attempts before succeeding, etc. In the longer term, we will consider their application to the area of social networks, in order to propose an on original technique for social network analysis, in addition to traditional ones.
V. REFERENCES
[1] Kourouthanassis, Panos E., et George M. Giaglis. 2006. « A Design Theory for Pervasive Information Systems. » In in Proc. 3rd Int. Workshop on Ubiquitous Computing (IWUC’06), 62‑70. http://www.dmst.aueb.gr/Documents/PhD/Phd_thesis/Kourouthanasis.p df.
[2] Fernandes, José Eduardo, Ricardo J Machado, et João Álvaro Carvalho. 2008. « Model-Driven Development for Pervasive Information Systems ». In: Mostefaoui, S.K., Maamar, Z., Giaglis, G.M. (eds.) Advances in Ubiquitous Computing: Future Paradigms and Directions, 45‑82. [3] Anastasi, Giuseppe, Emilio Bellini, Elisabetta Di Nitto, Carlo Ghezzi,
Letizia Tanca, et Eugenio Zimeo, éd. 2012. Methodologies and Technologies for Networked Enterprises. Vol. 7200. Lecture Notes in Computer Science. Berlin, Heidelberg: Springer Berlin Heidelberg. http://link.springer.com/10.1007/978-3-642-31739-2.
[4] López-Cózar, Ramón, Zoraida Callejas, Miguel Gea, et Germán Montoro. 2005. « Proc.s of the Int. Workshop ISCA Tutorial and Research Workshop on ASIDE ». In COST278 Final Workshop and ITRW on Applied Spoken Language Interaction in Distributed
Environments.
http://www.isca-speech.org/archive_open/aside_2005/aside_12.html.
[5] Jaffal, Ali, Manuele Kirsch-Pinheiro, et Bénédicte Le-Grand. 2014. « Unified and Conceptual Context Analysis in Ubiquitous Environments ». 8th International Conference on Mobile Ubiquitous Computing, Systems, Services and Technologies, 48‑55.
[6] Priss, Ulta. 2006. « Formal Concept Analysis in Information Science ». In: Blaise, C. (ed.) Annual Review of Information Science and Technology, ASIST 40.
[7] Wille, Rudolf. 2005. « Formal Concept Analysis as Mathematical Theory of Concepts and Concept Hierarchies ». Formal Concept Analysis, B.Ganter et al., eds., 1‑33.
[8] Jay, Nicolas, François Kohler, et Amedeo Napoli. 2008. « Analysis of social communities with iceberg and stability-based concept lattices ». In 6th International Conference on Formal Concept Analysis - ICFCA 2008, édité par Raoul Medina et Sergei Obiedkov, 4933:258‑72. Lecture Notes in Artificial Intelligence. Montréal, Canada: Springer. https://hal.archives-ouvertes.fr/hal-00608180.
[9] Klimushkin, Mikhail, Sergei Obiedkov, et Camille Roth. 2010. « Approaches to the selection of relevant concepts in the case of noisy data ». In Formal concept analysis, 255‑66. Springer. http://link.springer.com/chapter/10.1007/978-3-642-11928-6_18. [10] Kuznetsov, Sergei, Sergei Obiedkov, et Camille Roth. 2007. « Reducing
the Representation Complexity of Lattice-Based Taxonomies ». In Conceptual Structures: Knowledge Architectures for Smart Applications, édité par Uta Priss, Simon Polovina, et Richard Hill, 241‑54. Lecture Notes in Computer Science 4604. Springer Berlin Heidelberg. http://link.springer.com/chapter/10.1007/978-3-540-73681-3_18.
[11] Ventos, Véronique, et Henry Soldano. 2005. « Alpha galois lattices: An overview ». In B. Ganter (Ed.), et al., ICFCA, LNAI, 299–314. [12] Le Grand, Bénédicte, Marie-Aude Aufaure, et Michel Soto. 2009. «
Empreintes conceptuelles et spatiales pour la caractérisation des réseaux sociaux. » In EGC, 349‑54.