HAL Id: hal-03226915
https://hal.archives-ouvertes.fr/hal-03226915
Submitted on 16 May 2021
HAL is a multi-disciplinary open access
archive for the deposit and dissemination of
sci-entific research documents, whether they are
pub-lished or not. The documents may come from
teaching and research institutions in France or
abroad, or from public or private research centers.
L’archive ouverte pluridisciplinaire HAL, est
destinée au dépôt et à la diffusion de documents
scientifiques de niveau recherche, publiés ou non,
émanant des établissements d’enseignement et de
recherche français ou étrangers, des laboratoires
publics ou privés.
Skillful prediction of multidecadal variations in volcanic
forcing
A. Tuel, P. Naveau, C. Ammann
To cite this version:
A. Tuel, P. Naveau, C. Ammann. Skillful prediction of multidecadal variations in volcanic
forc-ing.
Geophysical Research Letters, American Geophysical Union, 2017, 44 (6), pp.2868-2874.
Skillful prediction of multidecadal variations
in volcanic forcing
A. Tuel1,2 , P. Naveau1,3, and C. M. Ammann1
1National Center for Atmospheric Research, Boulder, Colorado, USA,2Ralph M. Parsons Laboratory, Massachusetts
Institute of Technology, Cambridge, Massachusetts, USA,3Institut Pierre Simon Laplace/Laboratoire des Sciences du
Climat et de l’Environnement, CEA-CNRS-UVSQ, Orme des Merisiers, Gif-sur-Yvette, France
Abstract
Stratospheric sulfate injections from explosive volcanic eruptions are a primary natural climate forcing. Improved statistical models can now capture and simulate dynamical relationships in temporal variations of binary data. Leveraging these new techniques, the presented analysis clearly indicates that the number of large eruptions in the most recent records of explosive volcanism cannot be considered to be fully random. Including dynamical dependence in our models improves their ability to reproduce the historical record and thus forms a strong basis for skill in statistical prediction. Possible geophysical mechanisms behind the identified multidecadal variations are discussed, including variations in the observed length of day.1. Introduction
Explosive volcanism is known as a major driver of repeated short-term cooling immediately following indi-vidual events over the past centuries and millennia [Briffa et al., 1998]. Sequences of eruptions have also been suspected to be a likely cause of the multidecadal to centennial cooling pulses of the Little Ice Age [Hegerl
et al., 2003] and, indirectly, through their absence, the possible warm episodes, such as during the medieval
climate anomaly [Jones and Mann, 2004]. Alternative views postulate a predominant internal variability in the climate system punctuated by episodic volcanic perturbations. Despite the demonstrated contribution to natural variability, no volcanic forcing has been seriously considered to be included for the extensive assess-ments of possible and likely future climate because of their apparent random nature. Thus, volcanic forcing remains a major unknown in climate projections [Stoffel et al., 2015].
It is well understood how large explosive eruptions can release considerable amounts of sulfur (and other material) into the lower stratosphere, where conversion to long-lived small sulfate particles occurs [McCormick
et al., 1995]. The resulting vails, particularly when forming in the tropics, lead to perturbations of the Earth’s
radiative balance and general surface cooling for a few years or more [Robock, 2000]. The occurrence of such events is often regarded in the geophysics community as a purely random, time-independent process [Love, 2012]. Depending on the timescale under study, a body of work has recently emerged to challenge this hypothesis. For example, Mason et al. [2004] suggested an effect of seasonality on eruption occurrence, while
Watt et al. [2009] found a statistically significant increase in eruption rate after major earthquakes. At decadal
to centennial timescales, clusters of eruptions have been recognized in different archives [Robock, 2000]. Looking at tropical events in these records, and focusing on the binary nature of the series, Ammann and
Naveau [2003] identified a strong 76 year cycle. Still, this analysis, primarily based on polar sulfate deposits,
covered a relatively short period (1400–1998). Since then, new advances have been made in the recovery and analysis of polar sulfate [Sigl et al., 2015], and also in the statistical modeling of binary series using the frame-work of multivariate Bernoulli distributions [Dai et al., 2013]. We propose in this study the use of a more robust statistical model to analyze the dynamical properties of explosive volcanic event occurrence.
2. Data
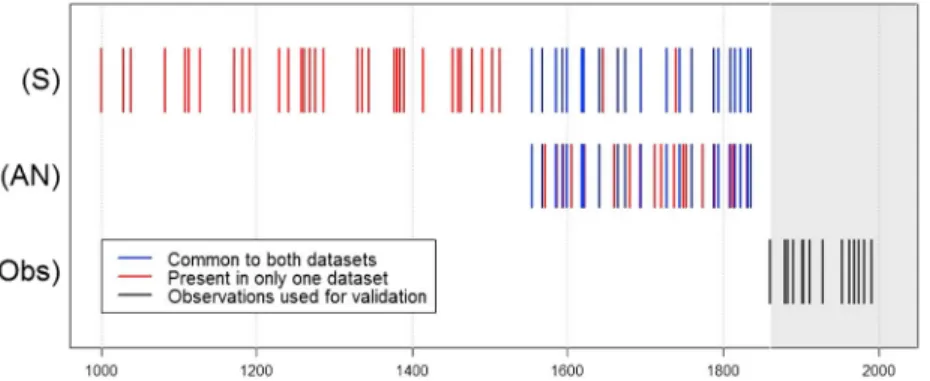
The most reliable information about past volcanism can be gained from high-resolution polar ice cores [Hammer et al., 1980; Zielinski, 2000]. Combining their well-dated sulfate records into composites offers the establishment of an ice core volcanic index (IVI) [Robock and Free, 1995; Ammann and Naveau, 2003; Sigl et al., 2013, 2015]. We rely in this study on two different binary IVI records (eruption years coded by 1, see Figure 1).
RESEARCH LETTER
10.1002/2016GL072234Key Points:
• Large explosive eruptions influencing the climate appear not to occur randomly over time
• Potential driving geophysical mechanisms are discussed, notably length-of-day variations • First building block to stochastically
simulate volcanic forcing series that could be included in future climate predictions Supporting Information: • Supporting Information S1 • Figure S1 • Figure S2 • Figure S3 • Figure S4 • Table S1 • Text S1 Correspondence to: A. Tuel, [email protected] Citation:
Tuel, A., P. Naveau, and C. M. Ammann (2017), Skillful prediction of multidecadal variations in volcanic forcing, Geophys.
Res. Lett., 44, 2868–2874,
doi:10.1002/2016GL072234.
Received 6 DEC 2016 Accepted 8 MAR 2017
Accepted article online 15 MAR 2017 Published online 25 MAR 2017
©2017. American Geophysical Union. All Rights Reserved.
This article has been contributed to by US Government employees and their work is in the public domain in the USA.
Geophysical Research Letters
10.1002/2016GL072234
Figure 1. Tropical extreme eruption occurrences used in this study: (S): Sigl extracted IVI record, 1000–1859; (AN): Ammann and Naveau IVI record, 1550–1859; (Obs): Observed record, 1860–2010 (gray-shaded background). A complete list of eruptions in the observed record is given in Table S3. Events shown in blue are common to both data sets (note that we assume that two events separated by at most 1 year correspond to the same one), while events shown in red are present in a single data set only. Black lines correspond to observations over the period 1860–2010 A.D.
The first, from Ammann and Naveau [2003], which we write henceforward AN, was obtained from ice core sulfate series corroborated by other independent data sources. We use the period 1550–2010 with minimal potential for event dropoff. The second series is the most recent high-resolution, multicore sulfate compila-tion by Sigl et al. [2015]. It goes back 2500 years, but we choose to focus on the years 1000 to 2010 A.D. for two reasons. First, prior to 1000 A.D., the average eruption rate, as computed from our extracted binary record, decreases. This could be an artifact due to data quality issues as one goes back in the past. Still, from 1000 to 2010 A.D., the long-term eruption rate stays about constant (0.065 eruption per decade). Second, the error made when dating ice layers goes up with the age of that layer. Increasing the number of missing or badly resolved layers creates shifts in the data that impact our analysis. For example, when eruptions are randomly and artificially shifted by at most 2 years, underlying variabilities become difficult to detect with a precision at the decadal scale (see also section 4).
Among all eruptions, we focus on those that left a significant sulfate signal at both poles. Such eruptions very likely occurred in the tropics and had therefore a stronger impact on global climate than mid- to high-latitude events. To define a binary event in our eruption records, we need to set a threshold on the signal left by an eruption in polar sulfate records. This is achieved by using the last 150 years of ice core data, during which we know precisely the eruptions that occurred and that impacted global climate. Based on this threshold, we use a signal extraction technique [Gazeaux et al., 2013] (see Methods S1 in supporting information S1) to increase the recognized number of eruptions from 36 to 65 for the period since the year 1000 and from 83 to 154 for the period since 400 B.C. The reconstructed record contains all detectable eruptions of magnitude—as inferred from their sulfate signals—equal to or higher than that of the observation set.
In the following, we restrict the statistical fit of models to data before 1859 A.D. (training set). The subsequent years from 1860 to 2010 (see Figure 1), corresponding to the period with the best direct observations, are used to assess our models’ predictive skills.
3. Methods
Recent statistical advances [Dai et al., 2013] provide an integrated framework that accurately captures scale dependencies when modeling binary data, called the general logistic model. It describes, in any setup, the full joint probability p(y1∶t) of a multivariate binary vector y1∶t= (y1, y2, … , yt) over t years. In its simplest form,
the univariate logistic model consists in defining𝜆(t)=log( pt
1−pt
)
where ptcorresponds to the probability of observing an eruption during year t. The unknown𝜆(t) can be modeled in multiple ways, with the most sim-ple form being called a logistic regression driven by temporal covariates. For examsim-ple, Ammann and Naveau [2003] chose to define𝜆(t) as a function of two trigonometric functions. While this allowed them to cap-ture slow decadal variations, any possible short-term correlations were missing. In an effort to investigate the presence of such correlations and to improve the model’s prediction skills, we expand on this basic model and build in an autologistic regression [Hughes et al., 2011] that allows for ptto be directly dependent on the
Figure 2. (top row) AIC values obtained by fitting an autologistic model to (left) the Ammann and Naveau IVI and (right) the Sigl extracted IVI, as a function of the dependence ordernand (bottom row) the two cyclesT1,T2imposed on the
𝜆(t). For Figure 2 (top row), the selected cycles areT1= 73.6,T2= 24.4years for the AN IVI andT1= 70,T2= 18.9years for the Sigl reconstructed IVI. The dotted black line shows the best AIC possible under logistic regression for the corresponding data set. For Figure 2 (bottom row), the selected dependence orders are 13 for the AN IVI and 5 for the Sigl reconstructed IVI. One main cycle around 70–75 years clearly emerges, while smaller periods seem to be also present, around 19 and 24 years.
we use only one parameter,𝛼, to capture the autoregressive term (𝛼 = 0 means no short-term dependence). More precisely, we study the model
𝜆(t, ̃𝜃, y(t−n)∶(t−1)) =𝜃0+ 2 ∑ i=1 { 𝜃i,1cos ( 2𝜋t Ti ) +𝜃i,2sin ( 2𝜋t Ti )} ⏟⏞⏞⏞⏞⏞⏞⏞⏞⏞⏞⏞⏞⏞⏞⏞⏞⏞⏞⏞⏞⏞⏞⏞⏞⏞⏞⏞⏞⏞⏞⏟⏞⏞⏞⏞⏞⏞⏞⏞⏞⏞⏞⏞⏞⏞⏞⏞⏞⏞⏞⏞⏞⏞⏞⏞⏞⏞⏞⏞⏞⏞⏟ Decadal variation +𝛼 ×(yt−1+ · · · + yt−n) ⏟⏞⏞⏞⏞⏞⏞⏞⏞⏞⏞⏞⏞⏞⏟⏞⏞⏞⏞⏞⏞⏞⏞⏞⏞⏞⏞⏞⏟ Short-term memory , (1)
where the vector of unknown parameters ̃𝜃 = (𝜃0, 𝜃1,1, … , 𝜃2,2, 𝛼) is found by maximum likelihood
estima-tion for different fixed cycle lengths values T1and T2(logistic part of the model) and of interaction order n
(dynamical part), as outlined in Methods S2 in supporting information S1.
4. Results
Fitting model (1) to the two IVI series, the optimal values of Tifor the autologistic model (𝛼 ≠ 0) are determined
with the Akaike information criterion (AIC) (as in AN), a classical tool of model selection. For a given parametric model M, with parameters p1, … , p𝜈and log likelihood l(p1∶𝜈, ⋅), its AIC with respect to the data set (y1, … , yT)
is defined as
AIC = 2 ×(𝜈 − l(p1∶𝜈, y1∶T)
)
. (2)
The AIC not only takes the quality of the fit into account (with the log likelihood) but also penalizes models to avoid overfitting with too many parameters. For a given data set, the lower the AIC, the better the model. For a range of two cycles—T1from 50 to 90 years and T2from 5 to 30 years (Figure 2, bottom)—and different
temporal dependencies n (Figure 2, top), we find a strong cycle around 70–75 years and weaker ones around 18–24 years with the strongest temporal dependency at n = 5 and 13 years for Sigl and AN data, respectively.
Geophysical Research Letters
10.1002/2016GL072234
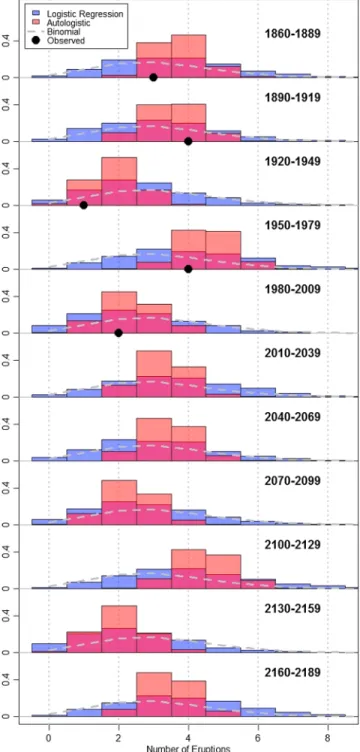
Figure 3. Histograms of the number of eruptions in each 30 year period between 1860 and 2189, based on 1000 simulations with each model. The observed numbers of eruptions are shown by the black dots for periods between 1860 and 2010.
The differences of cycle lengths and n are likely due to the accuracy of the temporal resolution of events that differs between the Sigl and AN records (see Figure 1). When fitting an autologistic model to the Sigl reconstructed IVI over the period 1000–1549 A.D., i.e., not coinciding with the AN IVI, we still find a clear resonance at T1≈70–80 and T2≈15 years. Thus, both
data sets analyzed on distinct time peri-ods yield consistent, even if slightly differ-ent, results (see Figure S3).
Having access to a large number of very high resolution ice cores has made dat-ing of individual volcanic eruptions much easier [Sigl et al., 2015]. Yet, prior to chem-ical fingerprinting of individual volcanoes and the availability of documentary infor-mation about the eruption event, the eruption years have to be inferred from the polar composites, which brings in some errors (see also section 2). We tested the effect of even small uncertainty in event years (± 1 year) on the ability of the autoregressive logistic model to recognize the correct cycle. Perturbing a hypotheti-cal record with a perfect cycle of 75 years with random errors of at most 1 year resulted in a spread of 3 years on the esti-mated cycle lengths. Therefore, ice core records are likely not sufficient to iden-tify exact cycles. Rather, results are only robust in the general frequency domain. The same eruption history can lead to slightly different IVI records, depending on local ice deposition conditions, whose analysis in turn yields close but differ-ent frequencies. The proximity of results between the two IVI data sets is in keep-ing with this interpretation.
Overall, the analysis of the much longer Sigl time series confirms the existence of a strong multidecadal variation pre-viously found by AN. Interestingly, both series also show a clear reduction in AIC (better skill) when including a dynami-cal component. The added value of the autologistic part of the model should be seen in the narrowing of the uncertainty (i.e., less spread) in the predictive skill over the well-observed validation period using a range of statistical verification scores (see Methods S3 in supporting information S1). Figure 3 compares the observed number of eruptions over dif-ferent climatological periods with the predicted histograms obtained from three models: a time-independent binomial model, the simple logistic model, and the autologistic allowing for temporal dependence. The lat-ter stands out with a marked reduction of the projected ranges, where 90% of the expected number of erup-tions per period are within three event groups. The other models are much less specific in their predicerup-tions
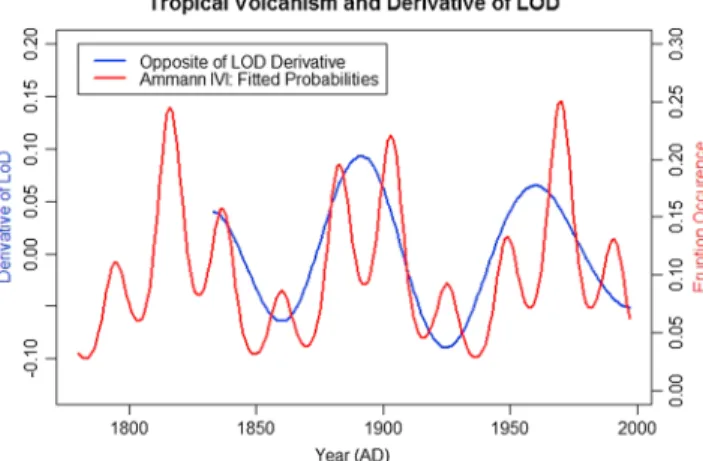
Figure 4. Fitted autologistic eruption probability (with two cycles of 73.6 and 24.4 years) over Ammann and Naveau IVI (red) and wavelet-extracted multidecadal signal in the derivative of the Lunar97 LOD data (blue).
by offering a range of nearly twice that size. For example, the projected proba-bility of witnessing at most two erup-tions in 1950–1979 is nonnegligible for both the constant and the logistic model, while it is exceedingly small for the autol-ogistic model. The observed count was 4. Similar differences exist in the other peri-ods (and independent of the selection of prediction windows). Including tempo-ral dependence appears to significantly increase the prediction skill, compared to multidecadal variability alone. Overall, this statistical analysis strongly challenges the hypothesis of random occurrence of large explosive volcanism.
Looking at the broader predictions from 1860 toward the end of the 22nd century, the autologistic model provides an en-hanced picture of variability in eruption occurrence. For example, from our statistical model fitted on the avail-able ice core record up to 1860, some climatological periods might experience four or more large eruptions (peak: 2025–2054, 2100–2129) and others at most two (minimum: 1990–2019, 2060–2089). Although such frequency variations are not including the eruption magnitudes (the issue of eruption intensity inferred from sulfate records is a complex one: see Ammann and Naveau [2010] for a thorough discussion of this question), the differences in potential cumulative impacts from volcanic cooling could be significant.
It remains to be determined which mechanism is responsible for the identified low-frequency variations and potential dynamical dependencies. Research has shown that it is possible that even small stress variations in the Earth’s crust, such as astronomic tides or other geodynamic processes, can alter the likelihood of large geophysical phenomena such as earthquakes [Ide et al., 2016]. Similarly, potential triggers for volcanic erup-tions could also be modulated by astronomical forces (e.g., lunar tides) [Mauk and Johnston, 1973] or terrestrial processes (e.g., buildup and melting of snow cover [Mason et al., 2004] or variations in sea level or air pres-sure). However, with the data at hand, it is hard to establish direct links of these processes to the multidecadal variations in explosive volcanism.
Length-of-day (LOD) variations, however, have been shown to cause significant stress in the crust [Varga et al., 2005] and also contain a significant multidecadal variation [Wang et al., 2000]. LOD is influenced by different processes across several timescales [Holme and de Viron, 2013]. Small, subannual variations are mostly due to atmosphere and ocean dynamics [Brzezi´nski et al., 2002]. But superposed on the long-term trend induced by constant friction from lunar tides [Stephenson and Morrison, 1984] are multidecadal variations with a magni-tude of several milliseconds, reflecting significantly larger changes than what surface processes can induce. These are believed to originate from the exchange of angular momentum between the Earth’s mantle and liquid core [Zatman and Bloxham, 1997], for which torsional oscillations have been proposed and later cor-roborated through simulations. One of these has a period close to 76 years [Zatman and Bloxham, 1997], consistent with the volcanic variations.
Past studies have explored potential links between the Earth’s rotation speed and geophysical processes such as volcanism and earthquakes. It has been shown that multidecadal LOD variations released a substantial amount of energy that could lead to deformations of the Earth’s crust [Varga et al., 2005] and, consequently, earthquake occurrences [Wang et al., 2000]. More recently, Sottili et al. [2015] went further, suggesting that LOD variations could also affect volcanoes, based on correlations between eruption occurrences and the LOD pattern since 1750.
To evaluate a possible link between the multidecadal LOD variations and our volcanic cycles, we look at LOD data from the Lunar97 data set [Gross, 2001], reconstructed from astronomical observations. We extract the low-frequency signal at the timescale of interest (60–80 years) with a wavelet algorithm [Oh et al., 2003]. Figure 4 compares our autologistic model of eruption likelihood with the first derivative of the observed LOD,
Geophysical Research Letters
10.1002/2016GL072234
representing the time of highest changes in the Earth’s axial rotation and thus maximized stress [Wang et al., 2000]. The multidecadal component in LOD variations, albeit based on a short record, shows close alignment with the low-frequency variations in our eruption model as well as earthquakes [Varga et al., 2005; Wang et al., 2000]. Of course, seismic activity itself could trigger eruptions [Walter and Amelung, 2007; Watt et al., 2009]. Indeed, the number of significant earthquakes (m> 7.5) in the region of El Chichón (eruption in 1982) and Pinatubo (1991) clearly increases prior to the respective events, with the eruption occurring in both cases near the peak of multidecadal earthquake activity (Figure S2). An intense seismic activity at the regional scale could therefore trigger large explosive eruptions. Despite the clear limitation arising from the short length of the LOD record, the independent agreement with IVI records possibly offers a conjecture of a link. Future research should test such a link within a broader process framework. For example, some indications exist that the sign of LOD variations could influence eruptions in subduction zones depending on the direction of plate motion [Sottili et al., 2015]. In addition, core movements have been described to exhibit strong asymmetry in latitude [Zatman and Bloxham, 1997]. Analyzing these spatial effects could help confirm or reject the LOD’s role in multidecadal explosive volcanism variations.Concerning the short-term dynamical dependencies captured by the coefficient𝛼 in model (1), the negative sign of𝛼 suggests that a large eruption is less likely to occur if another one has just occurred in the n previous years. Statistically, it is clear that incorporating𝛼 significantly improves the predictive skills of (1). However, we are unable to determine whether this is due to a physical mechanism or if it is only data driven, i.e., a sta-tistical correction to bring down the number of eruptions that would otherwise be overestimated by a simple logistic model.
5. Conclusions
In summary, by creating stresses in the crust, variations in the Earth’s spin may influence volcanic activity either by the intermediary of earthquakes or more directly as demonstrated by the correlation of LOD with the IVI. Whatever the mechanism, using the autologistic model for eruption occurrence combined with statistical generators of intensity [Ammann and Naveau, 2010], both calibrated on the latest records of past explosive volcanism, allows for a much more skillful prediction of multidecadal volcanic forcing for the coming decades than previously thought. The stochastic signal challenges the paradigm of a constant natural process and thus opens new opportunities to design statistically consistent and useful future climate change scenarios that include volcanic forcing.
References
Ammann, C. M., and P. Naveau (2003), Statistical analysis of tropical explosive volcanism occurrences over the last 6 centuries, Geophys. Res.
Lett., 30(5), 1210, doi:10.1029/2002GL016388.
Ammann, C. M., and P. Naveau (2010), A statistical volcanic forcing-scenario generator for climate simulations, J. Geophys. Res., 115, D05107, doi:10.1029/2009JD012550.
Briffa, K. R., P. D. Jones, F. H. Schweingruber, and T. J. Osborn (1998), Influence of volcanic eruptions on Northern Hemisphere summer temperature over the past 600 years, Nature, 393, 450–455, doi:10.1038/30943.
Brzezi ´nski, A., C. Bizouard, and S. D. Petrov (2002), Influence of the atmosphere on Earth rotation: What new can be learned from the recent atmospheric angular momentum estimates?, Surv. Geophys., 23, 33–69, doi:10.1023/A:1014847319391.
Dai, B., S. Ding, and G. Wahba (2013), Multivariate Bernoulli distribution, Bernoulli, 19, 1465–1483, doi:10.3150/12-BEJSP10. Dawid, A. P. (1984), Present position and potential developments: Some personal views: Statistical theory: The prequential approach,
J. R. Stat. Soc. A 147, Part, 2, 78–292.
Gazeaux, J., et al. (2013), Extracting common pulse-like signals from multiple ice core time series, Comput. Stat. Data An., 58, 45–57, doi:10.1016/j.csda.2012.01.024.
Gross, R. S. (2001), A combined length-of-day series spanning 1832–1997: LUNAR97, Phys. Earth Planet. In., 123(1), 65–76, doi:10.1016/S0031-9201(00)00217-X.
Hammer, C. U., H. B. Clausen, and W. Dansgaard (1980), Greenland ice sheet evidence of post-glacial volcanism and its climatic impact,
Nature, 288, 230–235, doi:10.1038/288230a0.
Hegerl, G. C., T. J. Crowley, S. K. Baum, K. Y. Kim, and W. T. Hyde (2003), Detection of volcanic, solar and greenhouse gas signals in paleo-reconstructions of northern hemispheric temperature, Geophys. Res. Lett., 30(5), 1242, doi:10.1029/2002GL016635. Holme, R., and O. de Viron (2013), Characterization and implications of intradecadal variations in length of day, Nature, 499, 202–204,
doi:10.1038/nature12282.
Hughes, J., M. Haran, and P. C. Caragea (2011), Autologistic models for binary data on a lattice, Environmetrics, 22, 857–871, doi:10.1002/env.1102.
Ide, S., S. Yabe, and Y. Tanaka (2016), Earthquake potential revealed by tidal influence on earthquake size-frequency statistics, Nat. Geosci.,
9, 834–839, doi:10.1038/ngeo2796.
Jones, P. D., and M. E. Mann (2004), Climate over past millennia, Rev. Geophys., 42, RG2002, doi:10.1029/2003RG000143.
Love, J. J. (2012), Credible occurrence probabilities for extreme geophysical events: Earthquakes, volcanic eruptions, magnetic storms,
Geophys. Res. Lett., 39, L10301, doi:10.1029/2012GL051431. Acknowledgments
P.N. and A.T. thank the IMAGe group for hosting them and providing the material support necessary to conduct this study. The National Center for Atmospheric Research is sponsored by the National Science Foundation and managed by the University Corporation for Atmospheric Research. This paper was supported by the ERC grant 338965-A2C2. The R code and reconstructed eruption occurrence records are available from the authors upon request.
Mason, B. G., D. M. Pyle, W. B. Dade, and T. Jupp (2004), Seasonality of volcanic eruptions, J. Geophys. Res., 109, B04206, doi:10.1029/2002JB002293.
Mauk, F. J., and M. J. S. Johnston (1973), On the triggering of volcanic eruptions by Earth tides, J. Geophys. Res., 78, 3356–3362, doi:10.1029/JB078i017p03356.
McCormick, M. P., L. W. Thomason, and C. R. Trepte (1995), Atmospheric effects of the Mt Pinatubo eruption, Nature, 373, 399–404, doi:10.1038/373399a0.
National Geophysical Data Center / World Data Service (NGDC/WDS), Global Significant Earthquake Database, Natl. Geophys. Data Cent., NOAA, doi:10.7289/V5TD9V7K [accessed April 10, 2016].
Oh, H.-S., C. M. Ammann, P. Naveau, D. Nychka, and B. L. Otto-Bliesner (2003), Multi-resolution time series analysis applied to solar irradiance and climate reconstructions, J. Atmos. Sol. Terr. Phy., 65(2), 191–201, doi:10.1016/S1364-6826(02)00291-2.
R Core Team (2013), R: A Language and Environment for Statistical Computing. R Foundation for Statistical Computing, Vienna, Austria. [Available at http://www.R-project.org/.]
Robock, A. (2000), Volcanic eruptions and climate, Rev. Geophys., 38, 191–219, doi:10.1029/1998RG000054.
Robock, A., and M. P. Free (1995), Ice cores as an index of global volcanism from 1850 to the present, J. Geophys. Res., 100(D6), 11,549–11,567, doi:10.1029/95JD00825.
Sigl, M., et al. (2013), A new bipolar ice core record of volcanism from WAIS Divide and NEEM and implications for climate forcing of the last 2000 years, J. Geophys. Res. Atmos., 118, 1151–1169, doi:10.1029/2012JD018603.
Sigl, M., et al. (2015), Timing and climate forcing of volcanic eruptions for the past 2,500 years, Nature, 523, 543–562, doi:10.1038/nature14565.
Sottili, J., D. M. Palladino, M. Cuffaro, and D. Doglioni (2015), Earth’s rotation variability triggers explosive eruptions in subduction zones,
Earth Planets Space, 67, 208, doi:10.1186/s40623-015-0375-z.
Stephenson, F. R., and L. V. Morrison (1984), Long-term changes in the rotation of the Earth: 700 BC to AD 1980, Philos. Trans. R. Soc. London,
Ser. A, 313, 47–70, doi:10.1098/rsta.1984.0082.
Stoffel, M., et al. (2015), Estimates of volcanic-induced cooling in the Northern Hemisphere over the past 1,500 years, Nat. Geosci., 8, 784–788, doi:10.1038/ngeo2526.
Varga, P., D. Gambis, Z. Bus, and C. Bizouard (2005), The relationship between the global seismicity and the rotation of the Earth, in Journées
2004 - Systémes de Référence Spatio-Temporels. Fundamental Astronomy: New Concepts and Models for High Accuracy Observations,
edited by N. Capitaine, pp. 115–120, Observatoire de Paris, Paris, 20–22 Sept., 2004.
Walter, T. R., and F. Amelung (2007), Volcanic eruptions followingM≥9 megathrust earthquakes: Implications for the Sumatra-Andaman volcanoes, Geology, 35(6), 539–542, doi:10.1130/G23429A.1.
Wang, Q.-L., Y.-T. Chen, D.-X. Cui, W.-P. Wang, and W.-F. Liang (2000), Decadal correlation between crustal deformation and variation in length of day of the Earth, Earth Planets Space, 52, 989–992, doi:10.1186/BF03352318.
Watt, S. F. L., D. M. Pyle, and T. A. Mather (2009), The influence of great earthquakes on volcanic eruption rate along the Chilean subduction zone, Earth Planet. Sci. Lett., 277, 399–407, doi:10.1016/j.epsl.2008.11.005.
Zatman, S., and J. Bloxham (1997), Torsional oscillations and the magnetic field within the Earth’s core, Nature, 388, 760–763. Zielinski, G. A. (2000), Use of paleo-records in determining variability within the volcanism-climate system, Quat. Sci. Rev., 19, 417–438,